 ProMapRanker
7 Best AI Analytics Tools for Real Time Data in 2026
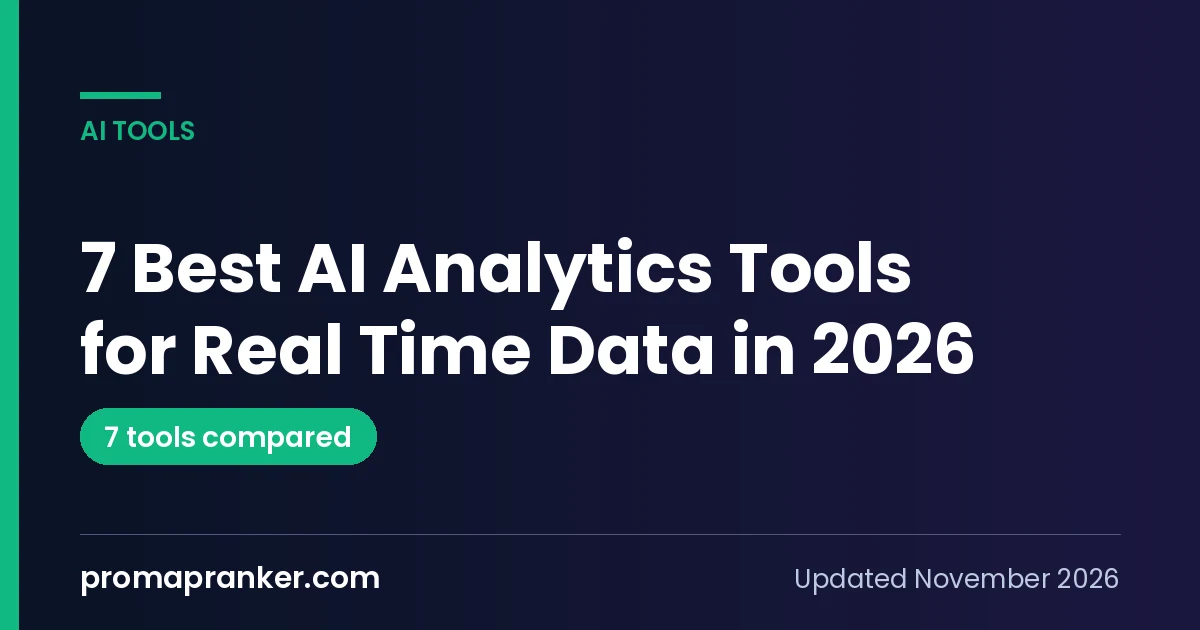

Microsoft teams that require live reports · Pricing starts at: $14 per user/month (billed yearly)
Direct answer
Microsoft Power BI is the first pick on this list for Microsoft teams that require live reports. Listed starting prices: Microsoft Power BI from $14 per user/month, Mixpanel from $0 per month for 1M events, then $100 a month for 1.5M events and Amazon QuickSight from $3 per user/month. Mixpanel is the stronger choice for product teams tracking live user events, while Amazon QuickSight suits low-cost live dashboards on AWS data. The full list of 7 tools follows, with prices and free plan facts.
This ProMapRanker guide covers 7 options for AI analytics tools for real time data. Each profile lists a starting price, free plan details, strengths and drawbacks, so you can drop poor fits quickly.
Key takeaways
- Microsoft Power BI sits first on this list: Microsoft teams that require live reports.
- For the cheapest start, look at Mixpanel: $0 per month for 1M events, then $100 per month for 1.5M.
- A free plan is available from 5 of the 7 tools: Microsoft Power BI, Mixpanel, Tableau, Amplitude, Grafana Cloud.
- For fast live queries on large event data, ClickHouse Cloud is worth a look.
Quick comparison
| Pick | Great for | Pricing starts at | Free tier | |
|---|---|---|---|---|
| Microsoft Power BI | Microsoft teams that require live reports | $14 per user/month (billed yearly) | Yes | Visit |
 Mixpanel | Product teams tracking live user events | $0 per month for 1M events, then $100 a month for 1.5M events (billed yearly) | Yes | Visit |
 Amazon QuickSight | Low-cost live dashboards on AWS data | $3 per user/month | Free trial (30 days) | Visit |
 Tableau | Governed business dashboards with live data | $15 per user/month (billed yearly) | Yes | Visit |
 Amplitude | Product analytics with AI-assisted analysis | $0 a month for 2M events (Plus starts at $0) | Yes | Visit |
 Grafana Cloud | Live operational metrics and alerts | $19 per month (Pro platform fee, plus usage) | Yes | Visit |
 ClickHouse Cloud | Quick live queries on large event data | Quote only | Free trial (30 days) | Visit |
Tool-by-tool breakdown
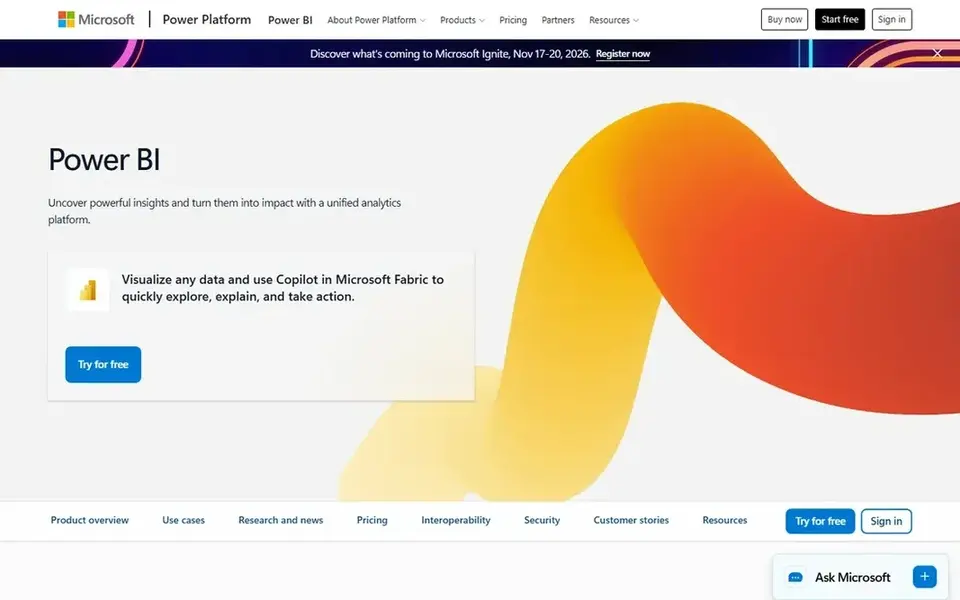
Microsoft Power BI serves Microsoft teams that require live reports. It does well for live reports through DirectQuery and streaming data Worth adding: Pro contains a 1 GB model size limit, 10 GB of native storage per license, and 8 refreshes per day, whereas Premium Per User raises the model size to 100 GB and refreshes to 48 per day.
Watch-outs: Pro datasets are restricted to 1 GB and 8 refreshes per day.
For everyday use, one limit: every viewer needs a license, so the cost grows with each viewer. Power BI Pro costs $14 per user a month, and Premium Per User costs $24 per user a month, both on yearly billing. Microsoft Power BI starts at: $14 per user/month. Microsoft Power BI has a free plan.
- Pro at $14 per user a month is low for team sharing
- DirectQuery and streaming datasets support live views
- Premium Per User at $24 is needed for 100 GB models
Mixpanel is built with product teams tracking live user events in mind. Mixpanel Free costs $0 a month and comes with up to 1M events a month, 10,000 session replays a month, up to 10 active feature flags, and 1,000 monthly experiment users.
Highlights: Free plan includes 1M events a month.
Enterprise is custom priced and supports up to 1T events a month. In daily use, growth begins at $0 for the first 1M events, then costs $100 a month for 1.5M events on yearly billing and $840 for 10M events. Mixpanel cost at the entry level: $0 per month for 1M events, then $100 per month for 1.5M. Mixpanel has a free plan. Trade-offs to know: Anomaly detection is Enterprise only.
- Unlimited seats
- Funnels and retention analysis
- Growth costs $100 a month for 1.5M events on yearly billing, so the bill rises quick with volume
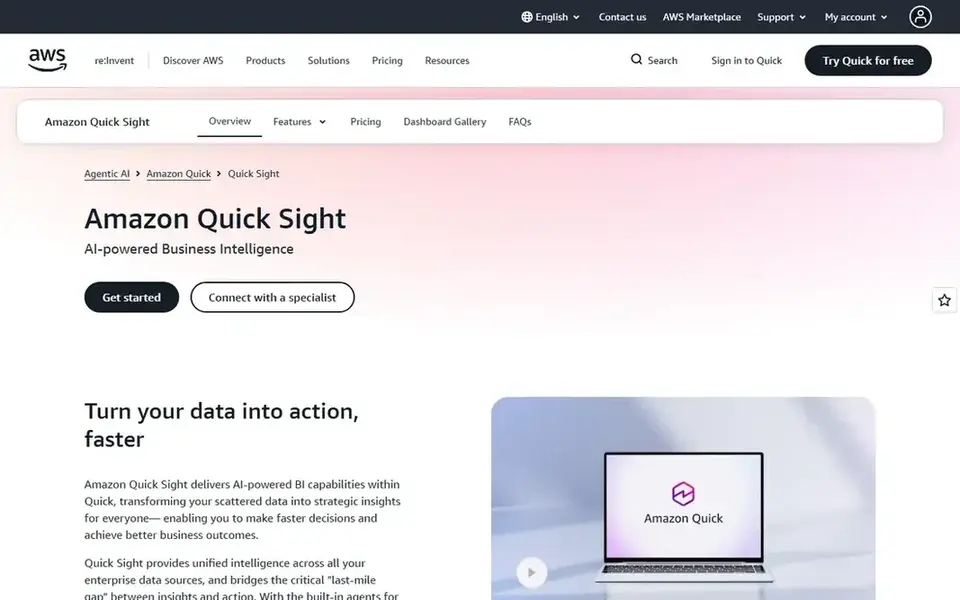
Think of Amazon QuickSight for low-cost live dashboards on AWS data. QuickSight is now the BI part of Amazon Quick, and it links well to AWS sources such as S3, Athena, and Redshift. It supports direct query for fresh data and SPICE for quick dashboards, plus alerts and anomaly detection from $0.50 per 1,000 metrics evaluated.
SPICE storage costs $0.38 per GB a month beyond the 10 GB included with each Author. As for the details, QuickSight Reader costs $3 per user a month, Author costs $24, Reader Pro costs $20, and Author Pro costs $40. Starting cost for Amazon QuickSight: $3 per user/month. Free plan details: Free trial (30 days).
Limits to weigh: Author Pro at $40 is needed for generative dashboard building.
- Reader at $3 per user a month is the lowest viewer price here
- SPICE and direct query support quick dashboards
- A $250 a month account fee applies when an account has any Pro user or Q and An enabled
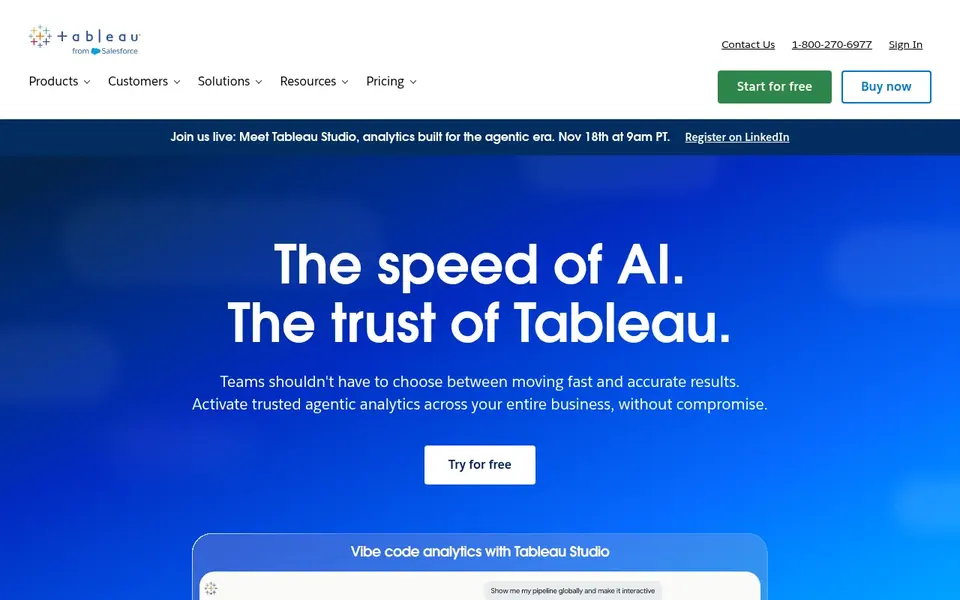
In short, Tableau is for governed business dashboards with live data. Every deployment needs a minimum of one Creator, so a one-person team cannot build a shared dashboard for $15 a month alone.
Drawbacks to consider: The $15 price is for a Viewer only.
From a buyer's view, enterprise opens at $35 for a Viewer, $70 for Explorer, and $115 for Creator. Tableau starts at: $15 per user/month. You can start on Tableau without paying.
- Live connections to databases and cloud sources
- Tableau Pulse gives metric alerts and digests
- Every deployment needs a Creator at $75 per user a month on Standard
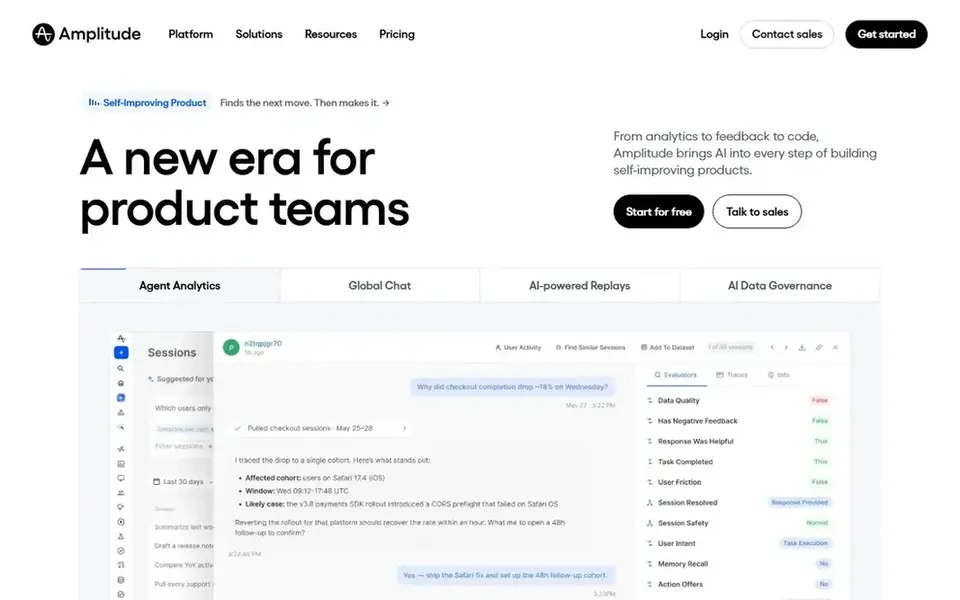
Pick Amplitude if this describes you: product analytics with AI-assisted analysis. Growth and Enterprise are custom priced and add advanced exploration, monitoring, SSO, and more replay volume.
Downsides: Live streaming is restricted on Free and Plus.
For everyday use, one limit: the free and Plus levels cap live streaming, so full streaming syncs need Growth or an add-on. Amplitude layers on AI agents, MCP access, and an AI assistant across plans, which helps teams ask questions in plain language and turn answers into charts From a buyer's view, plus begins at $0, with the first 2M events free, and scales to 70M events, adding custom events, 20 behavioral cohorts, alerts, and 2-year retention. The starting price for Amplitude: $0 per month for 2M events. You can start on Amplitude without paying. Upsides: feature flags.
- Session replay
- Plus scales to 70M events
- Growth and Enterprise are custom priced with no published list price
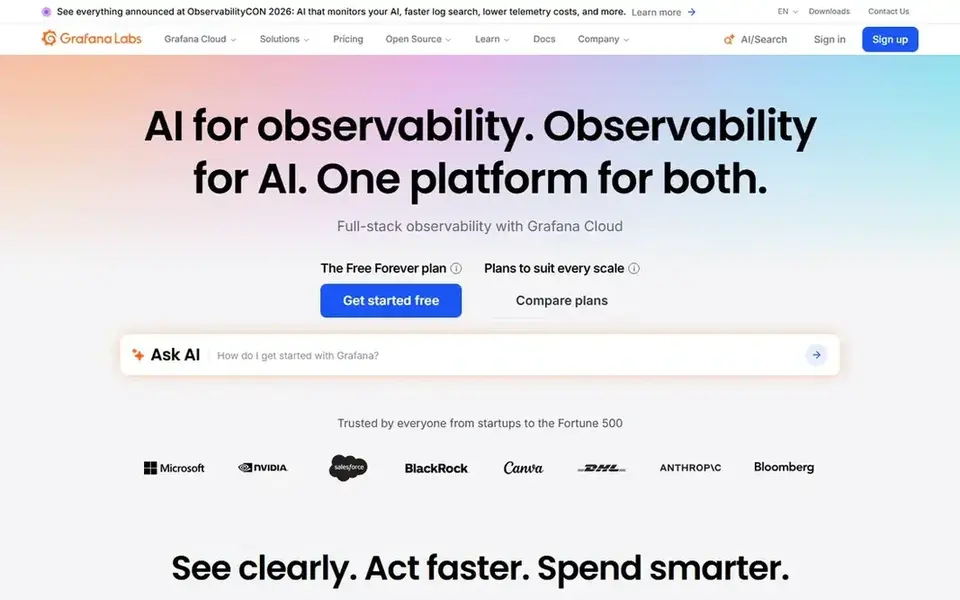
Grafana Cloud targets live operational metrics and alerts. Enterprise needs a minimum commit of $25,000 a year.
Honest limits: Additional users cost $8 per active user on Pro.
For everyday use, Grafana is the live operations pick here, since it was made for metrics, logs, and traces that update as systems run, with alerts that fire when a Grafana Cloud pricing: $19 per month. Grafana Cloud has a free plan.
- Pro extends retention to 13 months for metrics
- 50 GB each of logs, traces
- Usage above free allowances is billed separately, with metrics from $6.50 per 1,000 active series
For quick live queries on large event data, ClickHouse Cloud is a natural candidate. ClickHouse Cloud has no published monthly list price, so the starting price is quote only.
Watch-outs: Internet egress opens at $0.1152 per GB.
The bill is based on compute, storage, data transfer, and ClickPipes usage. In practice, new accounts start with $300 in credits for 30 days, and unused resources scale to zero. ClickHouse Cloud does not show a fixed starting price, so you request a quote. As for free access: Free trial (30 days).
- Pay-as-you-go billing scales compute to zero when idle
- New accounts start with $300 in credits for 30 days
- No published monthly list price, so the bill relies on compute, storage, egress
How the list was put together
The comparison looks at four things: starting price, free access, how well the feature set matches AI analytics tools for real time data, and the main limit of each tool. Where a vendor does not publish a price, the entry says quote. Where a price depends on seats or billing term, the entry says so. The sequence is a judgement call: typical use case first, then pricing transparency, then free access. Use the profiles to check fit.
Things to verify first
- Get a written quote from ClickHouse Cloud; the list shows no starting price for them.
- Read the fine print on the free plans from Microsoft Power BI, Mixpanel, Tableau and others; seat, project and feature caps differ.
- Take the trial from Amazon QuickSight and ClickHouse Cloud and push a live task through it before you pay.
- Read the limits listed for Microsoft Power BI first: Pro datasets are restricted to 1 GB and 8 refreshes per day, and Premium Per User at $24 is needed for 100 GB models.
- Price Tableau for your actual team size; headline prices rarely include add-ons or overage.
- Test the integrations you rely on with Amplitude before committing; some connectors sit on upper tiers.
Frequently asked questions
What is the primary cost trap to watch for?
The central trap is the fee outside the seat price. Mixpanel charges $100 per month for 1.5M events on yearly billing once you pass 1M events.
Is Microsoft Power BI the right pick for everyone comparing AI analytics tools for real time data?
No single tool suits every team. Microsoft Power BI comes first because it fits Microsoft teams that need live reports, while Mixpanel suits product teams tracking live user events and Amazon QuickSight suits low-cost live dashboards on AWS data. Match the tool to your own size, budget and workflow before deciding.
Which is a good match for user-facing analytics inside a product?
Microsoft Power BI comes first here and is built for Microsoft teams that require live reports. Buyers with other needs may prefer Mixpanel (for product teams tracking live user events) or Amazon QuickSight (for low-cost live dashboards on AWS data). Compare costs and limits first.
Which is a good match for live operational metrics?
Start with Microsoft Power BI if you need Microsoft teams that require live reports. Mixpanel is the better match for product teams tracking live user events, and Amazon QuickSight for low-cost live dashboards on AWS data. The best choice depends on budget, team size and workflow.
Do these tools publish their prices?
Not all of them. ClickHouse Cloud publishes no starting price, so expect a quote request for it. The rest, Microsoft Power BI included, show a starting price, though seats and billing terms still change the final cost.
How are the tools for AI analytics tools for real time data ordered?
The order follows typical fit for AI analytics tools for real time data, with Microsoft Power BI first and ClickHouse Cloud last, then price clarity and free access. It is editorial judgement, not a score, so another team could rank the tools differently.
Sources
See where you really rank - block by block
ProMapRanker scans Google Maps across a grid of your service area. Simple monthly plans from $19, white-label on every plan.
Start freeBrowse all guides
← Best AI Search Reporting Software (2026)Top 6 AI Tool for Marketers, Compared on Price (2026) →
 top ai reporting automation software
AI Reporting Automation Software in 2026: Top 6 Compared
Need the top AI reporting automation software? We compare 6 tools on cost, free access and who each suits. Prices and drawbacks included. Narrow your shortlist.
Read → better alternatives to chatgpt
ChatGPT Alternatives: 5 Tools Compared in 2026
Better alternatives to chatgpt in 2026: 5 contenders with entry costs and free tiers. Strengths and weak spots are spelled out. Pricing and limits included.
Read → best content analytics software for startups
5 Strong Content Analytics Software for Startups in 2026
Shortlisting the best content analytics software for startups? 5 products compared on cost, free access and ideal buyer. Real limits included. Start here.
Read → softr alternatives
Softr Alternatives in 2026
We compared the best softr alternatives for portals, internal tools and client apps, with current prices, data sources and the limits that change the real cost.
Read → best data migration tools
Best Data Migration Tools in 2026
The best data migration tools move data safely between systems without long downtime. We compare nine tools for databases, warehouses and cloud moves.
Read → best real-time data analytics tools comparison
Best Real-Time Data Analytics Tools in 2026
Best real-time data analytics tools compared for 2026: nine platforms for streaming, dashboards, and fast queries, with pricing, limits, and trade-offs.
Read →More in Data & Analytics · All guides A to Z by date · Latest guides