 ProMapRanker
Top Data Viz Software for Analytics in 2026


Visual dashboards and exploration · Pricing starts at: $15 per user per month
Key takeaways
- Tableau is our pick for visual exploration and polished dashboards, especially for analyst-led teams that need depth.
- Power BI is the best value for Microsoft shops, since it fits Microsoft 365 and Fabric workflows at a lower per-user price.
- Looker Studio is the best free starting point for Google data, while Looker suits teams that need governed metrics defined as code.
- ThoughtSpot suits business users who want to ask questions in plain language, rather than build charts by hand.
- Price the full rollout, including viewers, creators, and data costs, since a low creator price can hide a large viewer bill.
Quick comparison
| Pick | Great for | Pricing starts at | Free tier | |
|---|---|---|---|---|
| Tableau | Visual dashboards and exploration | $15 per user per month | Free trial | Visit |
 Power BI | Microsoft teams and value | $14 per user per month | Yes | Visit |
 Looker Studio | Free Google dashboards | Free | Yes | Visit |
 Looker | Governed metrics as code | See website | Free trial | Visit |
 Qlik Sense | Associative exploration | See website | Free trial | Visit |
 ThoughtSpot | Search-driven analytics | $25 per user per month | Free trial | Visit |
 Metabase | Simple self-service BI | Free | Yes | Visit |
 Grafana | Real-time and time-series dashboards | See website | Yes | Visit |
The best data viz software for analytics
Data visualization tools turn rows into charts, but they differ in who builds the chart, where the data lives, and how much governance sits behind the numbers. The tools below range from free dashboards to enterprise platforms, and the right one depends on your data stack, your team skills, and how many people will view versus build reports.
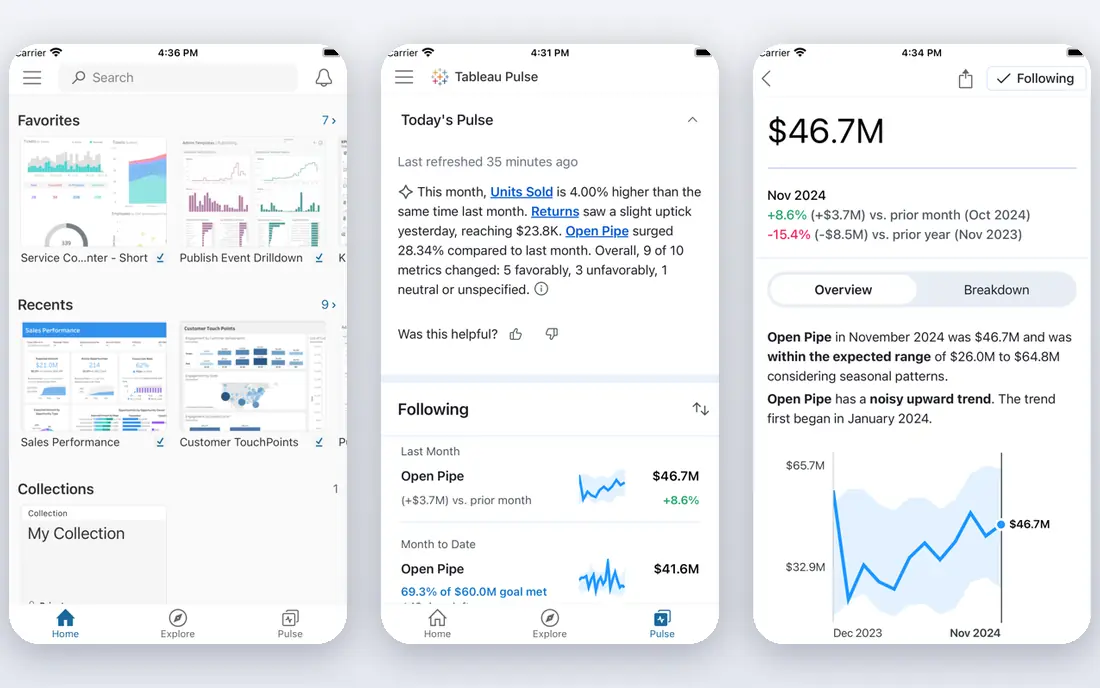
Tableau remains the visual leader for analysts who explore data by dragging fields, filtering, and drilling into detail. Its dashboards look polished, its calculations handle complex logic, and its community offers templates and help for common problems. For a team that values visual quality and exploratory freedom, Tableau sets the standard.
Pricing needs care. The $15 per user per month figure covers a Viewer role on some plans, while Creator licenses cost substantially more, so price the mix of viewers and creators you actually need. Tableau also rewards a data model that is clean before dashboards are built, so allow time for source preparation on a larger rollout.
- Deep visual exploration
- Polished dashboards
- Strong community and learning resources
- Works with many data sources
- Creator licenses cost far more than Viewer licenses
- Learning curve for advanced features
- Enterprise rollout needs planning
Power BI is the value pick for teams already using Microsoft 365, Teams, and Excel. Its Pro price of $14 per user per month, when paid yearly, undercuts many rivals, and its data modeling feels familiar to Excel users. Reports publish to a workspace, refresh on schedule, and embed in Teams, which helps adoption in a Microsoft shop.
Outside that ecosystem, Power BI is less compelling, and its free account limits sharing, so a team needs Pro or a Fabric capacity for collaboration. Advanced AI features also need higher capacity tiers, so check those costs before promising AI summaries to executives. For a Microsoft team, though, the price and integration are hard to beat.
- Low per-user price for Pro
- Tight Microsoft 365 and Fabric integration
- Strong modeling and Excel familiarity
- Best experience is inside Microsoft ecosystem
- Advanced AI features need higher capacity
- Sharing rules can confuse new users
Looker Studio, formerly Data Studio, is the free starting point for many small teams. It connects easily to Google Analytics, Google Ads, Sheets, and BigQuery, and it lets a marketer or analyst build a live dashboard in an afternoon without a license. Sharing is simple, and the learning curve is low compared with enterprise BI.
Its limits show up as data grows. Metric definitions can drift across dashboards, advanced modeling is limited, and large data sets can slow reports. Looker Studio is best for departmental reporting and marketing dashboards, while teams that need governed, company-wide metrics should look at Looker or another governed platform.
- Free for core dashboards
- Easy links to Google Analytics, Ads, and Sheets
- Simple sharing
- Weaker governance and metric control
- Limited advanced modeling
- Performance varies with large data sets
Looker, now part of Google Cloud, suits teams that want one definition of revenue, churn, or active users, enforced in code. Its LookML layer lets data engineers define metrics once, version them, and reuse them across dashboards, so business users see consistent numbers. Live queries against a warehouse also avoid stale extracts.
That governance comes with cost and skill needs. Pricing is quoted, often at enterprise levels, and Looker needs data engineering support to build and maintain models. A small team without that support will move slower than with Looker Studio or Metabase. For a BigQuery-first company with a data team, Looker is a strong long-term choice.
- LookML defines metrics as code with version control
- Strong governance
- Live queries against BigQuery and other warehouses
- Quote-based pricing
- Needs data engineering support
- Longer time to first dashboard than simpler tools
Qlik Sense uses an associative engine that lets users explore data freely, seeing how selections in one chart affect others, without writing a query for each question. That approach suits analysts who discover patterns by exploring, rather than by building a fixed report. It also offers strong enterprise controls for larger deployments.
Pricing is often quoted, and designing a polished Qlik app takes practice, so a first dashboard may take longer than in a simpler tool. Qlik Sense is best for mid-size and large teams that value exploration and already have data staff, rather than for a small team that needs a quick marketing dashboard.
- Associative engine reveals links across data sets
- Strong exploration without pre-built queries
- Enterprise security and governance
- Pricing is quote-based for many buyers
- Learning curve for app design
- Smaller community than Tableau or Power BI
ThoughtSpot changes who can ask a question. Instead of building a chart by dragging fields, a business user types a question in plain language, such as sales by region last quarter, and ThoughtSpot builds the chart. That search-first model helps executives and managers who need answers but do not want to learn a BI builder.
The platform still needs clean data models behind the search, so a data team must prepare sources and define metrics first. Pricing also needs a check, since the $25 per user per month starting figure in comparisons applies to a limited user band on some plans. ThoughtSpot is strongest when business users ask many ad hoc questions and a data team can maintain the models.
- Search in plain language to build charts
- Good for business users without SQL
- Embedded analytics options
- Starting price applies to a limited user range on some plans
- Modeling still needs data work
- Cost grows with users
Metabase is the friendly open source option for startups and small teams. Non-technical users can ask a question, pick a table, filter it, and save a chart, without writing SQL, while analysts can still write SQL when needed. The open source edition is free to self-host, and a cloud plan removes hosting work for a monthly fee.
It is not a full enterprise BI platform. Governance, advanced modeling, and large-scale permissions are lighter than Tableau, Power BI, or Looker, and growing teams will eventually need a paid plan. For a small team that needs clear dashboards fast, Metabase offers a low-cost, low-friction start.
- Free open source edition
- Question-based interface for non-technical users
- Easy self-hosting or cloud option
- Advanced modeling and governance are lighter than enterprise tools
- Large deployments need paid plans
- Some features need SQL
Grafana is the monitoring dashboard of this list, and it excels at time-series data: server metrics, application performance, IoT readings, and live operational data. Its open source edition is free, its alerting is strong, and its panels handle real-time updates better than general BI tools. Operations and engineering teams rely on it for live visibility.
For general business reporting, such as sales by product or marketing funnels, Grafana is less natural than Tableau or Power BI, and its setup rewards technical skill. Choose Grafana when your main need is live, time-based monitoring, and pair it with a business BI tool if you also need executive reporting.
- Excellent time-series and real-time dashboards
- Free open source edition
- Wide data source and alerting support
- Less suited to general business reporting
- Setup needs technical skill
- Business chart types are more limited
How we picked these
We compared vendor pricing pages, feature pages, and recent BI comparisons, and we favored tools that still offer dashboards and analytics in October 2026. We included free, mid-price, and enterprise options, plus a monitoring specialist, so a reader can match a tool to data stack and team size. Where pricing varied by role, capacity, or user band, we wrote See website or gave the published starting figure with that limit noted.
What to check before you choose
Model the viewer and creator mix
A BI bill is rarely one price times headcount. Creators who build dashboards cost more than viewers who only read them, and some platforms charge for capacity on top of seats. List how many builders, analysts, and viewers you have, then price that exact mix on each shortlisted tool before you compare headline prices.
Check the data connection, not just the chart types
A beautiful chart is useless if the tool cannot query your warehouse, CRM, or spreadsheet cleanly. During a trial, connect your real sources, test refresh speed, and check whether queries run live or on extracts. Live warehouse queries stay fresh, while extracts need a refresh schedule and can go stale.
Test with a real business question
Build one dashboard that answers a question your team actually asks each week, such as revenue by channel or support tickets by type. Watch how long it takes, how the chart handles filters, and how it looks on a phone. That single test reveals more than a feature list, and it shows whether business users will adopt the tool after launch.
Frequently asked questions
What is the best data viz software for analytics for a small business?
Metabase and Looker Studio are strong small-business picks, since both offer free starting options and simple dashboards. Power BI is a good next step if you use Microsoft 365 and need sharing and modeling. Choose based on your data sources, not just price.
Is Tableau or Power BI better?
Tableau leads on visual exploration and dashboard polish, while Power BI leads on price and Microsoft integration. Analyst-led teams that explore data deeply often prefer Tableau, while Microsoft shops that need broad sharing at a lower cost often prefer Power BI. Trial both with your real data before deciding.
Can I use a free data visualization tool for business reporting?
Yes, for departmental and small-team reporting. Looker Studio is free for core dashboards, and Metabase offers a free open source edition. Free tools work well until you need governed metrics, advanced permissions, or large-scale sharing, at which point a paid platform becomes worth the cost.
What is the difference between Looker and Looker Studio?
Looker Studio is a free, simple dashboard tool for Google data and other sources, with limited governance. Looker is a governed platform that defines metrics as code in LookML, with version control and enterprise pricing. Teams often start with Looker Studio and move to Looker when metric consistency becomes critical.
Do I need SQL to use these tools?
Not always. Metabase, ThoughtSpot, and Looker Studio let business users build charts without SQL for common questions. Analysts still benefit from SQL for complex modeling, and Looker needs data engineering for LookML. Pick a tool that matches the skills of the people who will build reports day to day.
How much does data visualization software cost at scale?
Costs vary by viewers, creators, capacity, and data volume, so a small-team price can grow fast at enterprise scale. Power BI Pro starts at $14 per user per month, Tableau Viewer starts at $15 per user per month on some plans, and ThoughtSpot starts at $25 per user per month in comparisons, while Looker and Qlik Sense are quoted. Model your full user mix before budgeting.
Sources
See where you really rank - block by block
ProMapRanker scans Google Maps across a grid of your service area. Simple monthly plans from $19, white-label on every plan.
Start freeKeep reading
 wpforms alternatives
Best WPForms Alternatives in 2026
We compare 9 wpforms alternatives for WordPress forms, with free and paid options, current pricing notes, and honest limits for small business sites in 2026.
Read → windows task scheduler alternatives
Best Windows Task Scheduler Alternatives in 2026
Looking for Windows Task Scheduler alternatives? We compare 9 schedulers for Windows and cross-platform work, from free tools to enterprise automation.
Read → which ai video service is best
Which AI Video Service Is Best in 2026
which ai video service is best? We compare 10 legitimate AI video services on price, avatars, editing and output quality to help you pick the right tool.
Read →