 ProMapRanker
Best Software for Managing SaaS Growth Metrics in 2026
Direct answer
Start with Mixpanel if you need product-led growth analysis. Listed starting prices: Mixpanel from $100 per month, ChartMogul from $57 per month and Databox from $79 a month. Looker fits governed metrics with a semantic layer; ChartMogul fits subscription intelligence and revenue analytics. The other 2 tools in the list cover narrower or pricier cases.
Short on time? The summary and table above give the quick view of 5 software for managing SaaS growth metrics, and the profiles that follow give the detail behind each entry.
Key takeaways
- Mixpanel takes the first slot, best suited to product-led growth analysis.
- Mixpanel, ChartMogul, Tableau: these are the 3 tools out of 5 that offer a free plan.
- Starting prices begin at $15 per user per month with Tableau.
- For visual exploration of growth data, Tableau is worth a look.
- Check the limits for Mixpanel before you commit: not built as a billing or revenue system.
Quick comparison
| Pick | Great for | Pricing starts at | Free tier | |
|---|---|---|---|---|
 Mixpanel | Product-led growth analysis | $100 per month | Yes | Visit |
 Looker | Governed metrics with a semantic layer | See website | Not stated | Visit |
 ChartMogul | Subscription intelligence and revenue analytics | $57 per month | Yes | Visit |
 Databox | Performance data and AI workflows | $79 a month | Free trial | Visit |
 Tableau | Visual exploration of growth data | $15 per user a month | Yes | Visit |
Tool-by-tool breakdown
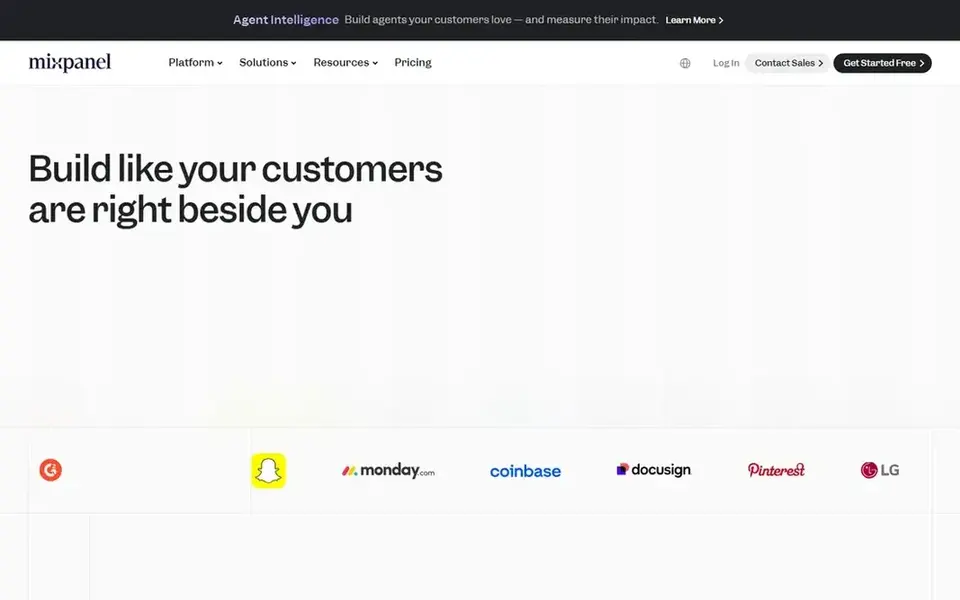
For product-led growth analysis, Mixpanel is a natural candidate. It suits product and growth teams that want to understand how users behave inside the product and link that behavior to growth.
Choose Mixpanel when product usage is the growth question you are answering. On cost, Mixpanel starts like this: $100 per month. A free plan is available with Mixpanel.
Downsides: Needs thoughtful event tracking setup.
- Analytics with session replay and experiments
- Feature flags and AI-powered insights
- Not built as a billing or revenue system
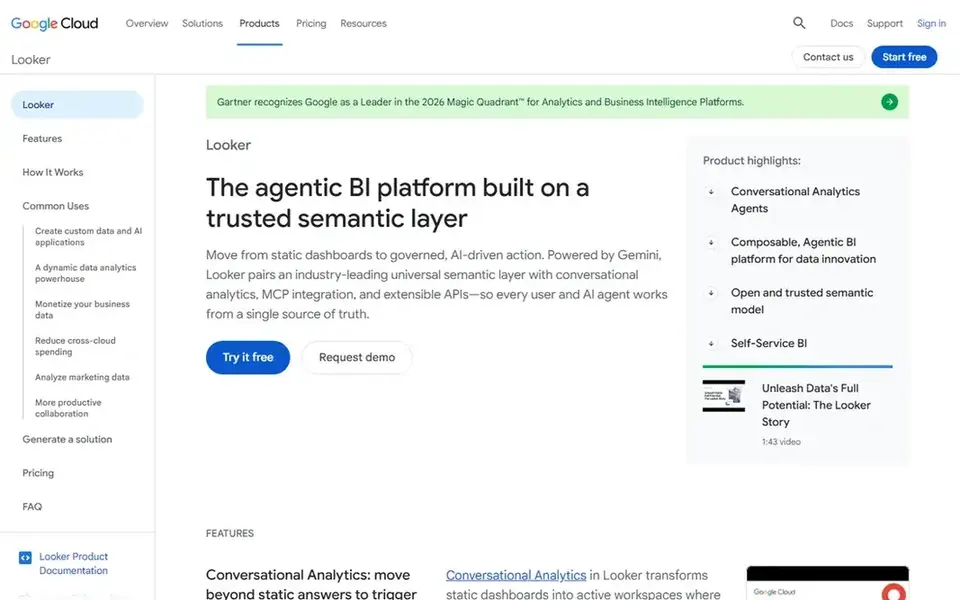
Looker is built with governed metrics with a semantic layer in mind. Organizations embedding analytics into their own products also benefit from its embedded capabilities.
Where it is weaker: Heavier setup than plug-and-play tools.
Looker is Google Cloud's business intelligence and embedded analytics product, built around a trusted semantic layer and Gemini agents. If you want metrics without building a semantic layer, a subscription analytics tool is quicker. Pricing for Looker is not stated here, so ask the vendor for current figures. Trial and free access: Not stated.
- Trusted semantic layer brings together metrics
- Embedded analytics and AI agents
- Needs data modeling expertise
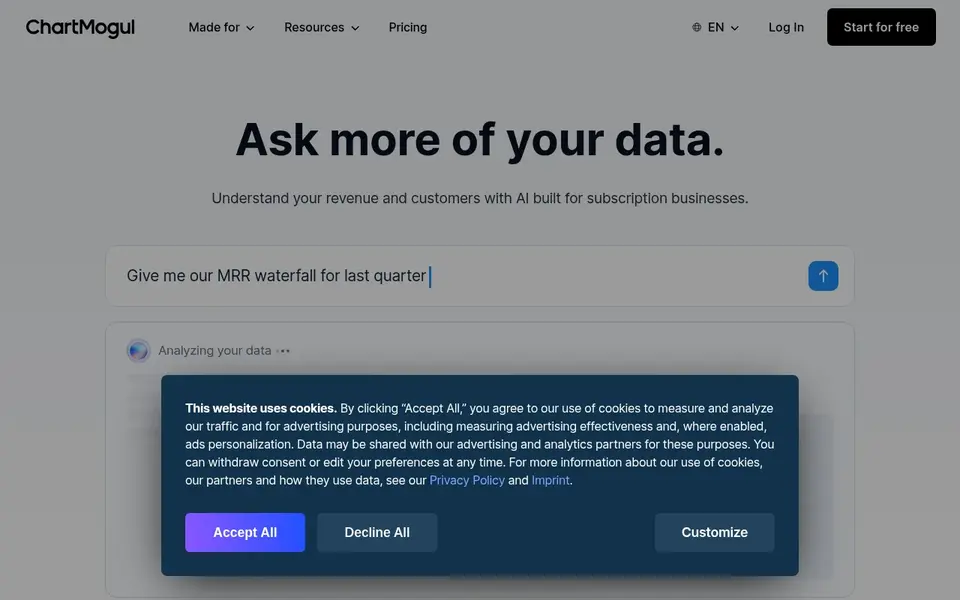
ChartMogul is aimed squarely at subscription intelligence and revenue analytics. ChartMogul positions itself as an AI-native stack for subscription intelligence, describing a Bloomberg-like view that unites analytics, engagement and benchmarks into one live picture.
Choose it when subscription metrics are the core question. Teams needing recurring revenue visibility alongside engagement signals are the natural audience. Price to start with ChartMogul: $57 per month. You can start on ChartMogul without paying.
Trade-offs to know: Needs clean billing data to be handy.
- Engagement and benchmarks
- Live view of subscription performance
- Concentrated on subscription data instead of full product analytics
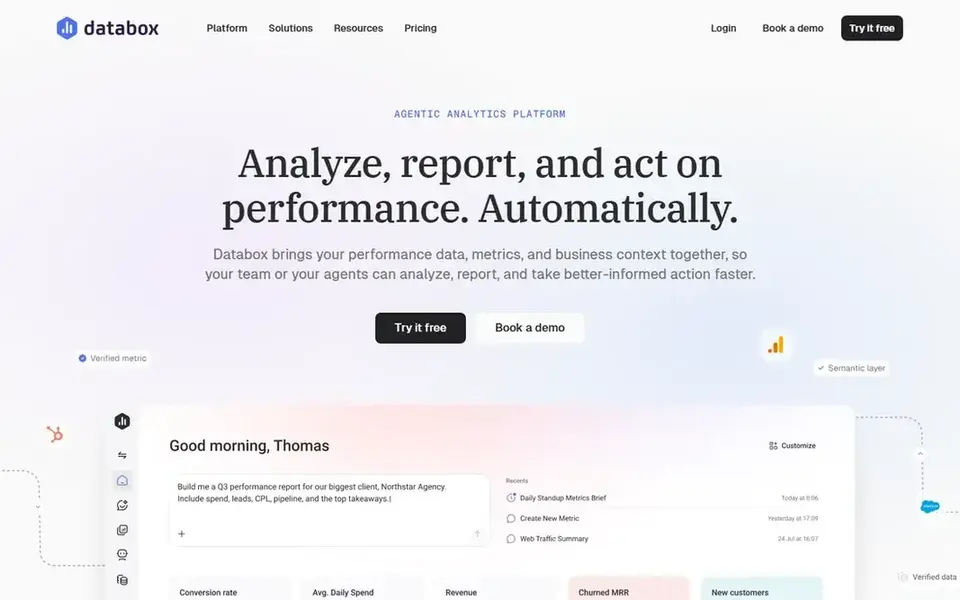
Databox works best for performance data and AI workflows. Databox is described as an agentic analytics system that brings performance data, business context and AI workflows together so teams or agents act quicker.
Watch-outs: Best value with several data sources connected.
If your priority is governed enterprise BI, a system like Looker or Tableau may fit better. What you pay to start with Databox: $79 per month. Free options: Free trial.
- Brings performance data and context together
- Workflows help teams and agents act quicker
- Less depth in subscription-specific metrics
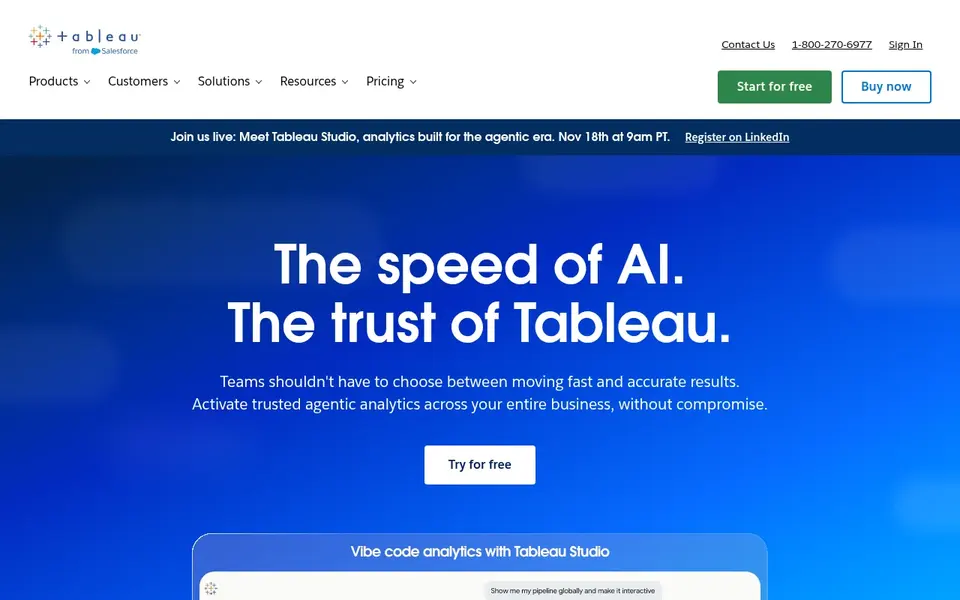
Tableau was built for visual exploration of growth data. Tableau helps people see and understand their data, connecting to almost any database and letting users build visualizations by dragging and dropping, then share with a click.
Tableau is solid on visualization but does not by itself enforce a single metric definition, so governance needs attention. Beyond that, pick Tableau when visual adaptability and wide connectivity matter most. The starting price for Tableau: $15 per user per month. You can start on Tableau without paying.
Points against: Metric definitions need separate governance.
- Links to almost any database
- Drag-and-drop visualizations shared with a click
- Dashboard sprawl is a typical risk
How these tools were picked
For each of the 5 tools we noted price, free plan or trial, fit for software for managing SaaS growth metrics and the main limit, using vendor pages and documentation. Where a price is missing, the vendor does not list one publicly or ties it to a quote. Always confirm before budgeting. Order on the page follows fit for the typical buyer first, then price transparency and free access. Your own requirements should decide the final pick.
Pre-purchase checklist
- Get a written quote from Looker; the list shows no starting price for them.
- Read the fine print on the free plans from Mixpanel, ChartMogul and Tableau; seat, project and feature caps differ.
- Run a trial of Databox with real work before paying for a year; your own workflow is the best test.
- Read the limits listed for Mixpanel first: not built as a billing or revenue system.
- Get the contract term, renewal terms and any onboarding fees from Looker in writing.
- Work out what Tableau costs with your real seat count, add-ons and usage, not just the entry price.
Frequently asked questions
What is the cheapest option for software for managing SaaS growth metrics in this list?
On published monthly entry prices, Tableau is the lowest here at $15 per user per month. Entry price is only part of the cost, because seats, add-ons and billing terms can change the total. Each of the 5 options in this software for managing SaaS growth metrics guide has its own card above with the price, free plan and limits.
Do these tools publish their prices?
Not all of them. Looker publishes no starting price, so expect a quote request for it. The rest, Mixpanel included, show a starting price, though seats and billing terms still change the final cost.
How are the tools for software for managing SaaS growth metrics ordered?
The order follows typical fit for software for managing SaaS growth metrics, with Mixpanel first and Tableau last, then price clarity and free access. It is editorial judgement, not a score, so another team could rank the tools differently.
What is the difference between subscription analytics and product analytics tools?
Subscription analytics tools focus on recurring revenue, customers and billing-derived metrics. Product analytics tools focus on user behavior, funnels and experiments inside the product.
Can I try these tools before paying?
Often, yes. Mixpanel, ChartMogul and Tableau have a free plan and Databox offers a free trial. Use your own data and a real task during the test, and check what the free tier or trial limits before you rely on it.
Sources
See where you really rank - block by block
ProMapRanker scans Google Maps across a grid of your service area. Simple monthly plans from $19, white-label on every plan.
Start freeBrowse all guides
← Procurement Software for Warehouses in 2026: Top 7 ComparedBest tools for Churn Prediction in SaaS in 2026 →
 best procurement software for university warehouses
8 Best Procurement Software for University Warehouses for 2026
Best procurement software for university warehouses: 8 tools compared on price, free plans and fit. Weak spots flagged for every entry. Budget notes included.
Read → best procurement analytics software
7 Best Procurement Analytics Software for 2026
7 products for the best procurement analytics software, ranked by fit, with starting costs and free tiers. Limits and pricing notes included. Easy to scan.
Read → best procurement analytics software for food distributors
6 Best Procurement Analytics Software for Food Distributors (2026)
Best procurement analytics software for food distributors in 2026: 6 contenders with entry costs and free tiers. Pros and cons for every tool. No filler.
Read → which etl platform is best for data integration
Which ETL Platform Is Best for Data Integration in 2026
Find which ETL platform is best for data integration, with Fivetran, Airbyte, Hevo, and more compared on pricing, connectors, volume, and team fit for buyers.
Read → best embedded analytics platforms
Best Embedded Analytics Platforms in 2026
We compared the best embedded analytics platforms for putting dashboards inside your product, from open source tools to enterprise suites in 2026 today.
Read → best reporting tools
Best Reporting Tools in 2026
Compare the best reporting tools for dashboards, scheduled reports, and business insights, from Power BI and Tableau to Looker Studio for every team size.
Read →More in Data & Analytics · All guides A to Z by date · Latest guides