 ProMapRanker
Best Reporting Tools in 2026


Microsoft 365 teams · Pricing starts at: $14 per user per month
Key takeaways
- Reporting tools turn data from spreadsheets, databases, and apps into dashboards and scheduled reports people can act on.
- Looker Studio is the best free starting point, while Power BI suits Microsoft shops and Tableau suits deep visual analysis.
- Zoho Analytics and Metabase give small teams strong reporting without enterprise prices.
- The tool matters less than clean data and agreed metrics, so define what each number means before you build dashboards.
Quick comparison
| Pick | Great for | Pricing starts at | Free tier | |
|---|---|---|---|---|
| Microsoft Power BI | Microsoft 365 teams | $14 per user per month | Yes | Visit |
 Tableau | Deep visual analysis | $15 per user per month | Free trial | Visit |
 Looker Studio | Free reporting on Google data | Free | Yes | Visit |
 Zoho Analytics | Small business reporting | $24 per month | Yes | Visit |
 Metabase | Self-serve dashboards on a database | Free | Yes | Visit |
 Qlik Sense | Associative data exploration | See website | Free trial | Visit |
 ThoughtSpot | Search driven reporting | $25 per user per month | Free trial | Visit |
 Domo | Executive dashboards at scale | See website | Free trial | Visit |
The best reporting tools
The best reporting tool depends on your data, your team skills, and who reads the reports. This list covers free tools, small business options, and enterprise platforms, so you can shortlist by fit rather than by brand alone.
Power BI is the natural reporting choice for organizations already built on Microsoft 365, Excel, Teams, and Azure. Power Query cleans and shapes data, the modeling layer supports calculated measures, and sharing through the Power BI service puts reports where Microsoft users already work. The free Desktop app lets analysts build reports without a license, while Pro at $14 per user per month adds sharing and collaboration.
Costs rise as viewer numbers grow, since viewers need licenses in most setups, and Copilot and large dataset features need higher capacity plans. For Microsoft shops, though, the integration and price still beat most rivals. Start with Desktop, prove the reports on real data, then license the team that needs to view and share them.
- Deep Microsoft 365 and Excel integration
- Strong data modeling with Power Query
- Wide connector set
- Viewer costs rise with team size
- Advanced AI features need higher capacity plans
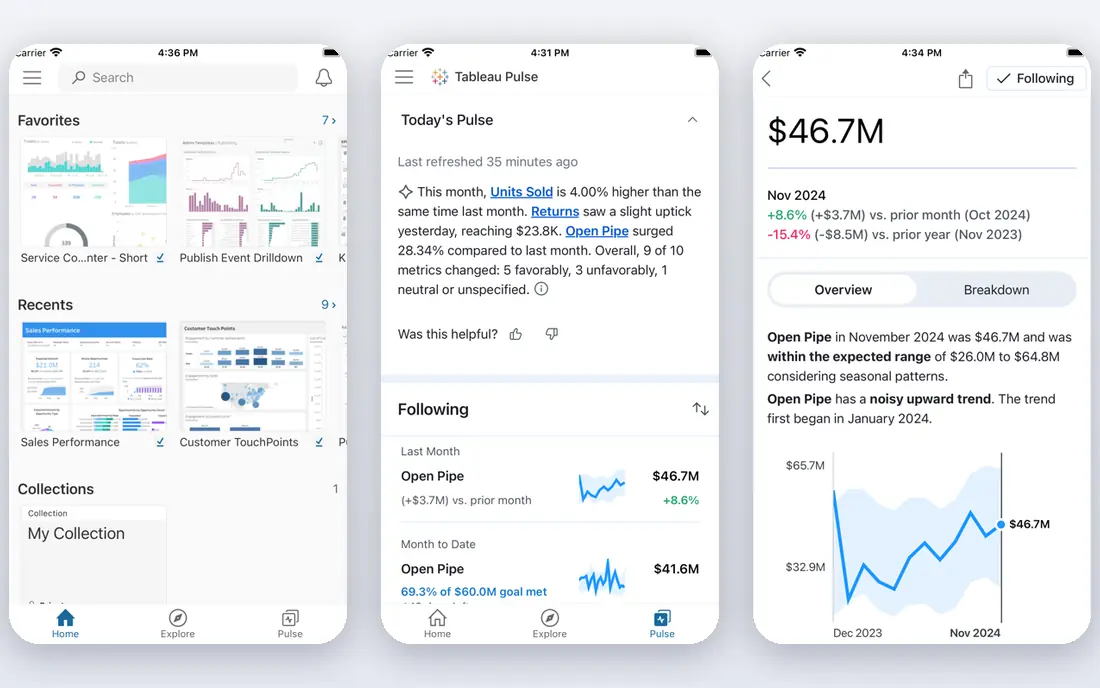
Tableau remains the benchmark for visual analysis, with drag and drop exploration, rich chart types, and dashboards that invite readers to dig into the data. Analysts can build interactive views quickly, and the storytelling features suit executive and client-facing reports that need polish. Viewer pricing starts at $15 per user per month, with Creator at $75 per user per month on annual billing.
The total cost is higher than Power BI or Looker Studio once creators, viewers, and training are counted, and casual users may need help to build their own views. For teams where visual depth and presentation matter, Tableau is worth that cost. For simple scheduled reports, a lighter tool will do the same job for less.
- Best in class visual analysis
- Flexible dashboards and storytelling
- Strong community and learning resources
- Higher total cost for creators
- Needs skilled analysts for best results
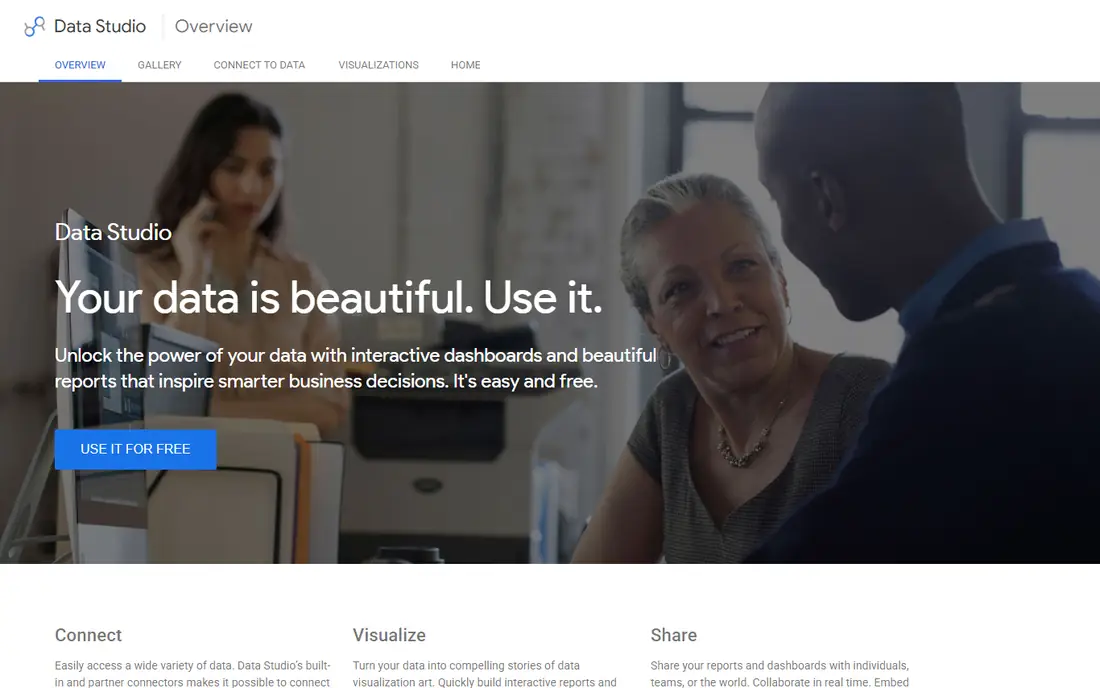
Looker Studio, formerly Google Data Studio, is the best free reporting tool for most small businesses, especially those already using Google Analytics, Google Ads, and Sheets. Connectors for Google sources are native, dashboards are easy to share by link, and scheduled email delivery keeps reports in front of stakeholders without manual work. The Pro plan, at $9 per user per project per month, adds team features and AI assistance.
Data modeling is limited compared with Power BI or Looker, and blending many non-Google sources can get messy. For marketing, sales, and operations reports built on Google data, those limits rarely matter. Start here if your budget is zero, and move to a paid platform only when modeling or governance needs force the switch.
- Free to use
- Native Google Analytics, Ads, and Sheets connectors
- Easy sharing by link
- Limited data modeling
- Pro features need a paid plan
Zoho Analytics is the best budget reporting tool for nontechnical small business teams. Plans bundle users and rows, with Basic at $24 per month for 2 users on annual billing, and a free plan for very small use. Drag and drop reports, dashboards, and scheduled emails cover most business reporting needs, and the Zia AI assistant answers plain language questions about the data.
Enterprise governance controls are thinner than Power BI or Tableau, and row limits mean fast-growing companies may need higher plans sooner. For small teams that want reports without hiring a data analyst, Zoho Analytics is the easiest paid option in this list, and its free plan is genuinely usable for micro-businesses.
- Low cost bundled plans
- Easy drag and drop reports
- AI assistant for plain language questions
- Fewer enterprise governance controls
- Row and user limits vary by plan
Metabase is the favorite for technical teams that want self-serve dashboards on top of a SQL database without heavy licensing. The open source version is free to self-host, and the no-code question builder lets nontechnical users ask simple questions, while analysts can write full SQL when they need to. Cloud plans start at $100 per month for 5 users, with a free open source path for teams that can host it themselves.
Governance, permissions, and row-level security are lighter than enterprise platforms, and some advanced features need Pro or Enterprise plans. For startups and product teams with a database and some SQL skill, Metabase gives fast, affordable reporting. For regulated enterprises, a governed platform such as Power BI or Looker fits better.
- Open source self-hosted option
- SQL friendly with a no-code question builder
- Easy dashboard sharing
- Lighter governance than enterprise tools
- Cloud pricing is a platform fee plus users
Qlik Sense uses an associative engine that lets users explore data freely, seeing how selections in one field affect all others. That approach suits analysts who need to follow questions wherever they lead, rather than following a fixed dashboard path. Data preparation tools, a large connector set, and support for large datasets make it a solid enterprise reporting choice, with cloud plans starting at $300 per month for 10 users on annual billing.
Pricing tiers can be complex, and setup takes more effort than Looker Studio or Zoho Analytics. Teams without data skills may also need training to use the exploration features well. For midsize and large teams that value free exploration over fixed reports, Qlik Sense is a strong, proven platform.
- Associative engine for exploring data freely
- Strong data preparation
- Good for large datasets
- Pricing is tiered and can be complex
- Setup effort is higher than Looker Studio
ThoughtSpot lets business users search for answers in plain language, such as revenue by region last quarter, and get a chart or table back without building a dashboard first. Liveboards turn those searches into shared reports, and AI agents help with follow-up questions. Essentials starts at $25 per user per month, with Pro at $50 per user per month on annual billing.
The catch is data quality. Search works only when the underlying data is clean and well modeled, so teams with messy sources need data work before ThoughtSpot shines. For organizations that have already modeled their data and want business users to self-serve, ThoughtSpot cuts the queue for analyst-built reports better than any tool here.
- Search reports in plain language
- AI agents and liveboards
- Easy for business viewers
- Needs clean, well modeled data
- Quote based plans above Pro
Domo is built for executive dashboards at scale, pulling data from hundreds of sources into real-time views that leaders can read on any device. Its consumption-based pricing allows unlimited users, which suits companies that want to share dashboards widely without per-seat costs spiraling. Mobile dashboards and alerts keep executives in touch with key metrics between meetings.
Pricing is quote based and consumption driven, so total cost depends on usage, and implementation is a larger project than Looker Studio or Zoho Analytics. For large companies that need polished executive reporting across many teams, Domo is a strong enterprise choice. For small teams, a free or low-cost tool will cover the same reports for far less.
- Executive dashboards with many connectors
- Consumption based pricing with unlimited users
- Strong mobile experience
- Quote based pricing
- Implementation is a larger project
How we picked these
We compared vendor pricing pages, product documentation, and current reporting tool evaluations, and we kept only tools that work in October 2026 and support dashboards plus scheduled or shared reports. We favored a mix of free, small business, and enterprise options, so teams of different sizes and skills can find a fit. Prices shown are starting prices from vendor and review sources, and quote based tools are marked as such.
Choosing the right reporting tool for your team
Match the tool to your data and your readers. Google-centered teams should start with Looker Studio. Microsoft-centered teams should start with Power BI. Small teams without analysts should try Zoho Analytics or Metabase. Teams that need polished visual analysis should shortlist Tableau, and teams that want business users to search for answers should test ThoughtSpot.
Define metrics before you build dashboards
A dashboard built on unclear metrics will mislead no matter how good the tool is. Agree on what each number means, which source is authoritative, and how often it refreshes, then build the report. That discipline matters more than chart choice, and it is what separates a trusted report from a pretty one.
Start with one report that matters
Do not build a dashboard for every team at once. Pick one report that a real decision depends on, build it well, and get it used every week. Once that report is trusted, expand to the next one. A single used report beats ten unused dashboards, and it proves the tool before you license the whole company.
Frequently asked questions
What is the best reporting tool for small businesses?
Looker Studio is best for free reporting, especially on Google data, while Zoho Analytics is best for low-cost paid reporting with bundled users. Metabase is best for technical small teams with a SQL database and a tight budget.
What is the best reporting software for enterprises?
Power BI suits Microsoft enterprises, Tableau suits visual analysis at scale, and Domo suits executive dashboards shared widely. Looker, Qlik Sense, and ThoughtSpot also suit enterprises, depending on governance, exploration, and search needs.
What is the difference between reporting tools and BI tools?
The terms overlap. Reporting tools focus on dashboards and scheduled reports that show what happened, while BI tools add analysis, modeling, and forecasting. Most modern platforms in this list do both, so pick by your reporting and analysis needs rather than by the label.
Is Looker Studio really free?
Yes, Looker Studio is free for core reporting, including Google connectors, dashboards, and scheduled emails. The Pro plan adds team features and AI assistance at $9 per user per project per month, but most small teams can start free.
How much does Power BI cost?
Power BI Desktop is free for building reports, while Power BI Pro costs $14 per user per month and adds sharing and collaboration. Premium Per User costs $24 per user per month on annual billing, and larger capacity plans suit enterprise deployments.
How do I choose between Tableau and Power BI?
Choose Power BI if your team uses Microsoft 365 and wants lower per-user costs with strong data modeling. Choose Tableau if visual depth, exploration, and polished client-facing reports matter more than price, and you have analysts to build them.
Sources
- https://www.microsoft.com/en-us/power-bi
- https://www.tableau.com
- https://lookerstudio.google.com
- https://www.zoho.com/analytics
- https://www.metabase.com
- https://www.qlik.com/us/products/qlik-sense
- https://www.thoughtspot.com
- https://www.domo.com
- https://www.basedash.com/blog/bi-tool-pricing-plans-seat-limits-and-ai-costs-2026
- https://thimpress.com/best-business-analytics-tools/
See where you really rank - block by block
ProMapRanker scans Google Maps across a grid of your service area. Simple monthly plans from $19, white-label on every plan.
Start freeKeep reading
 best resource management software
Best Resource Management Software in 2026
We compared the best resource management software for scheduling, capacity and utilization, with current pricing and free trials, to help teams choose well.
Read → best remote support software
Best Remote Support Software in 2026
Looking for the best remote support software? We compare 9 tools on price, security, session controls, and fit for helpdesks, MSPs, and small teams in 2026.
Read → best real estate investing software
Best Real Estate Investing Software in 2026
We compared the best real estate investing software on minimums, fees, and liquidity, so investors can pick a platform that fits their budget and goals.
Read →