 ProMapRanker
Best Server Monitoring Software in 2026


Cloud-native teams that want one platform · Pricing starts at: $15 per host per month
Key takeaways
- Datadog and Dynatrace suit cloud-native and enterprise teams that want one observability platform, but usage-based pricing needs careful budgeting.
- Zabbix, Checkmk and Prometheus-style open-source tools suit teams with Linux skills and a near-zero licence budget, at the cost of setup time.
- Paessler PRTG and Nagios XI suit Windows-heavy and traditional IT teams that want sensor or plugin-based monitoring without building a platform.
- ManageEngine OpManager and New Relic cover the middle ground, with hybrid infrastructure monitoring and a free tier respectively.
Quick comparison
| Pick | Great for | Pricing starts at | Free tier | |
|---|---|---|---|---|
| Datadog | Cloud-native teams that want one platform | $15 per host per month | Free trial | Visit |
 Zabbix | Open-source monitoring at scale | Free | Yes | Visit |
 Paessler PRTG | Windows-heavy teams that want easy setup | Free | Yes | Visit |
 Nagios XI | Teams with existing Nagios plugins and habits | See website | Free trial | Visit |
 ManageEngine OpManager | Hybrid infrastructure in mid-sized IT teams | See website | Free trial | Visit |
 New Relic | Full-stack teams that want a free starting tier | Free | Yes | Visit |
 Dynatrace | Enterprises that want AI-led root-cause analysis | $29 per host per month | Free trial | Visit |
 Checkmk | Hybrid teams that want rule-based configuration | Free | Yes | Visit |
The best server monitoring software
We compared eight server monitoring tools on metrics, alerts, deployment, pricing and ease of setup. The best server monitoring software below covers software-as-a-service platforms, traditional on-premise tools and open-source options, so a small IT team and a large cloud operation can both find a fit.
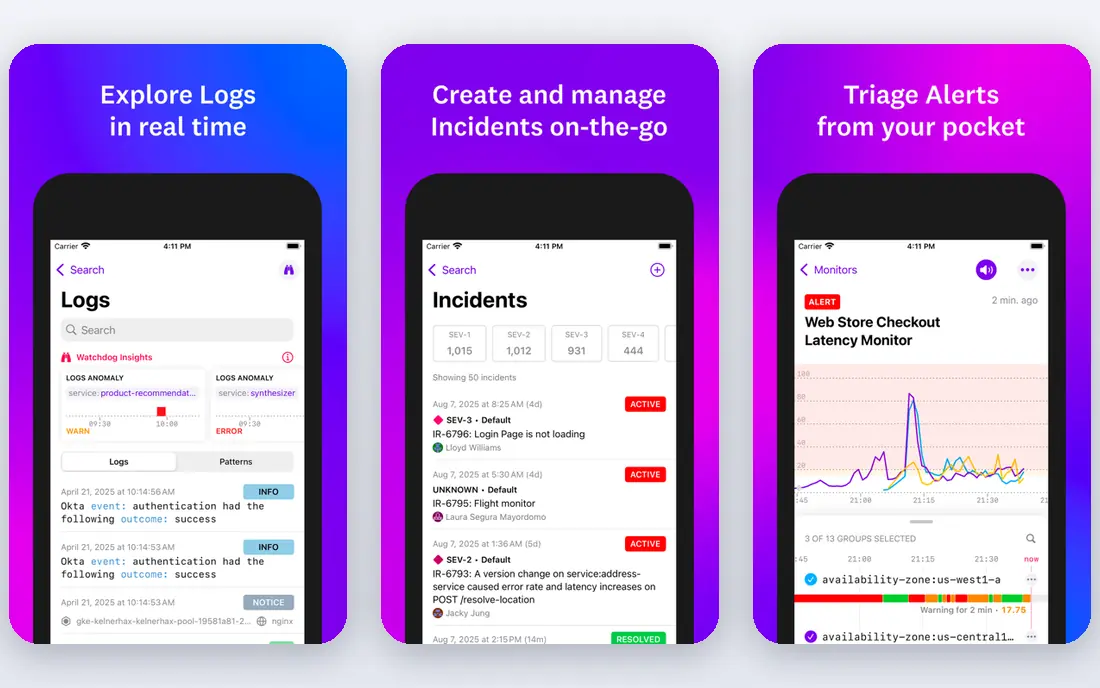
Datadog is the most complete software-as-a-service observability platform in this guide. Infrastructure monitoring starts at $15 per host per month on the Pro plan with annual billing, and the same platform can add log management, application performance monitoring, real user monitoring and security, all correlated around the same hosts and services. That breadth suits cloud-native teams running containers, serverless functions and many microservices.
The catch is cost control. Logs are charged by ingest volume, custom metrics add up, and application monitoring is a separate product, so a bill that starts at $15 per host can grow quickly if nobody owns usage. Teams that adopt Datadog should set ingest limits, review custom metrics monthly and assign a cost owner. For a cloud operation that needs one platform rather than five tools, Datadog is still the default choice.
- Infrastructure, logs, application performance and security in one platform
- Strong cloud and container coverage
- Large integration library
- Costs are hard to predict once logs, custom metrics and application monitoring are added
- Per-host pricing adds up at scale
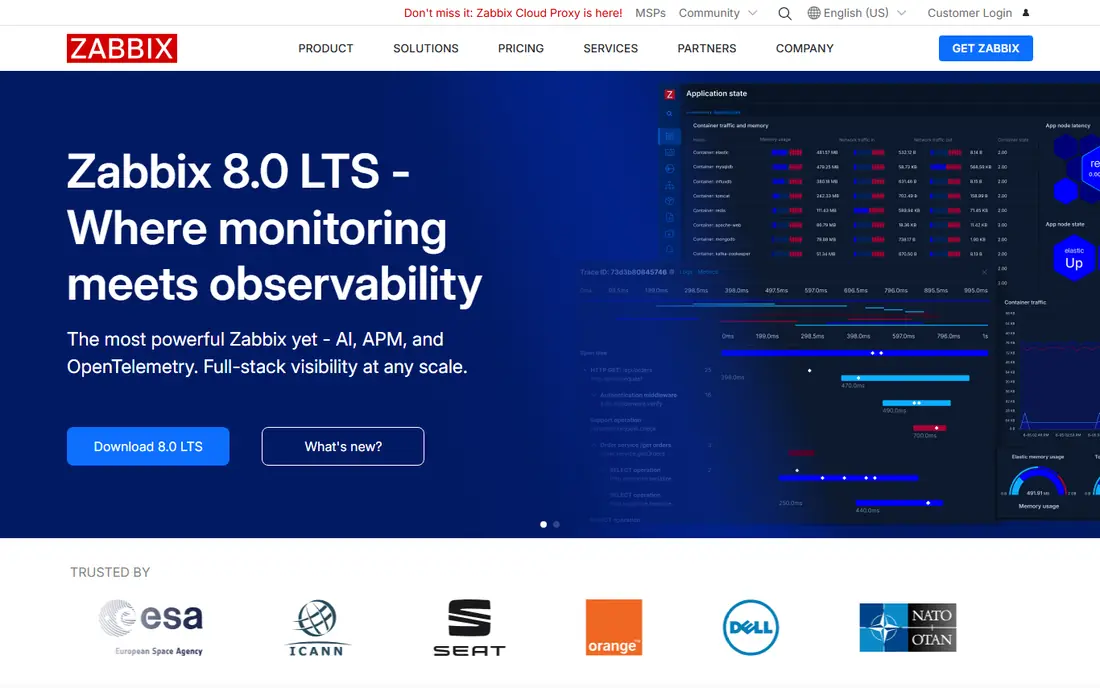
Zabbix is the first look when the licence budget is effectively zero. The software is open source, supports SNMP, agents, IPMI and HTTP checks, and can monitor networks, servers, virtual machines, applications and cloud services from one system. There is no per-host licence waiting to punish you for discovering another switch or server, which makes it popular with large traditional infrastructures.
That freedom costs staff time. Designing templates, tuning triggers, sizing the database and handling upgrades needs experienced people, and a two-person IT team already covering many systems may find it heavy. Paid support is available from the vendor, which softens the risk. If your team has Linux skills and values control over licence costs, Zabbix is a powerful, proven choice.
- Free open-source software with no licence meter
- SNMP, agents, IPMI and HTTP collection
- Scales to large networks and servers
- Needs real Linux and monitoring expertise
- Templates, triggers and upgrades take ongoing staff time
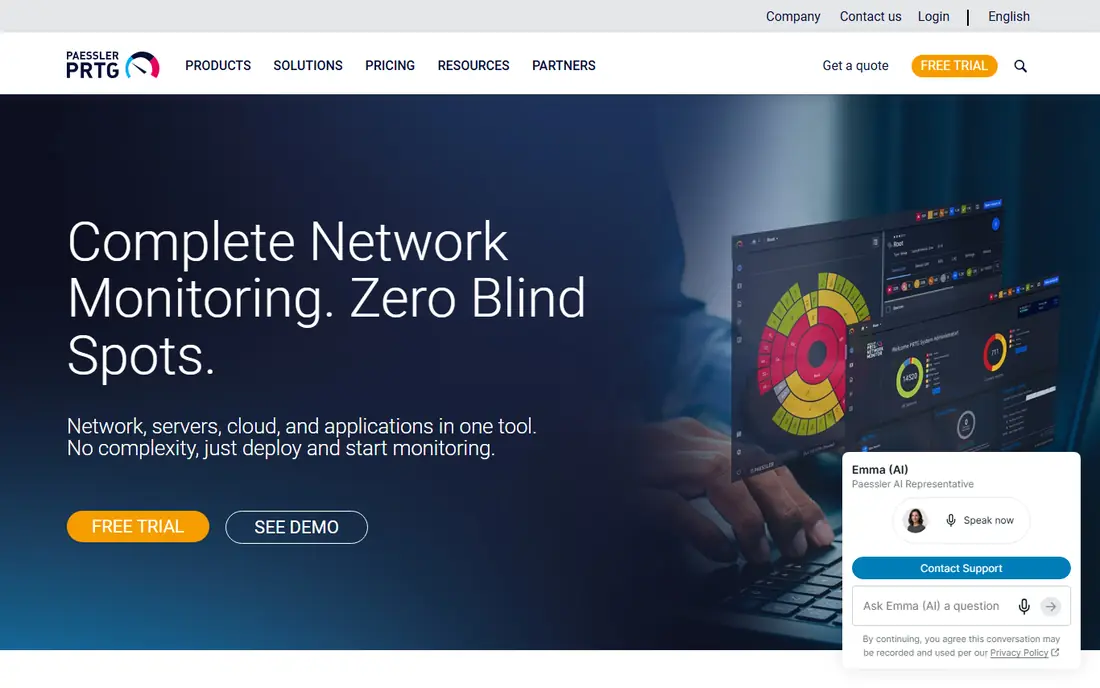
Paessler PRTG suits Windows-heavy IT departments and small to mid-sized teams that want monitoring running quickly. Auto-discovery finds devices and services, ready-made sensors cover CPU, memory, disk, network traffic and applications, and maps and dashboards present the estate clearly. The free tier covers 100 sensors, enough for a small network, while paid plans start with PRTG 500 at $200 per month billed annually for up to 500 sensors.
Sensor counting is the skill to learn. A sensor is one monitored item, such as CPU load or interface traffic, so a single 48-port switch can consume many sensors, and costs rise faster than device counts suggest. Count sensors during the trial, not after purchase, and keep an eye on which devices consume the most. For teams that want a friendly, fast setup without building a platform, PRTG is a strong pick.
- Free tier with 100 sensors
- Auto-discovery and ready-made sensors
- Maps and dashboards that are easy to read
- Sensor-based licensing costs rise fast on large networks
- Windows-focused setup suits some teams better than others
Nagios XI is the commercial edition of the long-running Nagios monitoring system, and its strength is the plugin ecosystem. Decades of community and vendor plugins cover servers, network devices, applications and custom scripts, so almost any check a team needs already exists in some form. Nagios Core, the open-source base, remains free, while XI adds a web interface, wizards, reports and enterprise features.
The trade-off is effort. Configuration is more hands-on than Datadog or PRTG, and reviewers note that XI licensing and annual increases can be costly. Teams that already run Nagios plugins, or whose staff know Nagios well, get the most value, since migration costs are low and habits carry over. New teams without Nagios history should trial PRTG or Zabbix first, unless a specific plugin makes Nagios essential.
- Huge plugin ecosystem built over decades
- Flexible checks for almost any service
- Nagios Core remains free and open source
- Setup and configuration are more hands-on than modern rivals
- XI licensing is perpetual plus maintenance and can be costly
ManageEngine OpManager suits mid-sized IT teams running a mix of Windows servers, network devices and virtual machines. It monitors availability and performance across servers, switches, routers and virtual hosts from one console, using SNMP, WMI and command-line collection, with flow analysis as an add-on for traffic detail. Workflows align with IT service practices, which helps teams that already use other ManageEngine tools.
Pricing is the uncertainty, since it is per device and quoted on many editions, so a direct quote based on your device count is essential for a fair comparison. Flow analysis and some advanced features sit on higher plans or add-ons. If your estate is mixed and you want one traditional console rather than a cloud observability bill, OpManager deserves a trial alongside PRTG and Zabbix.
- Monitors servers, networks and virtual machines in one console
- SNMP, WMI and flow support
- ITIL-aligned workflows
- Pricing is per device and quoted on many editions
- Flow and advanced features are add-ons on some plans
New Relic suits software teams that want full-stack observability without paying on day one. The free tier includes 100 GB of monthly data ingest and one full platform user, which covers a small application and its servers, while paid plans add users and ingest at $0.30 per GB beyond the allowance in published comparisons, plus per-user charges. Application performance, infrastructure, logs, browser and mobile monitoring sit in one platform with correlated data.
The pricing model needs care. Per-user plus per-GB charges interact in ways that are hard to predict from a headline price, so model a realistic month of data and users before committing. Teams that already use New Relic for application monitoring get the most value, since server monitoring then comes as an extension of a familiar platform. For a SaaS team starting small, the free tier is a genuine way to test full-stack monitoring.
- Free tier with 100 GB of data ingest and one full user
- Application, infrastructure, logs and browser monitoring in one platform
- Good for SaaS teams
- Pricing mixes per-user and per-GB charges, so costs need modelling
- Advanced features and extra users add cost quickly
Dynatrace targets enterprises with large, complex estates where finding the root cause matters more than collecting another chart. One agent collects infrastructure, application, log and user-experience data, and the Davis AI engine correlates problems and points to likely causes, which saves time during major incidents. Infrastructure monitoring starts around $29 per host per month, with full-stack monitoring priced per memory unit in published comparisons.
Pricing complexity is the main drawback, since host, memory and data ingest charges combine, and the platform is aimed at estates of 100 hosts or more. Small teams will pay for depth they rarely use, while large teams gain the most from automated root-cause analysis. If incident triage is your bottleneck and your estate is large, Dynatrace is worth a scoped trial with a clear cost model.
- Single agent covers full-stack monitoring
- AI engine highlights root causes
- Strong for large cloud and enterprise estates
- Usage-based pricing is complex
- Aimed at larger estates, so small teams pay for depth they may not use
Checkmk suits hybrid IT shops that manage many sites or a large number of services and want configuration by rules rather than per-host editing. The Raw edition is free and open source, while the Enterprise edition adds distributed monitoring, advanced reporting and support, priced per service rather than per host. Published comparisons describe over 2,000 plugins and a service-based price around $225 per month for a 100-host estate, though your service count decides the real figure.
Learning the rule system takes time, and the interface is more functional than polished. Teams that invest in that learning gain a system that scales cleanly: a rule change applies across sites without editing each host. For a mid-sized or large hybrid estate, Checkmk is a strong open-source-rooted alternative to Zabbix, with a clearer commercial path when support and enterprise features are needed.
- Raw edition is free and open source
- Rule-based configuration scales across many sites
- Over 2,000 plugins in published comparisons
- Enterprise edition is priced per service, so costs need modelling
- Interface and concepts take learning time
How we picked these
We compared official pricing pages, product documentation and published 2026 server and infrastructure monitoring comparisons, and we kept only tools that are live in October 2026 and monitor servers as a core job, not only uptime or websites. We covered software-as-a-service, on-premise and open-source deployment, and we wrote See website where pricing is quoted, per-device or per-service, instead of inventing a single figure. We did not claim hands-on testing of production estates, and our comparison rests on vendor documentation and published pricing.
How to choose server monitoring without alert fatigue
Start by listing what must wake someone up, and what can wait until morning. Disk full on a database server, a failed backup and a down production host deserve pages, while a brief CPU spike on a test server deserves a ticket or nothing at all. Tools that alert on everything produce alert fatigue, and fatigued teams miss real incidents, so tune thresholds during the trial, not after go-live.
Next, count the real billing units before you buy. Datadog and Dynatrace charge by host and usage, PRTG by sensor, Nagios XI by node, OpManager by device and Checkmk by service, so the same estate can cost very different amounts across vendors. Run a trial on a representative slice of servers, export the usage, and project it to the full estate. Finally, check the on-call path: alerts should reach the right person, link to a runbook, and create a ticket automatically, or the monitoring tool becomes another dashboard nobody watches at 2 a.m.
Frequently asked questions
What is the best server monitoring software?
Datadog suits cloud-native teams that want one observability platform, Zabbix suits open-source teams with Linux skills, and PRTG suits Windows-heavy teams that want fast setup. The best choice depends on estate size, deployment preference and if you want software-as-a-service, on-premise or open-source software.
What is the best free server monitoring software?
Zabbix and Checkmk Raw Edition are the strongest free options, with no licence cost and broad server and network coverage, though both need setup and maintenance time. Paessler PRTG offers a free tier with 100 sensors, and New Relic offers a free tier with 100 GB of ingest, which suit smaller estates.
How much does server monitoring software cost?
Published starting prices range from free for Zabbix and Checkmk Raw, through $15 per host per month for Datadog and $29 per host per month for Dynatrace, to sensor, device or service pricing for PRTG, OpManager and Checkmk Enterprise. Usage charges for logs, metrics and data ingest can raise software-as-a-service bills well above the host price.
What is the difference between server monitoring and network monitoring?
Server monitoring tracks host health such as CPU, memory, disk, services and applications, while network monitoring tracks switches, routers, interfaces and traffic flows. Many tools in this guide cover both, with Zabbix, PRTG, OpManager and Checkmk spanning servers and networks, while Datadog and New Relic lean toward servers, applications and cloud services.
Do I need server monitoring for a small business?
A small business with a few servers benefits from at least basic monitoring, such as uptime, disk, CPU and backup checks with alerts, since a failed server is often found by customers first without it. Start with a free tier such as PRTG, Zabbix or New Relic, and move to a paid plan only when the estate or alerting needs grow.
What are the best server monitoring tools for cloud servers?
Datadog, New Relic and Dynatrace are the strongest choices for cloud servers, with agents for cloud hosts, containers and serverless functions, plus application and log correlation. Zabbix and Checkmk can also monitor cloud servers through agents, but they need more setup and self-hosting effort than the software-as-a-service options.
Sources
- https://www.datadoghq.com
- https://www.zabbix.com
- https://www.paessler.com
- https://www.nagios.com
- https://www.manageengine.com/products/opmanager/
- https://newrelic.com
- https://www.dynatrace.com
- https://checkmk.com
- https://hyperping.com/blog/8-server-performance-monitoring-tools-to-consider-in-2026
- https://xitoring.com/blog/best-infrastructure-monitoring-tools
See where you really rank - block by block
ProMapRanker scans Google Maps across a grid of your service area. Simple monthly plans from $19, white-label on every plan.
Start freeKeep reading
 best virtual meeting platform
Best Virtual Meeting Platforms in 2026
Searching for the best virtual meeting platform? We compare 9 video meeting tools on price, free plans, capacity, and features for teams of all sizes.
Read → best social media reporting tools
Best Social Media Reporting Tools in 2026
Compare the best social media reporting tools in 2026, with pricing and free plans, and the right pick for creators, agencies, and large marketing teams.
Read → best social media platforms for business
Best Social Media Platforms for Business in 2026
We compared the best social media platforms for business, from Facebook and Instagram to LinkedIn and TikTok, with ad strengths and who each platform suits.
Read →