 ProMapRanker
Best Mobile App Analytics in 2026


Free analytics for Google-stack mobile teams · Pricing starts at: Free
Key takeaways
- Firebase Analytics is the best free foundation for most mobile teams, especially teams already using Google tools.
- Mixpanel and Amplitude lead for event-based product analytics, with Mixpanel offering the clearer usage price and Amplitude the larger free event allowance.
- PostHog suits teams that want analytics, session replay, feature flags and experiments in one open-source-based platform.
- AppsFlyer and Adjust answer attribution, which campaign drove the install, and often sit alongside a product analytics tool.
- UXCam and Smartlook add session replay and visual behaviour, which helps teams see why users drop off, not just where.
Quick comparison
| Pick | Great for | Pricing starts at | Free tier | |
|---|---|---|---|---|
| Firebase Analytics | Free analytics for Google-stack mobile teams | Free | Yes | Visit |
 Mixpanel | Event-based product analytics with clear pricing | Free | Yes | Visit |
 Amplitude | Behavioural analytics at scale | Free | Yes | Visit |
 PostHog | Analytics plus replay, flags and experiments | Free | Yes | Visit |
 AppsFlyer | Mobile marketing attribution at scale | See website | Yes | Visit |
 Adjust | Attribution with strong automation | See website | No | Visit |
 UXCam | Seeing exactly how users experience the app | See website | Yes | Visit |
 Smartlook | Visual behaviour analytics for web and mobile | See website | Yes | Visit |
The best mobile app analytics
Mobile app analytics has two different jobs, and confusing them leads to the wrong purchase. Product analytics shows what users do inside the app, such as retention, funnels and feature use. Attribution shows which campaign or channel drove the install. Many teams need one of each. We compared official pricing pages and feature lists for tools that serve mobile apps in October 2026.
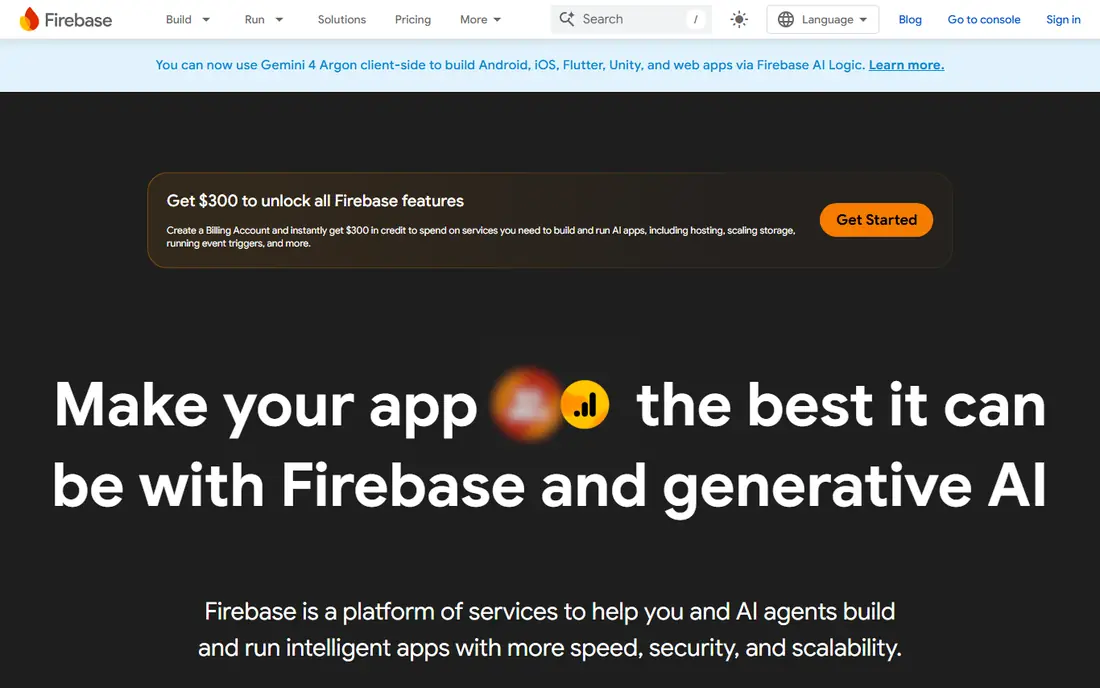
Firebase Analytics, part of Google Analytics for Firebase, is the default starting point for most mobile teams. It is free, reports unlimited events on published terms, and integrates with Android and iOS apps with a small SDK. For a new app, it answers the core questions fast: how many users, how often they return, which screens they visit, and where crashes happen through Crashlytics.
The limits appear as a product team grows. Cohort analysis, funnel customisation and behavioural segmentation are less flexible than in Mixpanel or Amplitude, and teams that need deep product analysis often add a second tool later. If you already use Google Cloud, Play or Ads, Firebase is the obvious foundation. If you need advanced product analytics from day one, start with Mixpanel or Amplitude instead.
- Free with unlimited event reporting on published terms
- Deep integration with Android, iOS and Google tools
- Crashlytics and Remote Config nearby
- Less flexible for complex behavioural cohorts than Mixpanel or Amplitude
- Reporting can feel basic for large product teams
- Google ecosystem lock-in
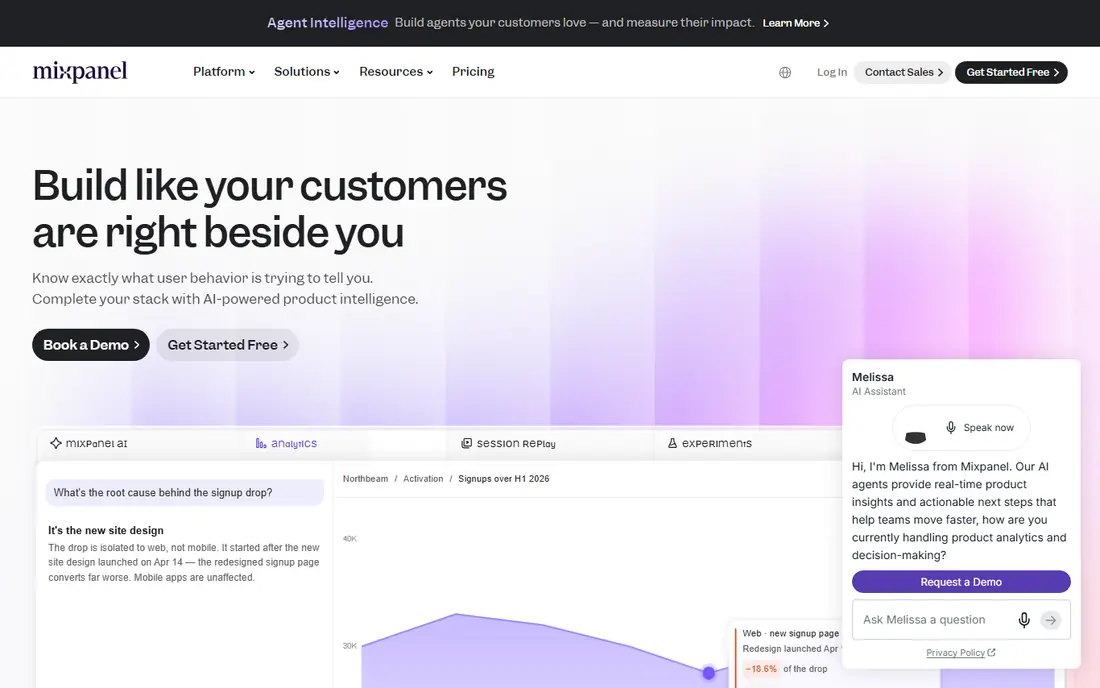
Mixpanel is built around events: what a user did, when, and in what order. The free plan covers 1 million events per month, which suits many early apps, and Growth pricing after that is published at around $0.28 per 1,000 events, making the bill easy to model. Funnels, retention curves and cohorts help product teams see which features keep users and which steps lose them.
The main cost warning is volume. Autocapture and untracked events can push an app past the free tier quickly, so teams should track only events they will actually chart. Session replay is included in a limited allowance, not as a full replacement for a replay tool. For teams that want clear, event-based product analytics without a sales call, Mixpanel is a strong pick.
- Free plan with 1 million events per month
- Clear usage pricing after that
- Strong funnels, retention and cohort tools
- Costs rise fast past the free tier at $0.28 per 1,000 events on published rates
- Session replay allowance is limited
- Needs careful event design
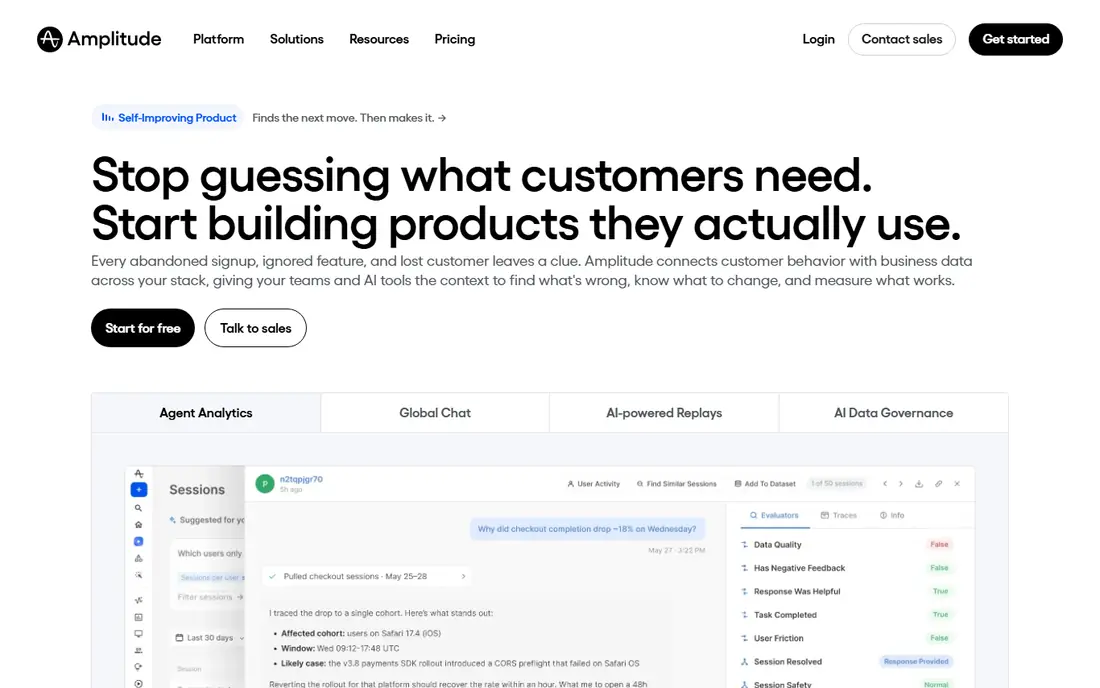
Amplitude gives the largest free event allowance in this list, at 2 million events per month on published terms, plus a limited session replay allowance. That makes it attractive for growing apps that want behavioural analysis, journey mapping and predictive cohorts without paying at first. Its governance and data tools also suit larger teams with a data warehouse and dedicated analysts.
Paid pricing is less transparent. Beyond the self-serve Plus tier, larger volumes are quoted, so budgeting at scale needs a sales conversation. The depth that makes Amplitude powerful can also slow a small team that just needs simple funnels and retention. For scale-ups with an analyst or a data team, Amplitude is the most capable behavioural tool here.
- Free tier with 2 million events per month on published terms
- Strong behavioural cohorts and predictive features
- Session replay included in a limited allowance
- Paid pricing past Plus is largely quoted rather than published
- Learning curve for teams without an analyst
- Depth can be overkill for small apps
PostHog bundles product analytics with session replay, feature flags, experiments, surveys and error tracking, so a team can replace several tools with one account. The free tier includes 1 million product analytics events per month, plus smaller allowances for replay and flags on published terms. Paid analytics pricing starts at a low per-event rate with volume discounts, which often makes it cheaper at high volume than Mixpanel.
The bundle is also the complication. Each product is metered separately, so a bill that includes analytics, replay and flags needs careful modelling. Self-hosting is possible for teams with privacy or compliance needs, though it adds maintenance work. For product-led teams that want one platform for analytics and experimentation, PostHog offers the broadest value in this list.
- Free tier with 1 million analytics events per month
- Analytics, replay, feature flags and surveys in one platform
- Open-source option for self-hosting
- Per-product usage billing takes effort to forecast
- Costs rise if you switch on many products
- Interface can feel busy
AppsFlyer answers the marketing question: which ad, partner or campaign drove the install and the later purchase? It attributes installs and in-app events across paid and organic channels, with fraud protection and deep linking to send users to the right screen. Large advertisers and agencies use it because it integrates with many ad networks and measurement partners.
AppsFlyer is not a product analytics tool. It will not tell you why users churn after week two or which onboarding step fails, so most teams pair it with Firebase, Mixpanel or Amplitude. Pricing is custom, which suits large budgets but frustrates small teams that want a published price. If paid acquisition is a major cost, attribution from AppsFlyer can pay for itself by cutting wasted spend.
- Strong mobile attribution across channels
- Fraud protection and deep linking
- Widely used by agencies and large advertisers
- Pricing is custom and quoted
- Not a replacement for product analytics
- Setup needs care for privacy rules
Adjust, now part of AppLovin on published terms, combines mobile attribution with automation that moves campaign data between ad partners and analytics tools. That automation saves marketing teams hours of manual reporting, and its fraud prevention helps protect ad budgets. Reporting is built for marketers who need channel, campaign and creative performance in one view.
Like AppsFlyer, Adjust does not replace product analytics. It tracks acquisition and early conversion well, but deeper retention and behaviour analysis belong in a product tool. Pricing is custom, and there is no free plan on the terms we found, so small apps should start with Firebase and add Adjust only when paid acquisition justifies it.
- Attribution plus automation for campaign data
- Fraud prevention
- Strong reporting for marketing teams
- No free plan on published terms
- Pricing is custom
- Product analytics depth is limited compared with Mixpanel or Amplitude
UXCam shows what numbers alone cannot: a recording of how a real user moved through your app, where they tapped, where they hesitated, and where they gave up. Heatmaps and gesture data help UX teams fix confusing screens, while crash reports tied to sessions show what happened just before a failure. That visual evidence often settles debates that funnel charts cannot.
UXCam works best alongside an event tool, not instead of one. You still need Mixpanel, Amplitude or Firebase for retention and funnel analysis at scale, and replay sampling must be set so storage and privacy stay manageable. Pricing is quoted, so get a clear plan based on monthly sessions before you commit. For teams fixing onboarding or checkout friction, UXCam is a focused and useful pick.
- Session replay, heatmaps and gesture tracking for mobile
- Crash and issue analysis tied to sessions
- Useful for UX teams
- Pricing is quoted rather than fully published
- Replay storage and sampling need management
- Not a full product analytics replacement
Smartlook combines session replay, heatmaps, funnels and events for both web and mobile apps, which suits teams with a website and an app to support together. The free plan lets you test replay quality and funnel setup before paying, and the visual tools help product and support teams see the exact step where users struggle.
Smartlook is not as deep for pure mobile event analytics as Mixpanel or Amplitude, and its paid pricing is quoted rather than fully published. Session limits on paid plans also need checking if your app has high traffic. For small and mid-size teams that want visual behaviour insight across web and mobile in one tool, Smartlook is a practical choice.
- Session replay and heatmaps for web and mobile
- Funnels and events alongside replay
- Free plan for testing
- Pricing past the free plan is quoted
- Mobile depth varies by platform
- Replay-heavy teams need to watch session limits
How we picked these
We compared official pricing pages, feature lists and documentation for mobile analytics tools that work in October 2026. We favoured tools with a free tier or clear published pricing, mobile SDKs for iOS and Android, and a distinct job: product analytics, attribution or visual behaviour. We left out web-only analytics tools, tools that have stopped mobile support, and tools whose pricing and mobile features could not be verified.
What to check before you choose
Define the question first. If you need retention and funnel answers, pick a product analytics tool. If you need to know which campaign drove installs, pick an attribution tool. Many teams need both, and trying to force one tool to do both jobs usually gives weak answers in one area.
Events, privacy and sampling
Plan your events before you install an SDK. Track sign-up, key actions, purchases and churn signals, and skip events nobody will chart, since event volume drives cost. Check privacy rules for your markets, including consent, data retention and user deletion, and test that the SDK does not slow the app or drain battery on older phones.
Cost at your real volume
Model cost at your current monthly events and sessions, then at three times that volume. Free tiers look generous until autocapture doubles event counts. PostHog and Mixpanel publish per-event rates that help forecasting, while Amplitude, AppsFlyer, Adjust, UXCam and Smartlook need quotes at scale, so get those quotes early.
Frequently asked questions
What is the best mobile app analytics tool?
Firebase Analytics is the best free starting point for most apps, while Mixpanel and Amplitude lead for deeper product analytics. PostHog suits teams that want analytics plus replay and experiments in one place. The best tool depends on whether you need product insight, attribution or visual behaviour data.
What is the best free mobile analytics tool?
Firebase Analytics is free with unlimited event reporting on published terms, making it the strongest free foundation. Mixpanel offers 1 million free events per month, Amplitude offers 2 million, and PostHog offers 1 million analytics events per month. Each free tier suits a different team size and analysis need.
What is the difference between product analytics and attribution?
Product analytics shows what users do inside the app, such as retention, funnels and feature use. Attribution shows which campaign or channel drove the install or purchase. Tools such as Mixpanel and Amplitude handle product analytics, while AppsFlyer and Adjust handle attribution. Most growing apps use one of each.
Do mobile analytics tools work for iOS and Android?
Yes, the tools in this list offer SDKs for both iOS and Android, plus web support in several cases. Check the exact SDK, privacy handling and App Tracking Transparency support for iOS before you ship, since Apple and Google rules affect what attribution and tracking data you can collect.
How much does mobile app analytics cost?
Many tools start free, with paid costs driven by monthly events, sessions or quoted contracts. Mixpanel charges around $0.28 per 1,000 events past its free tier on published rates, while PostHog uses lower per-event rates with volume discounts. Attribution and replay tools are often quoted, so model cost at your real volume before you sign.
Is mobile analytics private and compliant?
It can be, if you set it up carefully. Use consent where required, limit personal data in events, set retention limits, and honour deletion requests. Check each vendor privacy policy and data processing terms for your markets, and avoid sending sensitive health, financial or location data in analytics events unless you have a clear legal basis.
Sources
See where you really rank - block by block
ProMapRanker scans Google Maps across a grid of your service area. Simple monthly plans from $19, white-label on every plan.
Start freeKeep reading
 best virtual meeting platform
Best Virtual Meeting Platforms in 2026
Searching for the best virtual meeting platform? We compare 9 video meeting tools on price, free plans, capacity, and features for teams of all sizes.
Read → best social media reporting tools
Best Social Media Reporting Tools in 2026
Compare the best social media reporting tools in 2026, with pricing and free plans, and the right pick for creators, agencies, and large marketing teams.
Read → best social media platforms for business
Best Social Media Platforms for Business in 2026
We compared the best social media platforms for business, from Facebook and Instagram to LinkedIn and TikTok, with ad strengths and who each platform suits.
Read →