 ProMapRanker
Best Frontend Cloud Logging Tools in 2026


Errors, traces, and replays in one place · Pricing starts at: $26 per month
Key takeaways
- Sentry is the best starting point for most frontend teams, since it links errors, traces, replays, and logs in one place.
- LogRocket suits teams that need to see exactly what a user did before a bug, thanks to its session replay focus.
- Datadog and New Relic suit teams that also need infrastructure and backend observability, not just browser logs.
- Check data volume pricing carefully, because browser logs and replays can grow fast on high-traffic sites.
Quick comparison
| Pick | Great for | Pricing starts at | Free tier | |
|---|---|---|---|---|
| Sentry | Errors, traces, and replays in one place | $26 per month | Yes | Visit |
 LogRocket | Session replay for frontend bugs | $99 per month | Yes | Visit |
 Datadog | Full-stack observability | $15 per host per month | Yes | Visit |
 New Relic | Full-stack monitoring on a free tier | See website | Yes | Visit |
 Bugsnag | Error monitoring with stability scores | See website | Free trial | Visit |
 Rollbar | Fast error triage for small teams | See website | Yes | Visit |
 Better Stack | Logs, uptime, and incidents in one place | See website | Yes | Visit |
 Axiom | Log search and analytics | See website | Yes | Visit |
 Honeybadger | Simple error and uptime monitoring | See website | Free trial | Visit |
The best frontend cloud logging tools
We compared official pricing pages, feature pages, and documentation for tools that collect browser errors, console logs, performance data, or session replays in the cloud.
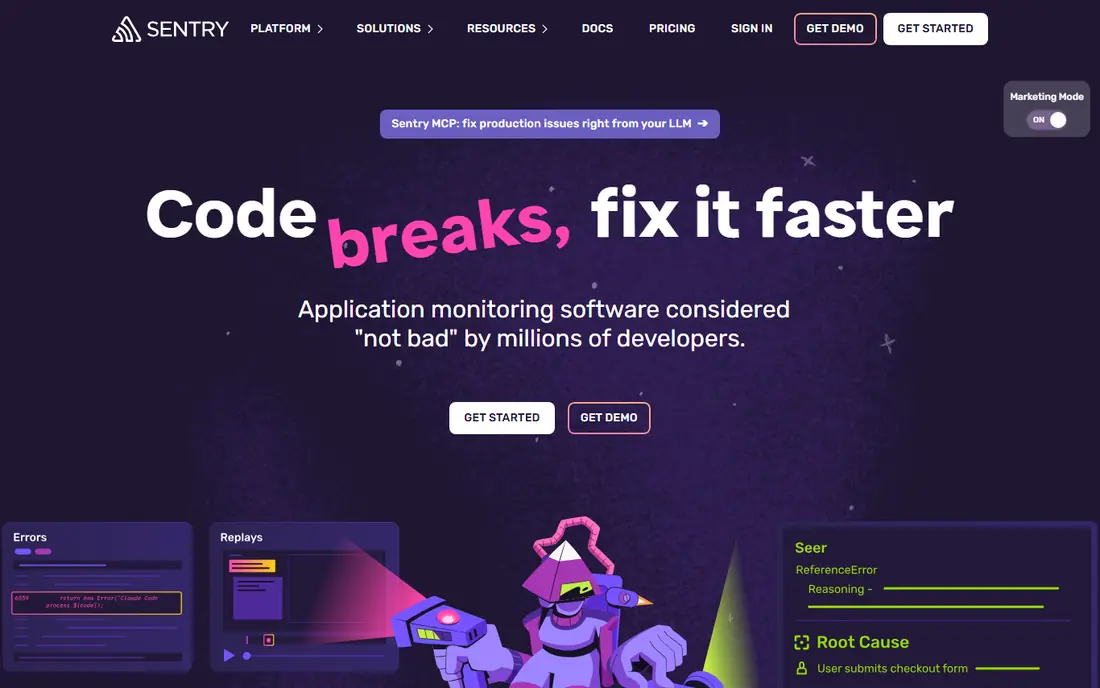
Sentry is our pick for most frontend teams. When a user hits an error, Sentry shows the stack trace, the browser and device context, the release that shipped the code, and a replay of what happened before the error. That combination shortens the usual back-and-forth between a bug report and a fix.
The free developer plan suits solo developers and small projects, while the Team plan adds more events and users. Watch volume on busy sites, since errors, replays, and logs are metered separately. Set up sampling and alert rules early so noisy errors do not eat your quota.
- Links errors to replays, traces, and releases
- Wide SDK support for web frameworks
- Free developer plan for small projects
- Costs rise with event and replay volume
- Full platform takes time to configure
- Some features need higher plans
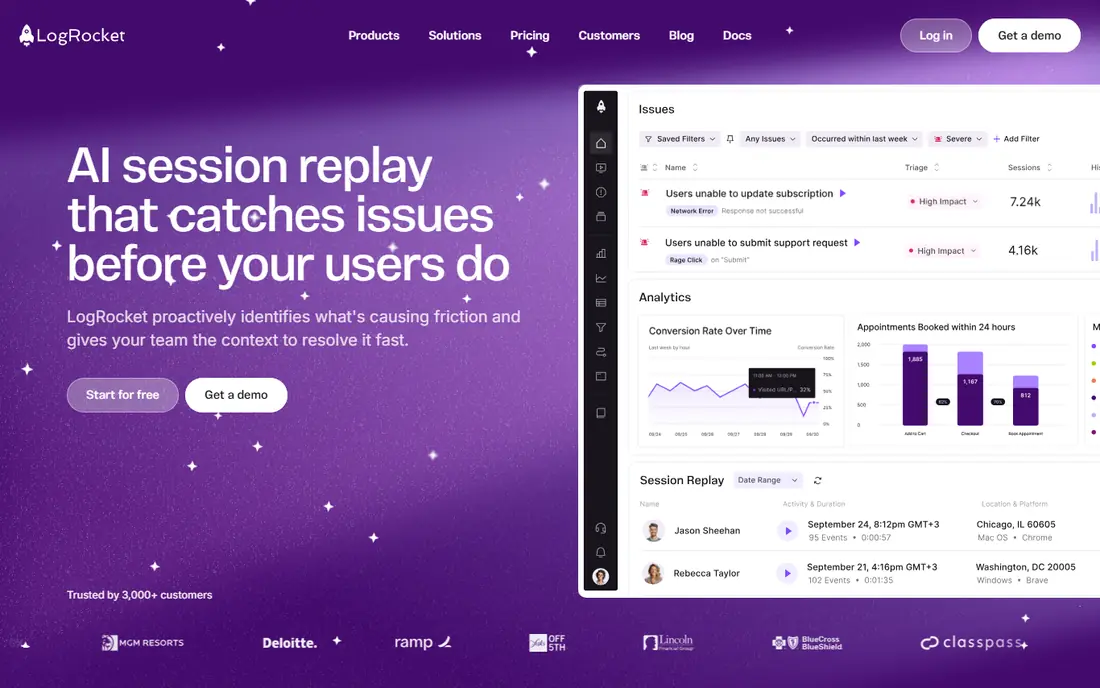
LogRocket is built around one question: what did the user actually do before something broke. Its replay shows clicks, scrolling, console output, and network requests in sequence, so a developer can reproduce a bug without asking the user for screenshots. That is especially useful for hard-to-reproduce interface bugs.
The free plan covers a limited number of sessions each month, which is enough to test the workflow. Paid plans start higher than Sentry, so LogRocket makes most sense for product teams where replay saves real support and debugging time every week.
- Detailed session replay with console logs and network data
- Performance metrics tied to sessions
- Strong Redux and GraphQL support
- Paid entry price is high for small teams
- Costs climb with session volume
- Mobile coverage is less deep than web
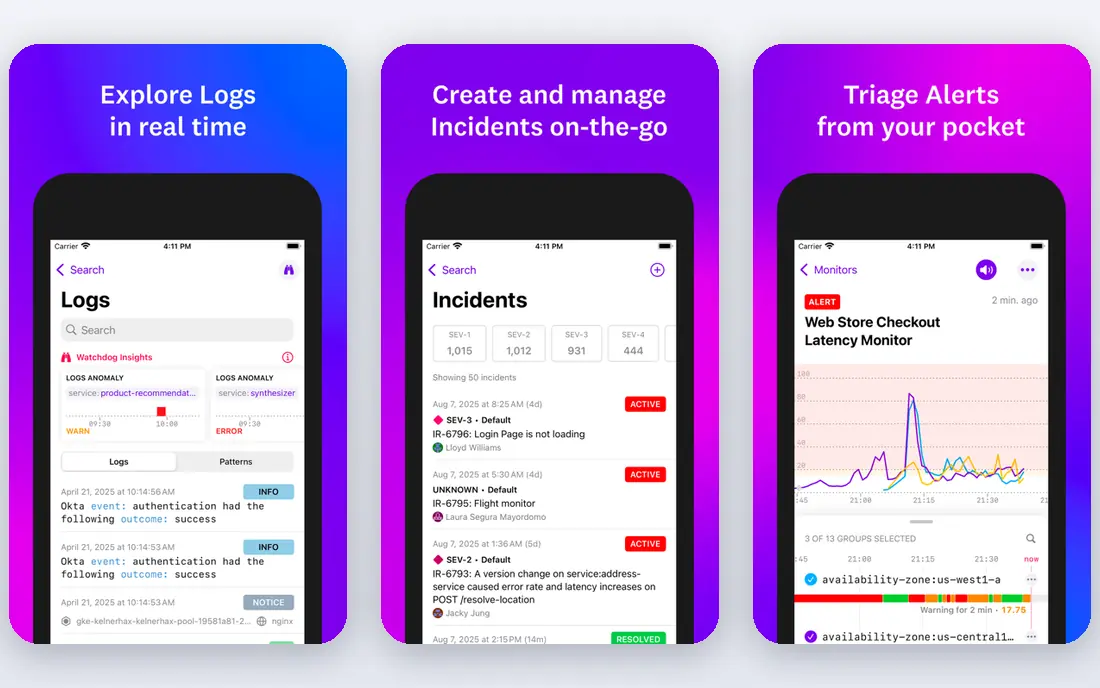
Datadog suits teams that already monitor servers, containers, and backend services and want browser data in the same place. Its Real User Monitoring covers browser errors, performance, and session replay, while logs and traces connect frontend issues to backend causes. That breadth is hard to match with a frontend-only tool.
The catch is cost and complexity. Each product is priced separately, so a full setup needs careful budgeting by host, log volume, and session count. If you only need frontend logs, a focused tool will be cheaper and simpler.
- Browser monitoring, logs, traces, and infrastructure in one platform
- Strong dashboards and alerting
- Wide integration library
- Pricing is modular and can add up
- Free tier retention is short
- Smaller teams may find it heavy
New Relic is worth a close look for teams that want full-stack visibility without paying per host. Its free tier includes a monthly data allowance and access to many capabilities, including browser monitoring, application performance monitoring, and logs. That makes it a low-risk way to test a full observability platform.
Paid costs depend mainly on data volume and full-platform user seats, so plan who really needs full access and who can use a basic seat. For a frontend-only job, the platform may feel larger than needed, but for a growing team it scales in one place.
- Generous free data allowance
- Browser monitoring plus APM and logs
- No per-host charge in its data-based model
- Full-platform user seats can be costly
- Pricing model takes time to understand
- Setup is broad rather than frontend-only
Bugsnag focuses on application stability. It groups similar errors, tracks how each release affects stability, and helps teams decide which errors to fix first. For product teams that report on release quality, that stability view is a practical advantage over a raw error list.
Bugsnag is less of a general log store than Datadog or Axiom. If your main need is searching large volumes of browser logs, pair it with a log tool or pick a broader platform. If error triage and release health are the priority, it is a strong specialist.
- Clear stability scoring for releases
- Error grouping and diagnostics
- Support for web and mobile apps
- Pricing is not as transparent as some rivals
- Logging is secondary to error tracking
- Smaller free starting point
Rollbar is a straightforward choice for a small team that wants error alerts without a large platform. You add the SDK, errors arrive grouped with stack traces and context, and you can assign and track fixes. The free plan is enough for a side project or a low-traffic site.
Larger teams may outgrow it when they need deep session replay, extensive log search, or infrastructure monitoring. As a first error tool, though, its speed of setup and clear triage workflow are genuine strengths.
- Fast setup for web apps
- Grouped errors with context
- Free plan for small projects
- Replay and log depth are thinner than Sentry or LogRocket
- Higher plans needed for larger teams
- Fewer full-stack features
Better Stack suits teams that want logs, uptime checks, and incident handling without stitching several tools together. Its log management uses SQL-style search, which feels natural to developers, and its uptime monitoring covers public pages and APIs. For a small SaaS team, that combination covers a lot of ground.
It is not a session replay specialist, so teams that need to watch user sessions should pair it with LogRocket or Sentry. As a log and incident hub, though, it is simple to set up and easy to reason about.
- SQL-based log search
- Uptime monitoring and incident pages included
- Clear pricing by log volume
- Frontend replay is not the focus
- Newer platform than Datadog or New Relic
- Advanced observability features are narrower
Axiom is a log data platform that works well for frontend event data, console logs, and custom analytics events. You can query logs quickly, build dashboards, and set alerts without running your own log servers. Developers who like querying data directly will feel at home here.
It is not a drop-in replacement for an error tracker. Use Axiom when log search and analysis are the main job, and add Sentry or Bugsnag when you need grouped errors, release tracking, and replay tied to each crash.
- Fast log search and dashboards
- Usage-based pricing
- Good fit for event-heavy frontend apps
- Error triage workflow is thinner than Sentry
- Replay is not the core feature
- Costs depend on ingest volume
Honeybadger is the calm option in this list. It tracks errors, checks uptime, and monitors scheduled jobs, with a clean interface that does not demand a lot of configuration. Small teams and agencies that manage several client sites often prefer that simplicity over a full observability suite.
The trade-off is depth. You will not get the replay detail of LogRocket or the log analytics of Axiom. For teams that want reliable error alerts and uptime checks without platform overhead, Honeybadger is a solid and honest choice.
- Simple setup and clear error pages
- Uptime and cron monitoring included
- Friendly for small teams and agencies
- No deep session replay
- Smaller integration range than large platforms
- Log search is not the main focus
How we picked these
We compared official pricing pages, product documentation, and feature pages for tools that collect frontend errors, logs, or replays in the cloud in October 2026. We favoured tools with a browser SDK, a cloud dashboard, and a free plan or trial, and we included both frontend specialists and full-stack platforms so readers can match scope to budget. Where a vendor prices by host, event, or data volume, we note that in the product write-up rather than forcing a single comparable number.
How to choose for your frontend stack
Start by naming the job. If you need to fix crashes fast, pick an error tracker with good grouping and context, such as Sentry or Rollbar. If you need to understand user behaviour before a bug, add replay with LogRocket. If you need to search logs at scale, pick Axiom or Better Stack.
Next, check privacy and sampling. Browser logs and replays can capture form input, so confirm masking options for text and media, and set sampling rates that match your traffic. A tool that records everything on a high-traffic site can become costly and risky without those controls.
Finally, test on a staging site first. Send a test error, check that the stack trace, release, and replay line up, and confirm alerts reach the right channel. That short test reveals more than a feature list, and it shows whether the tool fits your framework and deployment flow.
Frequently asked questions
What is the best frontend cloud logging tool for a small team?
Sentry is the safest default, since its free plan covers small projects and its paid Team plan links errors, traces, and replays. Rollbar and Honeybadger are simpler and cheaper-feeling options when error alerts are the only need.
What are the best frontend cloud logging tools for session replay?
LogRocket leads for replay depth, with console logs and network data tied to each session. Sentry also offers replay linked to errors, which suits teams that want replay only when something breaks.
Do frontend logging tools slow down a website?
A well-configured SDK adds a small overhead, but poor sampling can hurt performance on busy pages. Use sampling, limit tracked data, and test page speed with the SDK enabled before a full rollout.
How much do frontend logging tools cost?
Prices vary by model: Sentry starts at $26 per month, LogRocket at $99 per month, and Datadog infrastructure monitoring at $15 per host per month, with logs and other products priced separately. Always estimate your monthly events, sessions, and log volume before comparing headline prices.
Can I use a frontend logging tool without a backend?
Yes, for browser errors, console logs, and replays. You only need backend integration when you want to connect a frontend error to a server trace or log, which full-stack tools like Datadog and New Relic handle well.
Sources
See where you really rank - block by block
ProMapRanker scans Google Maps across a grid of your service area. Simple monthly plans from $19, white-label on every plan.
Start freeKeep reading
 wpforms alternatives
Best WPForms Alternatives in 2026
We compare 9 wpforms alternatives for WordPress forms, with free and paid options, current pricing notes, and honest limits for small business sites in 2026.
Read → windows task scheduler alternatives
Best Windows Task Scheduler Alternatives in 2026
Looking for Windows Task Scheduler alternatives? We compare 9 schedulers for Windows and cross-platform work, from free tools to enterprise automation.
Read → which ai video service is best
Which AI Video Service Is Best in 2026
which ai video service is best? We compare 10 legitimate AI video services on price, avatars, editing and output quality to help you pick the right tool.
Read →