 ProMapRanker
Best Dashboard Software in 2026
Key takeaways
- Looker Studio is the best free starting point for teams already using Google Sheets, Analytics, and Ads.
- Power BI suits Microsoft 365 teams, while Tableau suits analysts who need deep visual exploration.
- Databox, Klipfolio, and Geckoboard are faster for simple KPI scorecards than full business intelligence platforms.
- Domo and Sisense are enterprise options, so small teams should confirm the total cost before a trial ends.
Quick comparison
| Pick | Great for | Pricing starts at | Free tier | |
|---|---|---|---|---|
 Looker Studio | Free Google dashboards | Free | Yes | Visit |
 Microsoft Power BI | Microsoft 365 teams | $14 per user per month | Yes | Visit |
 Tableau | Deep visual analytics | $15 per user per month | Yes | Visit |
 Databox | Simple KPI scorecards | See website | Yes | Visit |
 Klipfolio | Custom client dashboards | $120 per month | Free trial | Visit |
 Geckoboard | Live TV KPI boards | $79 per month | Free trial | Visit |
 Domo | Unified data and dashboards | See website | Free trial | Visit |
 Sisense | Embedded analytics | See website | Free trial | Visit |
The best dashboard software
A good dashboard answers one question at a glance: are we on track, and where is the problem. The tools below differ in price, setup effort, and who should build the dashboards, so match the tool to your team, not just to the chart styles.

Looker Studio is the natural first dashboard for a small business already living in Google tools. You connect Sheets, Analytics, or Ads, drag charts onto a page, and share a live link with your team or a client. There is no per-viewer fee for the core product, which keeps it cheap as a team grows.
The limits show up outside the Google world. Some third-party connectors cost extra, and very large data sets can feel slow. For a small business tracking sales, marketing, and web traffic from Google sources, Looker Studio is hard to beat on value.
- Free core product
- Strong Google Sheets, Analytics, and Ads connectors
- Easy sharing by link
- Paid connectors needed for some sources
- Performance can slow on large data sets
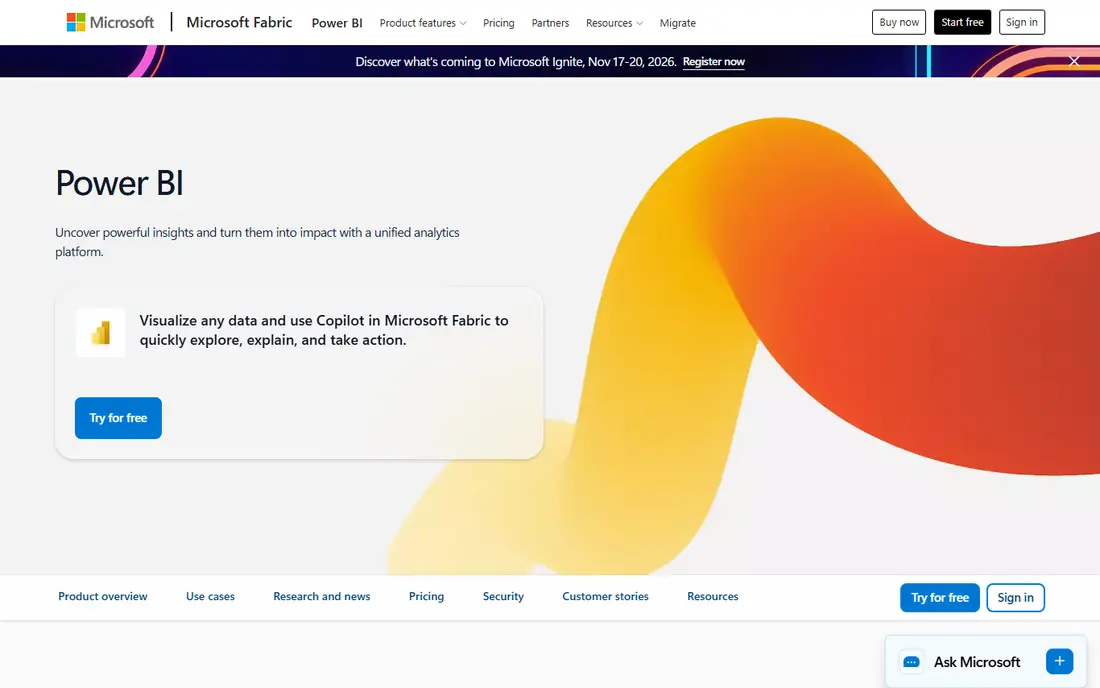
Power BI is the obvious pick if your team already uses Excel, Teams, and SharePoint. It handles data modeling well, so you can clean and combine tables before you build charts, and reports publish neatly inside Microsoft 365. The free desktop app lets one person build reports before paying for sharing.
The pricing catch is sharing. Viewers of shared content generally need a license too, so a small team can see costs rise faster than the headline per-user price suggests. If your whole team is on Microsoft 365, that cost is usually worth it. If not, a free tool may serve you better.
- Deep Excel and Microsoft 365 integration
- Strong data modeling
- Large template and community base
- Sharing requires paid licenses for viewers
- Learning curve for data modeling
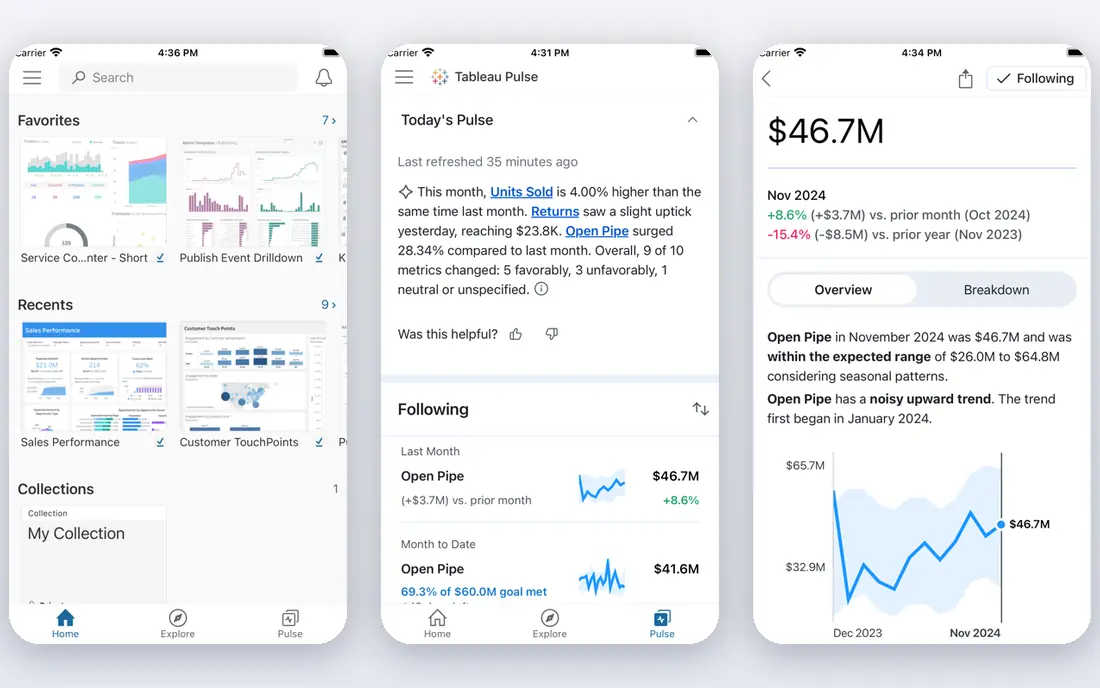
Tableau suits analysts and data-minded teams who want to explore data, not just display fixed KPIs. You can drag fields, filter on the fly, and test a hunch in minutes, which makes it strong for questions that change week to week. The free desktop edition covers local work for individuals.
For a simple KPI wall, Tableau can be more tool than you need. Setup and training take time, and the per-user cost adds up for large viewer groups. Choose Tableau when exploration and analysis matter as much as the dashboard itself.
- Excellent visual exploration
- Handles large and messy data well
- Strong community resources
- Higher learning curve
- Cost rises with team size and advanced features
Databox is built for teams that want a readable scorecard, not a data project. Prebuilt metrics for tools such as HubSpot, Shopify, and Google Analytics let you add a dashboard in an afternoon, and goals and alerts flag when a number slips. The mobile app makes it easy to check numbers without opening a laptop.
Complex analysis is not its strength. If you need custom calculations across many tables, Power BI or Tableau will fit better. Databox wins on speed: it is the tool to pick when you want the whole company reading the same five numbers by next week.
- Many prebuilt KPI integrations
- Goals and alerts built in
- Mobile app for checking numbers
- Less flexible for complex data modeling
- Paid plans rise with data sources and users
Klipfolio suits agencies and teams that need precise, custom dashboards for clients. Its formula controls let you define a metric exactly once and reuse it, which helps when different clients need the same KPI shown in different ways. White-label options also help agencies present dashboards under their own brand.
The trade-off is build time. Each widget is assembled by hand, so a large dashboard set takes real effort. Klipfolio is best when custom metrics and client presentation matter more than a quick prebuilt scorecard.
- Formula-level control over metrics
- Good for agency client dashboards
- Many integrations
- Building each widget by hand takes time
- Pricing is flat per account, not per viewer
Geckoboard is designed for a screen on the wall. Sales, support, and operations teams can see live KPIs without opening a report, and snapshots can be sent by email or chat for people working elsewhere. Setup from common SaaS apps is quick, and the display stays readable from a distance.
It is not an analysis tool. If your team needs to drill into why a number moved, you will need another tool beside it. Geckoboard is the pick when visibility is the goal: one board, updated live, that everyone in the room can read.
- TV-ready live displays
- Simple setup from common SaaS tools
- Snapshots by email and chat
- Less suited to deep analysis
- Per-dashboard limits on lower plans
Domo brings data connections, dashboards, and workflow apps together, which helps companies that have outgrown a patchwork of reports. Teams can combine sources, build dashboards, and set alerts in one place, rather than stitching tools together. That breadth suits growing businesses with many data sources.
Small teams should be cautious. Pricing is quote-based, and the platform is built for scale, so a five-person team may pay for power it does not use. Get a written quote for your user count and data volume before you commit to a trial.
- Data, dashboards, and apps on one platform
- Many connectors
- Strong for growing companies
- Quote-based pricing
- Can be costly and complex for small teams
Sisense is a strong pick when dashboards need to live inside your own product, not just on an internal screen. Product teams can embed charts and reports for customers, with controls over access and branding. It also handles large, varied data sets well, which suits companies with complex data.
The cost and setup reflect that power. Pricing is quote-based, and implementation often needs technical time. Sisense fits product and data teams with a clear embedded use case, rather than a small business that only needs a weekly KPI page.
- Strong embedded analytics for products
- Handles large data sets
- Flexible deployment options
- Quote-based pricing
- Implementation can need technical help
How we picked these
We compared official pricing pages, feature pages, and integration lists for dashboard tools that are live in October 2026. We kept tools that build shareable dashboards from real business data, and we mixed free tools, small-business tools, and enterprise platforms so readers can see the full range. Where pricing was quote-based or conflicting across sources, we wrote See website rather than guessing a number.
How to choose a dashboard tool for a small business
Start with where your data already lives. If it is in Google Sheets and Analytics, Looker Studio will be fastest. If it is in Excel and Microsoft 365, Power BI will feel natural. If it is spread across HubSpot, Shopify, and ad platforms, Databox or Klipfolio will connect faster than a full business intelligence platform.
Next, decide who builds and who views. A tool that only an analyst can build will stall if no analyst is on staff, while a simple scorecard tool can be owned by a manager. Count viewers, not just builders, since per-viewer licensing changes the real cost. Finally, test with one real dashboard, not a demo data set, and check refresh speed, mobile view, and sharing before you pay for a year.
Frequently asked questions
What is the best dashboard software for small business?
Looker Studio is best if you want a free start with Google data. Databox is best for simple KPI scorecards from SaaS apps. Power BI is best for Microsoft 365 teams that need stronger data modeling.
What is the best custom client dashboard software?
Klipfolio is a strong pick for agencies, thanks to formula-level metric control and client dashboard options. Looker Studio is a cheaper option for simple client reports, while Databox suits agencies that need goals and alerts per client.
Which software is best for dashboards if I have no analyst?
Looker Studio and Databox are the easiest starts, since both offer prebuilt metrics and drag-and-drop building. Geckoboard is also simple if you mainly need a live KPI display rather than analysis.
Is Looker Studio really free?
The core Looker Studio product is free, and sharing by link costs nothing for viewers. Some third-party connectors charge extra, and a paid Pro tier exists for team and enterprise features, so check connector costs for your sources.
Do I need Tableau or Power BI for a small team?
Only if you need deep analysis or complex data modeling. For weekly KPIs, a simpler tool will be faster and cheaper. Move to Tableau or Power BI when your questions outgrow fixed scorecards.
How much should a small business pay for dashboard software?
Many small teams start at zero with Looker Studio, then pay in the range of a basic SaaS subscription for Databox, Klipfolio, or Geckoboard once they need more sources or client dashboards. Get a quote for viewers as well as builders before you judge the total cost.
Sources
See where you really rank - block by block
ProMapRanker scans Google Maps across a grid of your service area. Simple monthly plans from $19, white-label on every plan.
Start freeKeep reading
 best rank tracking software
Best Rank Tracking Software in 2026
Searching for the best rank tracking software? We compare 8 tools for daily keyword tracking, local rankings, client reports, and competitor checks in 2026.
Read → best platform for ecommerce website
Best Platform for Ecommerce Website in 2026
Find the best platform for ecommerce website builds in 2026. We compare Shopify, WooCommerce, BigCommerce, Wix and more on price, fees and scale for stores.
Read → best math apps
Best Math Apps in 2026: 8 Apps Compared
Find the best math apps for homework, revision, and deeper study in our 2026 comparison of 8 free and paid solvers, courses, and visual tools for students.
Read →