 ProMapRanker
Best Cloud Analytics Platforms in 2026

Key takeaways
- Snowflake and BigQuery are the safest warehouse defaults, while Databricks suits teams that also run machine learning on the same data.
- Microsoft Fabric is the best fit for Power BI teams, because warehouse, engineering, and reporting share one platform and storage layer.
- Tableau and Looker solve different BI problems, with Tableau favoring visual exploration and Looker favoring governed, modeled metrics.
- Consumption and capacity pricing both punish unmonitored use, so set auto-suspend, partitions, and access controls from day one.
- ThoughtSpot is worth a trial for business users who want to ask questions in plain language, rather than waiting for a dashboard build.
Quick comparison
| Pick | Great for | Pricing starts at | Free tier | |
|---|---|---|---|---|
 Snowflake | Managed cloud analytics | See website | Free trial | Visit |
 Databricks | Lakehouse and AI analytics | See website | Free trial | Visit |
 Google BigQuery | Serverless analytics | See website | Yes | Visit |
 Amazon Redshift | AWS-native analytics | See website | Free trial | Visit |
 Microsoft Fabric | Power BI-centered analytics | See website | Free trial | Visit |
 Tableau | Visual exploration and BI | See website | Free trial | Visit |
 Looker | Governed semantic analytics | See website | Free trial | Visit |
 ThoughtSpot | Conversational self-service analytics | See website | Free trial | Visit |
The best cloud analytics platforms
We compared cloud platforms that store, model, and report on analytic data, including warehouses, lakehouses, and BI layers. A complete stack often pairs a warehouse with a BI tool, so we note where a product is a full platform and where it is mainly a reporting layer.
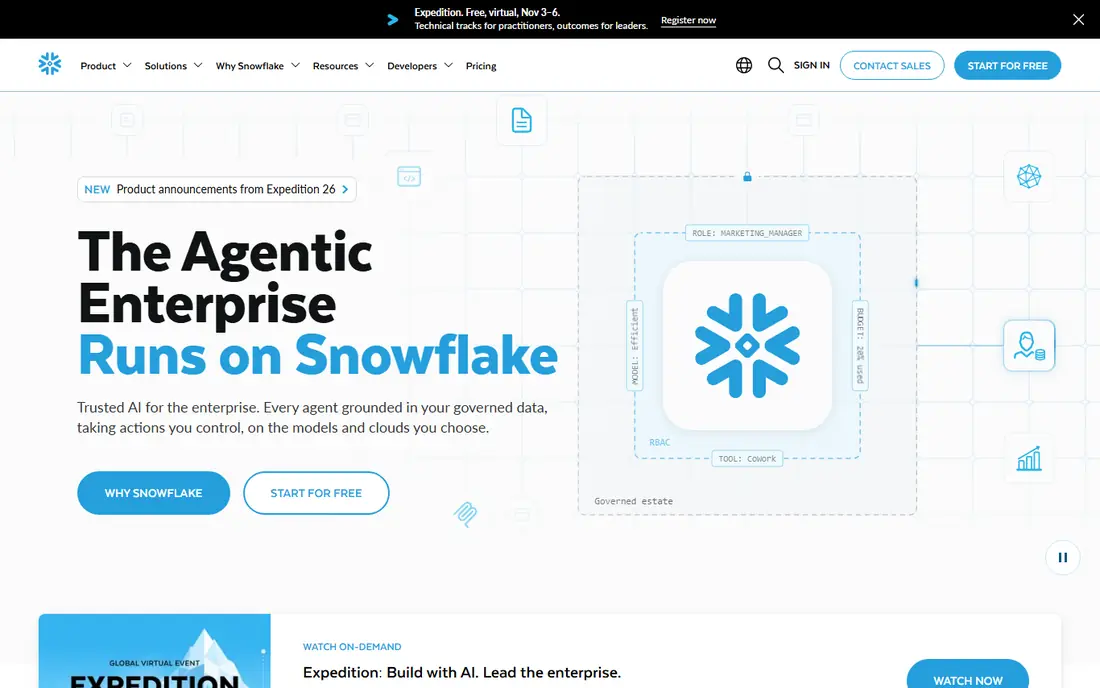
Snowflake is a managed cloud data platform for SQL analytics, data engineering, sharing, and governance, available on AWS, Azure, and Google Cloud. Its separation of compute and storage lets teams scale query power for a busy reporting hour and suspend it afterward, while data sharing lets two accounts query shared data without copying it. For a team that wants a managed warehouse without cluster management, Snowflake is a steady default.
The main cost is consumption discipline. Credits, storage, and data transfer all add up, and a warehouse with a long auto-suspend interval can waste credits overnight. Snowflake also needs a BI tool for most reporting, such as Tableau, Looker, or Power BI, so budget for that layer as well as the warehouse itself.
- Multi-cloud managed warehouse
- Separate compute and storage
- Data sharing and marketplace
- Credit costs need monitoring
- BI layer is usually a separate tool
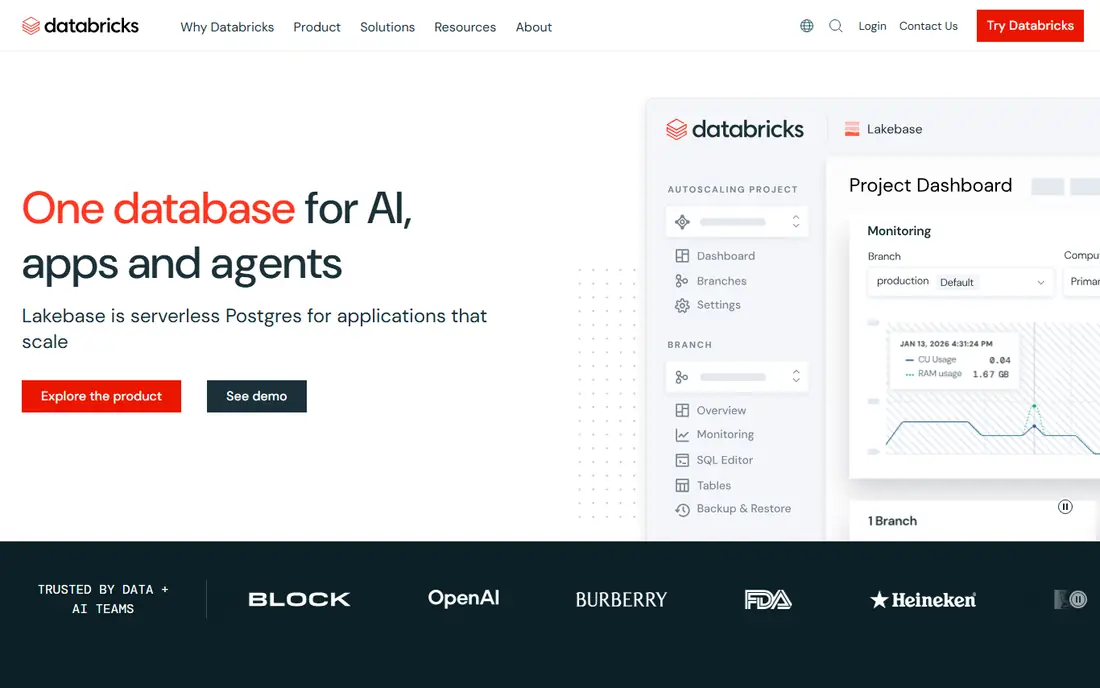
Databricks is a lakehouse platform that unifies data engineering, SQL analytics, and AI on open formats, so the same data can feed a dashboard, a streaming job, and a model without repeated copying. Databricks SQL provides warehouses for reporting, while notebooks and pipelines handle preparation and machine learning. Teams that need analytics and AI together get more from Databricks than from a warehouse alone.
The learning curve is real for a pure BI team. Spark concepts, notebook workflows, and lakehouse governance take time to learn, and a team that only needs scheduled SQL reports may find a simpler warehouse faster to adopt. For a data team with engineering and AI work alongside reporting, that extra depth is the point.
- Unified data, SQL, and AI
- Open lakehouse formats
- Streaming and batch analytics
- Deeper learning curve for pure BI teams
- Strongest inside its own ecosystem
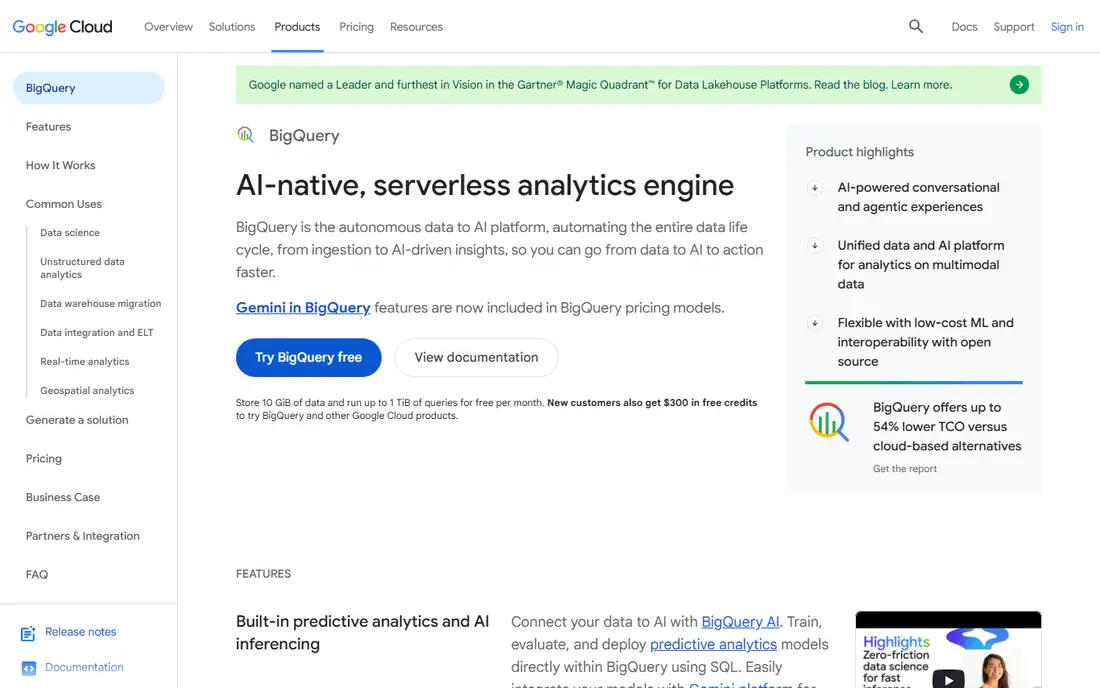
BigQuery is a serverless analytic database on Google Cloud, with no clusters to manage for standard workloads. It pairs well with Looker Studio for simple dashboards and with Looker or Tableau for governed reporting, and its built-in ML functions let analysts run models in SQL without moving data. A free tier for queries and storage makes it easy to test with real tables.
The cost model rewards careful query design. On-demand pricing charges by bytes scanned, so unfiltered queries over large tables are expensive, while partitioned tables and saved queries keep costs down. Teams should set query cost controls and review the largest queries regularly, especially as dashboard use grows.
- Serverless queries
- Free monthly query tier
- Built-in ML and geospatial functions
- On-demand cost depends on data scanned
- BI layer is usually separate
Amazon Redshift is the analytic database for AWS teams, with serverless pricing for variable workloads and provisioned clusters for steady, high-volume reporting. It integrates with S3, Glue, SageMaker, and QuickSight, and it supports streaming ingestion and data sharing across clusters. For a team whose operational data already lives on AWS, Redshift keeps analytics close to the source.
Portability is the limit, since Redshift is an AWS service and multi-cloud reporting will need extra tooling. Provisioned clusters also require node and capacity choices, so start with serverless unless usage is steady enough to plan reserved capacity with confidence.
- Strong AWS integration
- Serverless and provisioned options
- Data sharing and ML functions
- AWS-centered
- Provisioned clusters need capacity planning
Microsoft Fabric unifies data engineering, warehousing, real-time analytics, and Power BI in one SaaS platform, with OneLake as a shared storage layer. That unity is the main appeal for Power BI teams, because warehouse tables, lakehouse data, and reports share governance and storage, rather than living in separate tools with separate access rules. Data Factory pipelines and shortcuts to external data reduce copying between systems.
Capacity pricing is the planning step. Fabric capacity must cover peak pipeline and report loads, not just average use, and a team migrating from Azure Synapse or Power BI Premium should map existing capacity before choosing a Fabric tier. Run a trial with real reports and pipelines, and confirm that shortcuts cover your external sources.
- One platform for data and BI
- Native Power BI
- OneLake shared storage
- Capacity sizing needs care
- Migration from older Microsoft tools takes planning
Tableau is a visual analytics platform for dashboards, exploration, and enterprise reporting, connecting to warehouses, spreadsheets, and cloud apps. Its drag-and-drop visual builder suits analysts who want to explore data quickly, test a hypothesis in a chart, and publish a dashboard without writing a full report in code. The community and learning resources are extensive, which helps new teams get started.
Governance is the work to plan. Without a shared metric model, two Tableau workbooks can define revenue or churn differently, so larger teams should pair Tableau with a governed semantic layer or a disciplined published-data-source policy. Licensing also varies by role, so map viewer, explorer, and creator needs before buying seats.
- Strong visual exploration
- Wide data connectors
- Large user community and learning resources
- Governed metrics need careful modeling
- Licensing varies by role
Looker, now part of Google Cloud, is built around a central semantic model, called LookML, that defines metrics once so every dashboard uses the same definition. That governance is the main reason to choose Looker, especially for a company where finance, sales, and product teams must agree on revenue, retention, and other core numbers. Dashboards, scheduled reports, and embedded analytics all draw from the same model.
Modeling takes time and engineering skill, so Looker is slower to set up than a drag-and-drop BI tool, and casual users may find exploration less free-form than Tableau. For a team where metric consistency matters more than speed to a first chart, that trade is worth it, but a small team with one analyst may prefer a simpler BI layer first.
- Central semantic model for consistent metrics
- Governed dashboards
- Strong BigQuery link
- Modeling takes engineering time
- Less free-form exploration than Tableau for casual users
ThoughtSpot lets business users ask questions in plain language, such as sales by region last quarter, and get a chart or table without waiting for an analyst to build a dashboard. AI-assisted features suggest follow-up questions and explain answers, which helps non-technical users explore data safely. Embedded analytics options also let product teams put ThoughtSpot search inside their own apps.
Modeling still matters. ThoughtSpot answers are only as good as the underlying data model, so a team still needs clean tables, clear metric definitions, and access controls. Pricing varies by deployment and use, so request a trial on your own warehouse data and test the exact questions your business users actually ask.
- Plain-language search over data
- AI-assisted answers
- Embedded analytics options
- Data modeling still matters for accurate answers
- Pricing varies by use and deployment
How we picked these
We compared official platform pages, warehouse and lakehouse features, BI and semantic modeling, governance controls, cloud coverage, and pricing models, along with 2026 enterprise analytics guides. We kept platforms that are live in October 2026, run in the cloud, and are used for production analytics, and we left out desktop-only tools and single-purpose chart libraries. We did not claim hands-on testing, and prices are shown as See website where vendor pricing is quoted, role-based, or consumption-based.
How to choose a cloud analytics stack
Start with the question your team must answer every week. A finance team needs governed, auditable numbers, which points to Looker or a governed warehouse model, while a product team needs fast exploration, which points to Tableau or ThoughtSpot on top of a warehouse. A team that also builds models needs Databricks, while a team that only reports needs a simpler warehouse plus BI.
Next, check the data you already have. A Google Cloud team will get faster value from BigQuery, an AWS team from Redshift, and a Microsoft team from Fabric, because ingestion, identity, and billing already line up. Multi-cloud teams should favor Snowflake or Databricks for portability, and accept that a BI layer will still be needed on top.
Finally, control cost from the first week. Set warehouse auto-suspend, partition large tables, limit who can run unfiltered queries, and review the top queries and dashboards monthly. A platform that looks cheap in a trial can become expensive once every team schedules a daily dashboard refresh over a full historical table.
Frequently asked questions
What is the best cloud analytics software for a small team?
BigQuery is a strong small-team choice, because it is serverless and offers a free monthly tier, while Snowflake offers a managed warehouse with a free trial. Pair either with a simple BI tool first, and add a governed semantic layer only when metric disagreements appear.
What is the difference between a data warehouse and a lakehouse?
A data warehouse stores structured data optimized for SQL reporting, while a lakehouse adds open file formats and streaming on top of lake storage, so the same data can serve SQL, engineering, and AI workloads. Snowflake and BigQuery are warehouse-led, while Databricks is lakehouse-led.
Do I need a separate BI tool with Snowflake or BigQuery?
Usually yes, since warehouses focus on storage and querying, while BI tools provide dashboards, exploration, and sharing. Some teams use Looker Studio or Power BI for simple reporting, and Tableau, Looker, or ThoughtSpot for governed or self-service reporting at scale.
How much do cloud analytics platforms cost?
Most platforms use consumption, capacity, or per-user pricing, so total cost depends on query volume, data size, and seat count. Request a trial on real data, measure query and storage use, and check whether BI seats, data transfer, and support are priced separately.
Can cloud analytics platforms handle real-time data?
Yes, with the right design. Databricks and Fabric support streaming pipelines, BigQuery supports streaming inserts, and Redshift supports streaming ingestion, but real-time dashboards still need fresh data pipelines and careful cost controls. A daily batch is cheaper and sufficient for many weekly business reports.
Sources
See where you really rank - block by block
ProMapRanker scans Google Maps across a grid of your service area. Simple monthly plans from $19, white-label on every plan.
Start freeKeep reading
 wpforms alternatives
Best WPForms Alternatives in 2026
We compare 9 wpforms alternatives for WordPress forms, with free and paid options, current pricing notes, and honest limits for small business sites in 2026.
Read → windows task scheduler alternatives
Best Windows Task Scheduler Alternatives in 2026
Looking for Windows Task Scheduler alternatives? We compare 9 schedulers for Windows and cross-platform work, from free tools to enterprise automation.
Read → which ai video service is best
Which AI Video Service Is Best in 2026
which ai video service is best? We compare 10 legitimate AI video services on price, avatars, editing and output quality to help you pick the right tool.
Read →