 ProMapRanker
Alternatives to Grafana in 2026


Managed observability across infrastructure, apps and logs · Pricing starts at: $15.00 per host per month
Key takeaways
- Datadog, Dynatrace and New Relic suit teams that want a managed platform covering metrics, logs and traces in one place.
- Prometheus, SigNoz and Zabbix suit teams that want to self-host and avoid per-host or per-user bills.
- Kibana suits teams already invested in Elasticsearch, while Checkmk suits traditional infrastructure monitoring.
- Open source is free in licence terms, but you still pay in hosting, upgrades and on-call time.
- Match the tool to the layer that hurts, whether that is dashboards, metrics, logs or full observability.
Quick comparison
| Pick | Great for | Pricing starts at | Free tier | |
|---|---|---|---|---|
| Datadog | Managed observability across infrastructure, apps and logs | $15.00 per host per month | Free trial | Visit |
 Dynatrace | Automated root-cause analysis at enterprise scale | See website | Free trial | Visit |
 New Relic | Full-stack observability with a free start | Free | Yes | Visit |
 Prometheus | Open source metrics and alerting for Kubernetes | Free | Yes | Visit |
 SigNoz | Open source metrics, logs and traces in one stack | Free | Yes | Visit |
 Kibana | Dashboards and search for Elasticsearch data | See website | Yes | Visit |
 Zabbix | Self-hosted infrastructure and network monitoring | Free | Yes | Visit |
 Checkmk | Hybrid infrastructure monitoring with strong checks | See website | Yes | Visit |
The best alternatives to Grafana
We compared official feature pages, pricing pages and product docs for tools that replace Grafana, either as a dashboard, a metrics store or a full observability platform. Grafana itself is not listed here, since this article covers replacements. Some tools need a separate data source, while others bundle storage and visualisation together, so each entry notes that split.
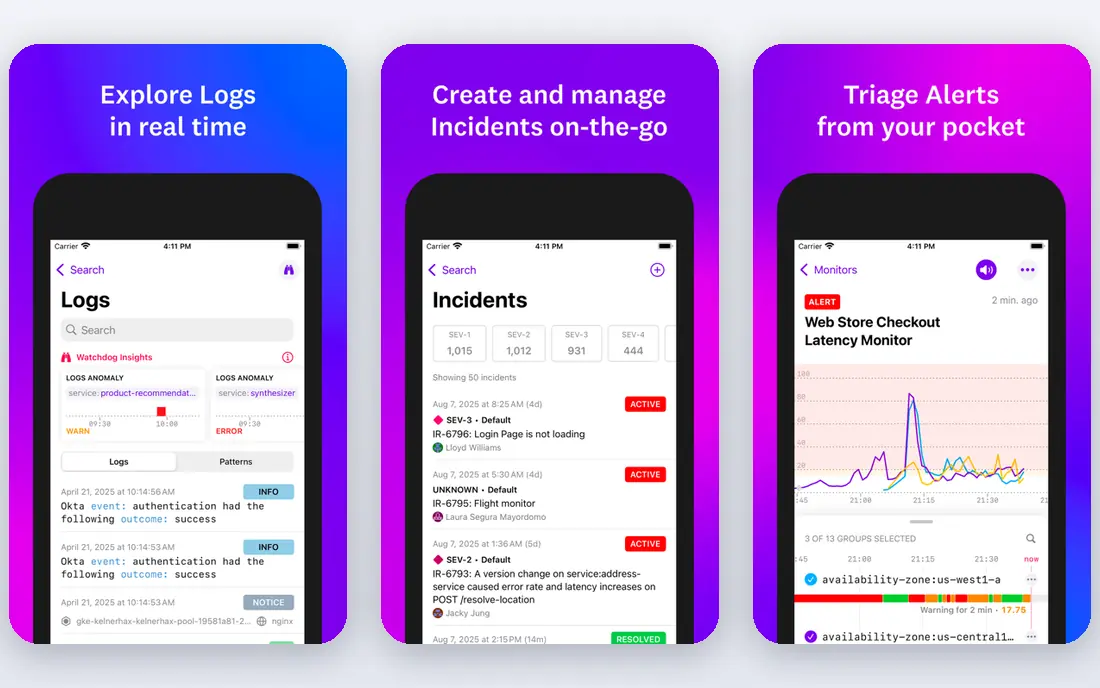
Datadog is the fastest route to full coverage if you do not want to run backends yourself. It collects infrastructure metrics, application traces and logs, then lets you build dashboards and alerts in one interface. The integration catalog covers most cloud services and databases, which cuts setup time for teams moving off a self-hosted stack.
The bill is the risk. Per-host pricing plus charges for custom metrics and log volume can grow faster than expected, so model your real host count and data volume before committing. For teams with budget and a need for speed, Datadog is the most complete Grafana replacement here.
- Metrics, logs, traces and security in one platform
- Large integration catalog
- Strong alerting and dashboards
- Costs rise with hosts, metrics and log volume
- Pricing needs careful modelling at scale
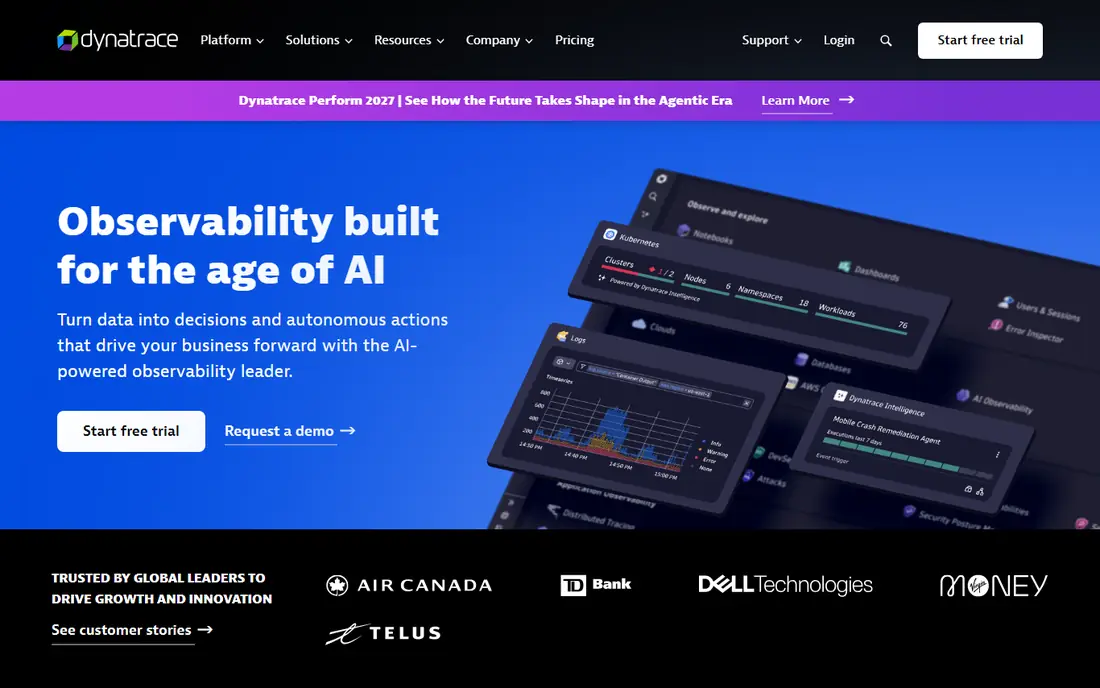
Dynatrace suits large, complex estates where manual dashboard building is the bottleneck. It discovers services and dependencies automatically, then links metrics, logs and traces to explain why a service failed, rather than just showing that it failed. That automation helps on-call teams who face unfamiliar failures at night.
It is not a cheap or light replacement. Pricing is usage-based and often quoted, and the platform is more than a team needs if they only want prettier charts. For enterprises with deep microservices and a budget for automation, Dynatrace justifies its place on the shortlist.
- Automatic discovery of services
- AI-assisted root-cause analysis
- Full-stack tracing and infrastructure monitoring
- Enterprise pricing, quoted rather than published for many setups
- Heavier than a simple dashboard swap
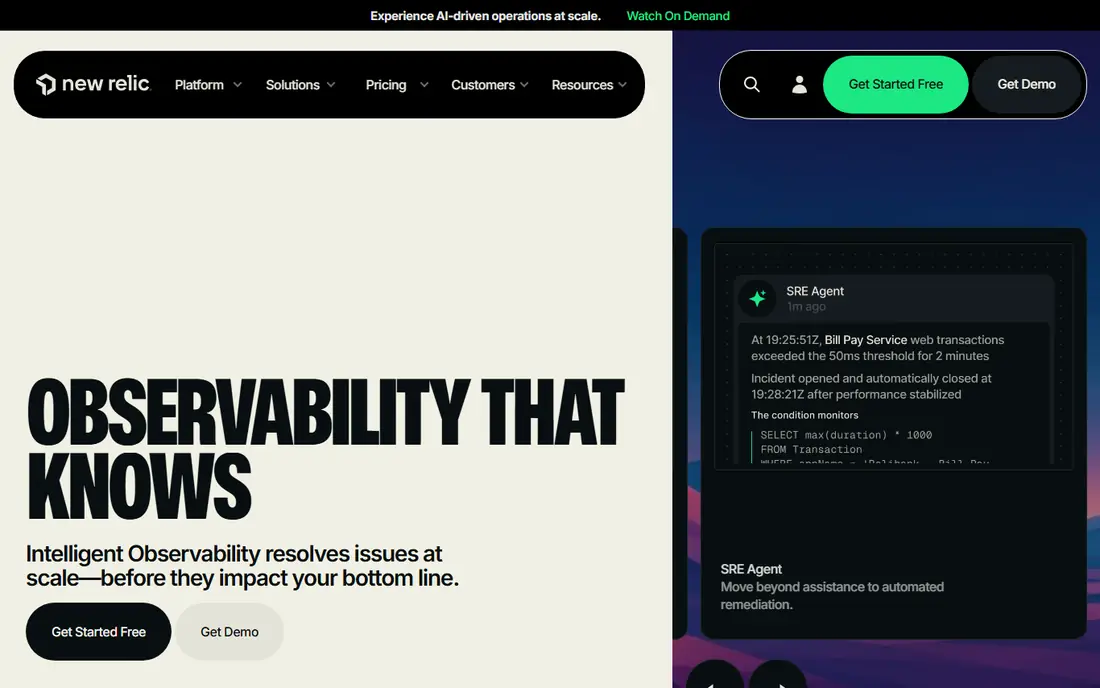
New Relic is the friendliest managed option for developer-led teams. The free tier includes a monthly data allowance and one full user, which is enough to run a small production service and test the platform properly. Dashboards, alerts and application tracing sit in the same interface, so you do not need to stitch several tools together.
Beyond the free tier, pricing depends on data volume and user seats, so check the current rates for your usage. It is still a managed platform, so you trade control for convenience. For teams that want to leave Grafana setup behind without paying from day one, New Relic is a strong first trial.
- Free tier with monthly data allowance
- APM, infrastructure, logs and dashboards in one platform
- Simpler pricing than some rivals
- Costs rise with data and paid users beyond the free tier
- Some advanced features sit on paid plans
Prometheus is the metrics engine behind many Grafana setups, so it is a natural alternative when the problem is collection rather than charts. It scrapes metrics from services, stores time-series data and alerts through Alertmanager, with a query language that suits infrastructure work. Its exporter ecosystem covers databases, servers and cloud services.
On its own, Prometheus does not give you polished dashboards, so you will pair it with a visualisation tool or use its basic web interface. Storage and retention also need planning at scale. If you want free, proven metrics collection and you can handle the dashboard layer separately, Prometheus is hard to beat.
- Free and open source
- Standard for Kubernetes metrics
- Strong query language and alerting
- Large exporter ecosystem
- Not a visualisation tool on its own
- Needs a dashboard layer
- Long-term storage needs extra setup
SigNoz answers the complaint that Grafana needs several backends to cover metrics, logs and traces. It bundles all three in one interface, built around OpenTelemetry, so teams can follow a request from a metric spike to a log line to a trace without switching tools. The self-hosted version is free, and a managed cloud option exists for teams that do not want to run it.
The trade-off is maturity. The community is smaller than Prometheus or Zabbix, and the ClickHouse backend needs tuning, backups and scaling. If you want a unified open source stack and you can run a database, SigNoz is the most complete free alternative here.
- Metrics, logs and traces in one interface
- OpenTelemetry native
- Self-hosted option keeps data on your infrastructure
- Younger project with a smaller ecosystem
- Running its database backend takes real operational work
Kibana is the dashboard layer for the Elastic Stack, and it suits teams whose logs already live in Elasticsearch. It offers search, dashboards, visualisations and alerting over that data, with full-text search that suits log-heavy work better than a metrics-only tool. If your team already runs Elasticsearch for search or security, Kibana keeps the stack short.
It is less flexible as a general dashboard for many unrelated data sources, which is where Grafana shines. Managed Elastic Cloud pricing also varies by deployment size, so check the current rate. For Elasticsearch-centred teams, Kibana is the natural Grafana replacement.
- Native fit for Elasticsearch logs and search
- Strong full-text search
- Dashboards, maps and alerting in one tool
- Works best with Elasticsearch, so it is not a general multi-source dashboard
- Managed costs vary by deployment
Zabbix is a long-running choice for traditional infrastructure monitoring. It checks servers, networks and services with agents and templates, and it alerts when thresholds break. The self-hosted version is free, which suits teams that want predictable costs and full control over their data.
The interface is less polished than Datadog or New Relic, and initial setup needs care to avoid alert noise. A managed cloud option exists for teams that do not want to host it. If your estate includes bare metal, network devices and older systems alongside cloud services, Zabbix covers ground that newer tools sometimes miss.
- Free self-hosted version
- Agent-based checks for servers and networks
- Strong alerting and templates
- Interface feels older than newer tools
- Setup and tuning take time
- Managed cloud costs extra
Checkmk suits teams with a mixed estate of on-prem servers, network gear and cloud hosts. It offers a large catalog of checks, a free edition for smaller setups and paid editions for larger estates. The host and service views make it easy to see which part of an estate is unhealthy, without building dashboards from scratch.
Configuration is rule-based, which takes time to learn, and larger pricing is often quoted rather than published. For traditional IT operations that need depth across infrastructure types, Checkmk is a practical Grafana alternative, especially where Prometheus-style metrics are not the whole story.
- Free edition for smaller setups
- Broad check catalog for servers, networks and cloud
- Clear host and service views
- Pricing for larger editions is quote-based in many cases
- Learning curve for rule-based configuration
How we picked these
We compared official feature pages, pricing pages and product docs, and we kept only tools that are live and replace at least one core Grafana job today. We looked for a mix of managed platforms, open source stacks and dashboard layers, and we noted where a tool needs a separate data source. Prices are starting rates shown in October 2026 listings, and managed pricing changes often, so confirm the rate for your host count and data volume before you commit.
What to check before you switch
Start with the layer that hurts. If dashboards are the problem, a tool like Kibana or a managed platform may help. If metrics collection is the problem, Prometheus may be enough. If you need logs, metrics and traces together, a full platform like Datadog, New Relic or SigNoz will save more time than a dashboard swap alone.
Next, count the total cost, not just the licence. Open source tools are free to download, but you pay for servers, storage, upgrades and the engineer who gets paged when the monitoring stack itself fails. Managed tools charge per host, per user or per gigabyte, so model your real usage. Finally, trial with your real data and your real on-call workflow, since a tool that looks good in a demo can still produce noisy alerts or slow queries on your estate.
Frequently asked questions
What are the best Grafana alternatives?
Datadog, Dynatrace and New Relic suit managed full observability, while Prometheus, SigNoz and Zabbix suit self-hosted setups. Kibana suits Elasticsearch teams, and Checkmk suits traditional infrastructure monitoring.
What is the best open source Grafana alternative?
SigNoz is the most complete open source option, since it bundles metrics, logs and traces in one interface. Prometheus suits metrics alone, and Zabbix suits infrastructure and network monitoring.
Can I replace Grafana with Datadog or New Relic?
Yes, if you want a managed platform that covers storage, dashboards and alerting together. Both replace the dashboard layer and the backends Grafana usually queries, at a per-host or per-data cost.
Is there a free alternative to Grafana?
Yes. Prometheus, SigNoz and the self-hosted version of Zabbix are free, and New Relic offers a free tier with a monthly data allowance. Free software still needs hosting and upkeep, so budget for that time.
Which Grafana alternative is best for small teams?
New Relic suits small teams that want a managed start with a free tier, while SigNoz suits small teams that can self-host. Pick New Relic if you want less setup, and SigNoz if you want full control and no per-host bill.
Sources
See where you really rank - block by block
ProMapRanker scans Google Maps across a grid of your service area. Simple monthly plans from $19, white-label on every plan.
Start freeKeep reading
 best rank tracking software
Best Rank Tracking Software in 2026
Searching for the best rank tracking software? We compare 8 tools for daily keyword tracking, local rankings, client reports, and competitor checks in 2026.
Read → best platform for ecommerce website
Best Platform for Ecommerce Website in 2026
Find the best platform for ecommerce website builds in 2026. We compare Shopify, WooCommerce, BigCommerce, Wix and more on price, fees and scale for stores.
Read → best math apps
Best Math Apps in 2026: 8 Apps Compared
Find the best math apps for homework, revision, and deeper study in our 2026 comparison of 8 free and paid solvers, courses, and visual tools for students.
Read →