 ProMapRanker
Best Hardware Monitoring Software in 2026

Key takeaways
- HWiNFO is our top pick for most Windows users, because it covers sensors, voltages, fan speeds, and detailed hardware data in one free tool for personal use.
- HWMonitor and Core Temp suit users who want a simple temperature view without a long list of readings.
- Libre Hardware Monitor and Open Hardware Monitor are strong open-source options, with the latter best for older hardware and simple setups.
- AIDA64, MSI Afterburner, and NZXT CAM add stress testing, overclocking controls, or a polished dashboard for gamers and builders.
- Always download monitoring tools from the official vendor site, since repacked installers can carry unwanted software.
Quick comparison
| Pick | Great for | Pricing starts at | Free tier | |
|---|---|---|---|---|
 HWiNFO | Most complete Windows sensor monitoring | Free | Yes | Visit |
 HWMonitor | Simple temperature and voltage view | Free | Yes | Visit |
 Libre Hardware Monitor | Open-source monitoring for modern PCs | Free | Yes | Visit |
 Open Hardware Monitor | Lightweight open-source monitoring | Free | Yes | Visit |
 AIDA64 | Detailed diagnostics plus stress testing | See website | Free trial | Visit |
 Core Temp | Simple CPU temperature monitoring | Free | Yes | Visit |
 MSI Afterburner | GPU monitoring and overclocking controls | Free | Yes | Visit |
 NZXT CAM | Polished dashboard for gamers | Free | Yes | Visit |
 CPU-Z | Quick hardware identification and specs | Free | Yes | Visit |
The best hardware monitoring software
We compared tools that read real PC sensors and system data, such as CPU and GPU temperatures, fan speeds, voltages, clock speeds, and utilization, rather than tools that only show a single benchmark score.

HWiNFO is the tool we suggest first for a Windows PC owner who wants the full picture. It lists temperatures, voltages, fan speeds, power use, clock speeds, and utilization for CPU, GPU, motherboard, memory, and drives, and it lets you set alerts for values that matter to you. Logging helps when a problem only appears during a game or a long render.
The main drawback is density. A first-time user can feel lost in the sensor list, so start by watching CPU and GPU temperatures and fan speeds, then add other sensors as you learn what they mean. For diagnosis and routine checks, its depth is a clear advantage.
- Very wide sensor coverage
- Customizable alerts and logging
- Free for personal and non-commercial use
- Large amount of data can overwhelm beginners
- Windows only
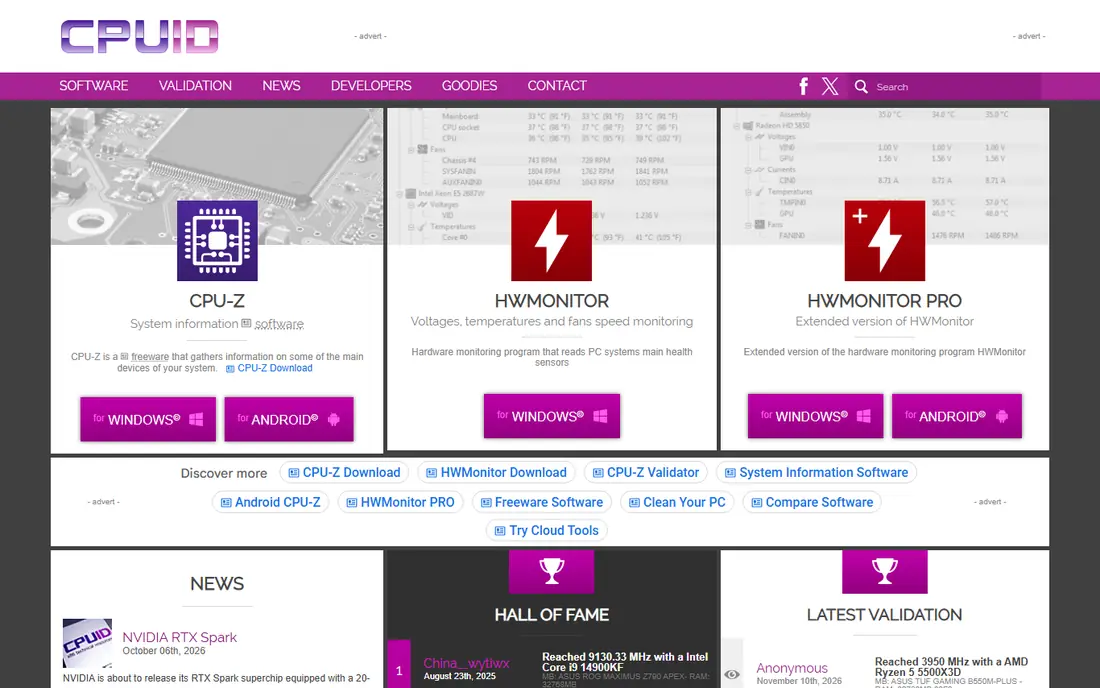
HWMonitor, from CPUID, gives a clean list of sensor values without extra panels. You can see current, minimum, and maximum temperatures and voltages for the main parts of a PC, which is enough to spot overheating or a fan that is not spinning as expected. Its simple layout makes it a good second tool for a quick check.
It is less flexible for long logging or detailed alerts. If you need to record a problem over hours, HWiNFO or AIDA64 will serve you better. For a fast answer to the question of whether a PC is running hot, HWMonitor is hard to beat for simplicity.
- Clear list of temperatures, voltages, and fan speeds
- Easy to read at a glance
- Free version available
- Fewer customization and logging options than HWiNFO
- Mainly a monitoring view, not a full diagnostic suite
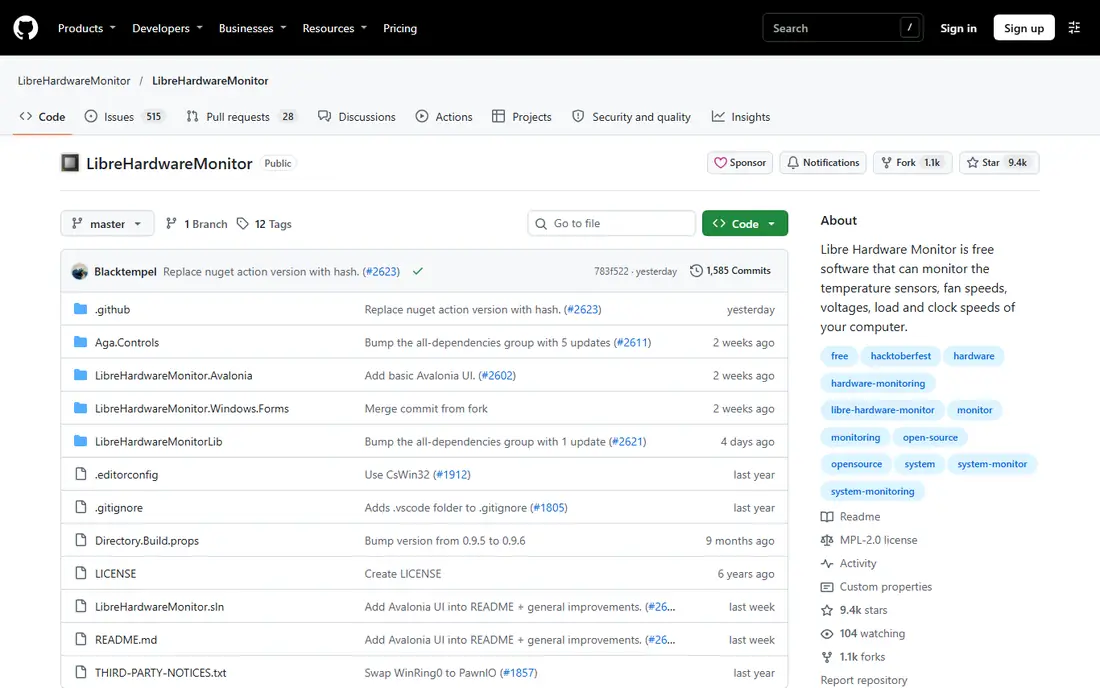
Libre Hardware Monitor continues the open-source work started by Open Hardware Monitor, with support for newer hardware and a cleaner interface. It shows temperatures, fan speeds, voltages, and load for CPU, GPU, and other parts, and it can log data for later review. Because the code is open, users can inspect how it works and report issues.
Support comes from the community rather than a vendor help desk, so a user who needs a guaranteed response time may prefer a commercial tool. For a knowledgeable PC owner who values open software, it is a strong and free choice.
- Open source and free
- Modern hardware support
- Customizable display and logging options
- Community project without a commercial support desk
- Some newer parts may need an update for full support
Open Hardware Monitor is a light, portable tool that runs without a heavy install. It shows CPU, GPU, drive, and motherboard sensors in a simple tree, which is easy to follow for a basic check. Its small size makes it useful on a USB drive for checking a second PC.
The main limit is age. Development has slowed, so very new CPUs, GPUs, and motherboards may not show every sensor. For an older PC or a simple temperature check, it still works well, but newer builds should start with HWiNFO or Libre Hardware Monitor.
- Free and open source
- Portable and lightweight
- Simple tree view of sensors
- Development has slowed, so newer hardware support is limited
- No built-in alerts for critical values
AIDA64 suits a builder or repair technician who needs more than a temperature list. It produces detailed hardware reports, runs benchmarks, and can stress test a CPU, GPU, memory, or storage to check stability after a build or an upgrade. Its sensor panel can also stay visible during a test, so you can watch temperatures rise in real time.
Casual users may find the price and depth unnecessary. If your only question is whether a laptop runs hot, a free tool will answer it faster. For a thorough diagnostic after new hardware, AIDA64 earns its place.
- Deep hardware reports and benchmarks
- Stress testing for stability checks
- Sensor panel and logging options
- Paid software, so cost applies after a trial
- Interface is dense for casual users
Core Temp does one job well. It shows per-core CPU temperatures in a small window, which is ideal for a user who is testing a new cooler or checking a CPU under load. Its light footprint means it can run in the background without getting in the way of a game or work app.
It will not show GPU temperatures, fan speeds, or voltages in the same depth as HWiNFO. Pair it with a GPU tool such as MSI Afterburner if you need both sides of a gaming PC. During install, read each screen carefully and decline any extra offers.
- Focused CPU temperature view
- Small and light
- Per-core readings for supported CPUs
- CPU only, so GPU and other sensors need another tool
- Installer options need care during setup
MSI Afterburner is the standard free tool for GPU monitoring and control. Its on-screen display can show GPU temperature, clock speed, fan speed, and frame rate while a game runs, which helps a player spot throttling or a fan problem without leaving the game. Custom fan curves let you balance noise and cooling.
The controls deserve respect. Raising clocks or power limits without testing can cause crashes or extra heat, so change one setting at a time and test it. Used mainly as a monitor, it is safe and very useful for any gaming PC.
- Free GPU monitoring with on-screen display
- Fan curve and clock controls
- Works with many graphics cards, not only MSI cards
- Focused on GPU work, so full system monitoring needs another tool
- Controls need care to avoid unstable settings
NZXT CAM presents PC health in a polished dashboard that is easy to read during a game or work session. It shows CPU and GPU temperatures, load, and fan speeds, and it can control NZXT cooling and lighting hardware from the same app. For a PC built with NZXT parts, that integration is convenient.
Users who want a minimal monitor may find it heavier than HWMonitor or Core Temp. It also works best when paired with NZXT hardware for full control. For a gamer who wants a clear dashboard and owns compatible parts, it is a good fit.
- Clean dashboard for temperatures, load, and fan control
- Useful for NZXT cooling and lighting setups
- Easy to read at a glance
- Best with NZXT hardware for full control
- Some users prefer a lighter tool without an account or cloud features
CPU-Z is not a full monitoring tool, but it belongs in this list because it answers the first question in any diagnosis, which is what hardware you actually have. It shows CPU model, clock speeds, cache, memory type and timings, and motherboard details in a compact window. That information helps when you compare temperatures against the expected specs for your parts.
For live temperatures and fan speeds, pair it with HWiNFO or HWMonitor. Used together, CPU-Z identifies the parts and the monitor watches how they behave under load.
- Fast and accurate hardware identification
- CPU, memory, and motherboard details
- Free and lightweight
- Not a full sensor monitor
- Temperature and fan data are limited compared with HWiNFO
How we picked these
We compared official product pages, documentation, and public feature lists for tools that are live in October 2026 and that read PC sensors or hardware data on Windows. We kept a mix of full monitors, simple temperature tools, GPU tools, and one identification tool, so readers can match the tool to the job. Where pricing was not a simple public figure, we wrote See website rather than guessing.
How to choose hardware monitoring software
Start with the question you need answered. For a general health check, HWiNFO covers the most sensors. For a quick temperature check, HWMonitor or Core Temp is faster. For GPU work, add MSI Afterburner. For a full build check, add AIDA64 or CPU-Z.
Watch the right values first
CPU and GPU temperatures, fan speeds, and clock speeds tell you most of what you need during a game or heavy task. If temperatures rise sharply and clocks drop, the PC may be throttling to protect itself. Check airflow, dust, and fan curves before assuming a part is faulty.
Log a problem before you change parts
If a crash only happens after an hour of use, log temperatures and load over that period. A log shows whether heat, power, or a specific part lines up with the crash. That evidence saves money, because it stops a guess-based part replacement.
Download only from the vendor
Monitoring tools need deep system access to read sensors, so a fake installer is a real risk. Download from the official vendor site, check the publisher name, and avoid repacked downloads from unknown sites. If an installer offers extra software, decline it.
Frequently asked questions
What is the best PC monitoring software for temperatures?
HWiNFO is the best all-round choice for Windows, because it covers CPU and GPU temperatures, fan speeds, and voltages in one free tool for personal use. HWMonitor is a simpler option for a quick temperature check.
What is the best CPU monitoring software?
Core Temp is a good simple choice for CPU temperatures alone, while HWiNFO covers CPU temperatures plus many other sensors. Choose Core Temp for a light view and HWiNFO for a full diagnosis.
What is the best free hardware monitoring software?
HWiNFO, HWMonitor, Libre Hardware Monitor, and Core Temp are all free for personal use. HWiNFO offers the widest coverage, while the others offer simpler views or open-source code.
Is hardware monitoring software safe?
Yes, when downloaded from the official vendor site. These tools read sensors and need system access, so avoid repacked installers and check the publisher before installing.
Why do some sensors show no value?
Some motherboards, laptops, and graphics cards do not expose every sensor, so a tool may show a blank value for that part. Try a second tool, update drivers and BIOS if you are comfortable doing so, and check the vendor documentation for your exact model.
Sources
See where you really rank - block by block
ProMapRanker scans Google Maps across a grid of your service area. Simple monthly plans from $19, white-label on every plan.
Start freeKeep reading
 twitch alternatives
Twitch Alternatives in 2026
Explore the best Twitch alternatives in 2026 for live streaming, with free platforms, monetisation options, audiences, chat tools, and tips for new streamers.
Read → firebase alternatives
Best Firebase Alternatives in 2026
Looking for Firebase alternatives? We compare 9 backend platforms for auth, databases, realtime, storage, functions, self-hosting, and pricing for your app.
Read → companies with best work life balance
Companies With Best Work Life Balance in 2026
See companies with best work life balance in 2026, ranked by employee ratings, with flexible work options, benefits, and what to check before applying.
Read →