 ProMapRanker
Best Digital Experience Monitoring Companies in 2026


Large hybrid estates and automated root cause · Pricing starts at: See website
Key takeaways
- Digital experience monitoring covers different jobs: customer websites, networks, and employee devices need different tools.
- New Relic offers a genuine free tier with 100 GB of monthly ingest, while Datadog and Dynatrace are usage or host based.
- Catchpoint and ThousandEyes stand out for network and synthetic reach, not for full application tracing alone.
- Pricing units differ sharply, so compare cost by hosts, data volume, or devices before signing a contract.
Quick comparison
| Pick | Great for | Pricing starts at | Free tier | |
|---|---|---|---|---|
| Dynatrace | Large hybrid estates and automated root cause | See website | Free trial | Visit |
 Datadog | Cloud teams already using Datadog | $15 per host per month | Free trial | Visit |
 New Relic | Teams that want a free starting point | Free | Yes | Visit |
 Cisco ThousandEyes | Network path and internet visibility | See website | Free trial | Visit |
 Catchpoint | Global synthetic monitoring reach | See website | No | Visit |
 Splunk Observability | Splunk users and streaming analytics | $15 per host per month | Free trial | Visit |
 Cisco AppDynamics | Business transaction monitoring | See website | Free trial | Visit |
 Nexthink | Employee device experience | See website | No | Visit |
 Riverbed Aternity | Endpoint and virtual desktop experience | See website | No | Visit |
The best digital experience monitoring companies
Digital experience monitoring, often shortened to DEM, watches how real people experience websites, apps, and workplace tools. Some tools focus on customer journeys, others on networks, and others on employee devices, so the right choice starts with the experience you need to protect.
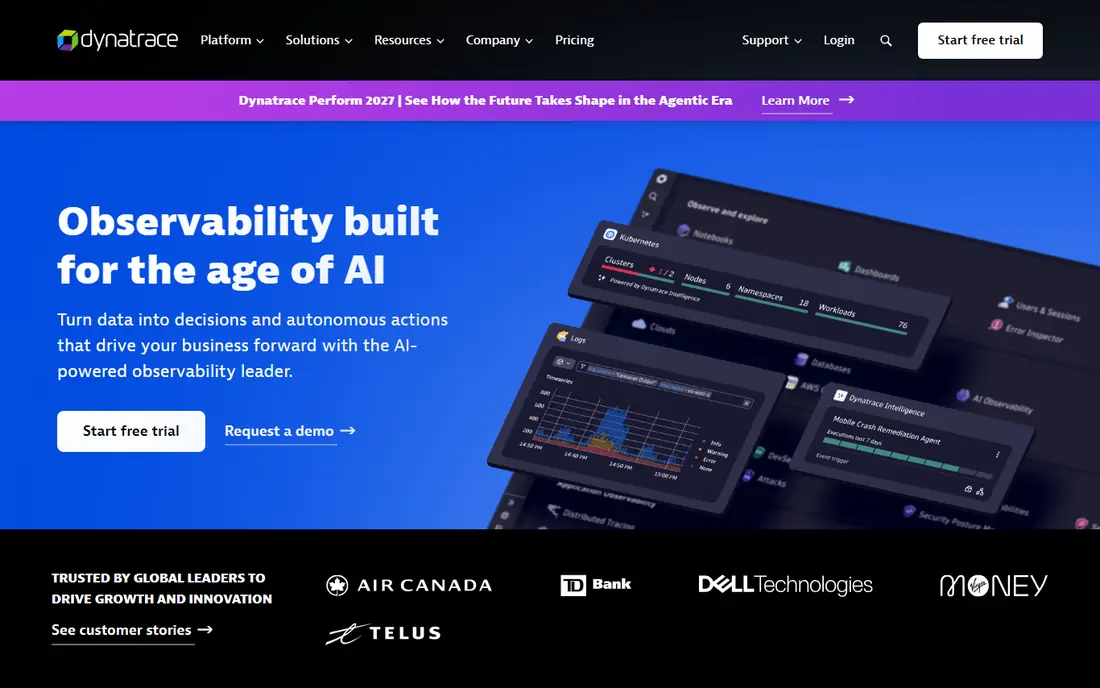
Dynatrace is built for large, complex estates where a slow checkout could involve dozens of services, clouds, and third-party tools. Its platform maps dependencies automatically and uses AI analysis to point teams toward a likely root cause, which can cut the time spent guessing across dashboards. Coverage includes real-user monitoring, synthetic tests, session replay, and mobile experience in one platform.
The cost model is the main barrier. Dynatrace uses consumption-based pricing, and published summaries describe host and data-based charges that add up quickly at scale. Small teams may find the platform more than they need, while large enterprises with hybrid systems are the audience that gains most from its automation.
- Automatic dependency mapping
- AI-driven root cause analysis
- Real-user, synthetic, and session replay coverage
- Enterprise pricing and complexity
- Trial only, no ongoing free tier
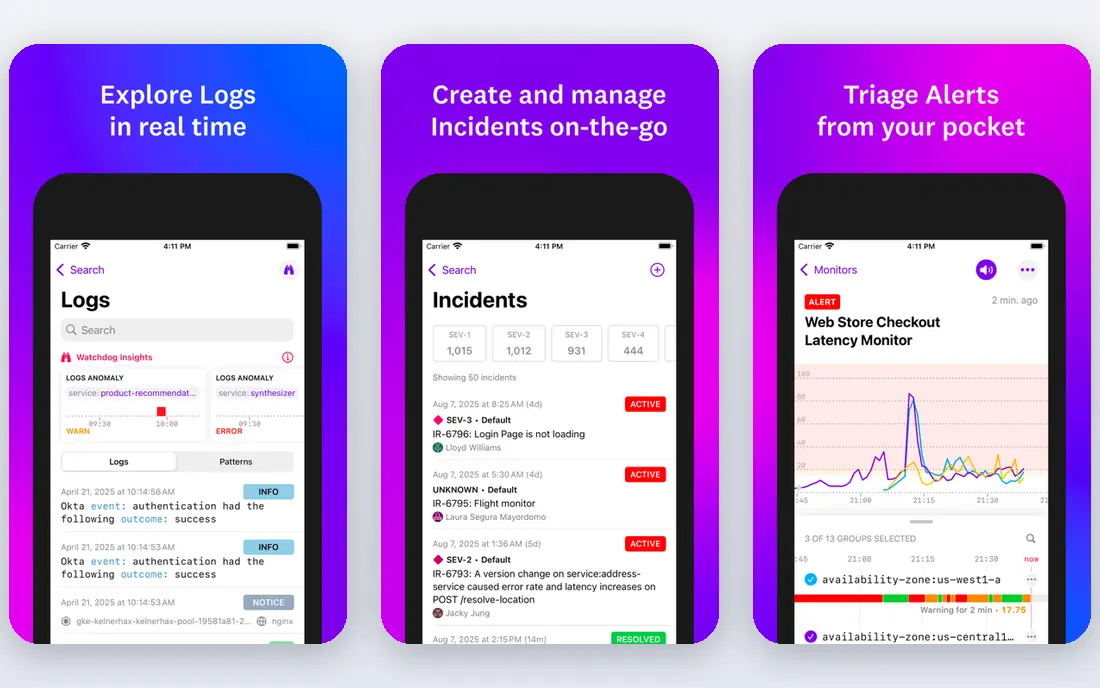
Datadog suits teams that already run infrastructure monitoring, APM, or logs on the platform, because DEM data can sit beside backend traces and dashboards. Its browser and mobile real-user monitoring, synthetic tests, and session replay help teams connect a slow page to a failing service without switching vendors. The integration library is broad, which helps cloud-native teams standardize on one vendor.
Pricing needs care. Infrastructure Pro is listed from $15 per host per month billed annually, with APM and other products billed separately, so a full DEM setup costs more than the headline host rate. Teams should model hosts, synthetic tests, and session replay volume before budgeting, and set retention limits early.
- One platform for infrastructure, APM, logs, and DEM
- Large integration library
- RUM and session replay
- Modular pricing can grow in complex ways
- No ongoing free ingest tier for production
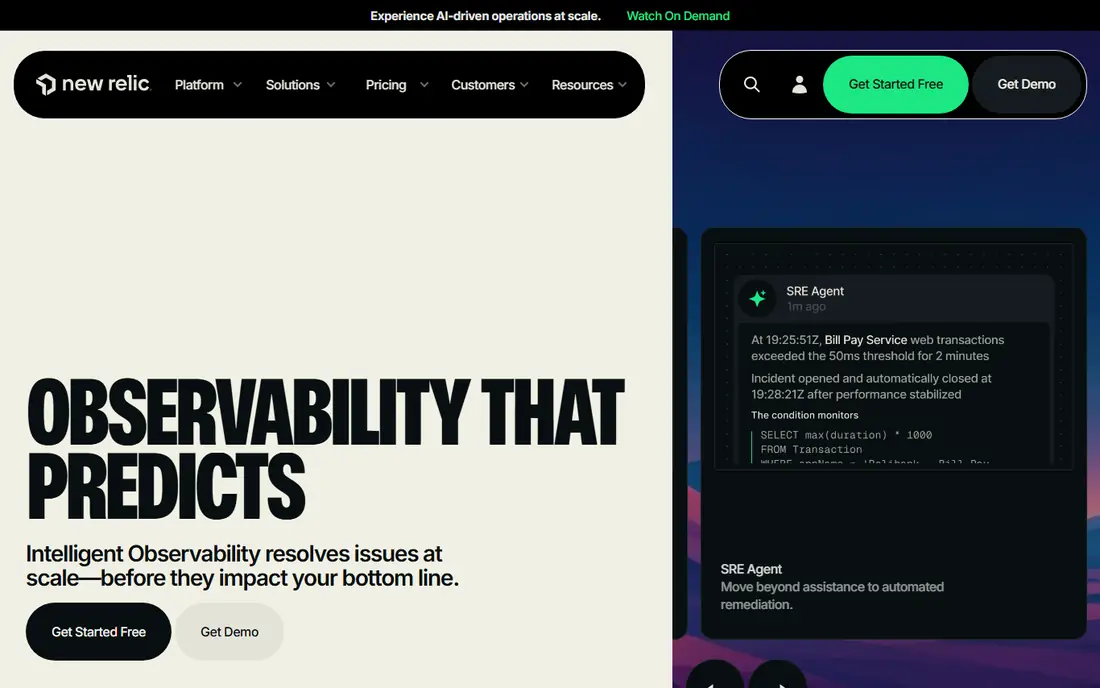
New Relic is the easiest starting point on this list for a small team, because its free tier includes 100 GB of monthly data ingest and one full-platform user, with additional basic users able to view dashboards. Browser monitoring covers Core Web Vitals, synthetic monitors run scripted and simple checks, and session replay includes configurable data masking for privacy. That combination lets a team monitor a real product before paying.
The free tier has limits. Data beyond the allowance is charged by volume, and full-platform seats for editing and administration cost extra, so a growing team should watch ingest and user counts. Still, for a team that wants unified observability with a low-cost trial in production, New Relic is a practical first choice.
- 100 GB monthly free ingest
- Browser, mobile, synthetic, and session replay
- One full-platform user free
- Usage charges beyond the free allowance
- Paid user seats add cost
ThousandEyes, now part of Cisco, answers a different question than most DEM tools: is the problem in your app, your cloud, or the internet path between the user and your service. It visualizes network paths, BGP routing, and cloud connectivity, which helps teams prove whether an ISP or a third-party service caused an outage. Endpoint agents extend that view to remote workers.
The limit is scope. ThousandEyes does not provide application-level real-user monitoring or session replay, so teams that need page-level diagnostics still need another tool. It fits best as a network companion to an APM or RUM platform, or as the main tool for network-heavy operations teams.
- Network path and BGP visibility
- Cloud and internet monitoring
- Endpoint agents for remote workers
- No application RUM or session replay
- Enterprise-leaning pricing
Catchpoint is known for synthetic monitoring from a large global network, which helps teams test performance across regions, ISPs, CDNs, and DNS providers before users complain. It also offers real-user monitoring and endpoint monitoring, so a team can compare synthetic baselines with real visitor experience. That reach matters for global sites and SaaS products with users in many countries.
Pricing is custom and enterprise oriented, which makes it a harder fit for small teams that only need basic uptime checks. Teams should ask how many test locations, test frequency, and data retention are included in a quote, because those settings drive the final price more than the headline platform fee.
- Large global monitoring network
- Synthetic, RUM, and endpoint coverage
- Strong for ISP, CDN, and DNS issues
- Custom enterprise pricing
- Less of a general APM platform
Splunk Observability Cloud suits organizations that already use Splunk for logs and security, because it lets them keep telemetry and analysis in a familiar platform. It covers infrastructure, APM, real-user monitoring, and synthetic checks with streaming analytics that surface problems quickly. Teams that value one vendor for observability and security data will find that consolidation appealing.
The catch is edition and meter complexity. Infrastructure pricing is listed from $15 per host per month billed annually, but APM, RUM, and other capabilities can add cost. New buyers should request a written breakdown by product and data volume, and confirm retention and user limits before committing.
- Real-time streaming analytics
- Full-stack observability
- Fits existing Splunk estates
- Pricing varies by edition
- Can be complex for new buyers
AppDynamics, also part of Cisco, focuses on business transactions: it maps how a user request flows through services and connects slowdowns to business impact, such as failed checkouts or delayed orders. That view helps enterprise IT teams explain performance problems in business terms, not only in server metrics. It also covers real-user monitoring alongside APM data.
Pricing is quoted, and setup is heavier than lighter SaaS tools, so it suits enterprises with dedicated operations staff. Smaller teams may prefer New Relic or Datadog for faster onboarding, while large firms with complex transaction flows gain more from AppDynamics mapping.
- Business transaction mapping
- Ties app performance to business outcomes
- Enterprise support
- Quote-based pricing
- Heavier setup than lighter tools
Nexthink focuses on digital employee experience: how staff devices, workplace apps, and virtual desktops actually perform for workers. It collects endpoint data, user sentiment, and remediation options, which helps IT teams fix slow laptops, failing VPN connections, or broken internal apps before tickets pile up. That focus is different from customer DEM, and it matters for hybrid workforces.
The limit is audience. Nexthink does not monitor public customer websites in the way Dynatrace or Datadog do, so it should be bought for employee experience, not for storefront performance. Pricing is quoted per device, so large fleets should negotiate volume terms and confirm which remediation actions are included.
- Endpoint and sentiment data
- Remediation actions
- Focus on workplace apps
- Per-device enterprise pricing
- Not a customer website tool
Riverbed Aternity covers employee experience on endpoints and virtual desktops, with views into application performance and user journeys. It suits organizations with large device fleets, call centers, or virtual desktop estates where a slow app affects hundreds of workers at once. Its history in network and endpoint monitoring gives it depth for IT teams that manage both.
Pricing is quoted per device or by edition, and deployment planning takes effort for large fleets. Buyers should confirm agent coverage for their operating systems, virtual desktop platforms, and privacy controls, since endpoint data collection needs clear employee communication and policy alignment.
- Deep endpoint data
- Virtual desktop coverage
- Customer journey views in some editions
- Quote-based pricing
- Deployment can be complex
How we picked these
We compared official product and pricing pages, plus vendor DEM guides, for real-user monitoring, synthetic testing, network visibility, and employee experience coverage. We grouped tools by the job they do best, rather than treating every observability vendor as interchangeable.
We did not invent scores or market shares, and we did not claim hands-on testing. Pricing units differ by vendor, so we list the published starting point or write See website where pricing is quoted, and readers should confirm a quote for their own hosts, data volume, or device count.
How to pick a DEM platform for your team
Name the experience first. Customer website teams need RUM, synthetic tests, and session replay. Network teams need path, BGP, and ISP visibility. Employee experience teams need endpoint agents and sentiment data. A tool that excels in one area can be weak in another, so a shortlist should match the job, not the brand name.
Run a small pilot on a real service before signing a long contract. Instrument one app or one device group, set alert thresholds, and check whether alerts point to a fixable cause. Also track ingest, host, or device counts during the pilot, because that pilot volume predicts the first real bill.
Control the bill from day one
Set data retention, sampling, and session replay masking rules before wide rollout. Decide which pages and services need full replay and which need only metrics, and review ingest weekly in the first month. Surprise bills in this category usually come from data volume, not from the base subscription.
Check privacy and retention
Session replay and endpoint data can capture sensitive text, so confirm masking, consent, retention, and regional hosting options. Ask where data is stored, who can view replays, and how long raw data is kept. Document those settings for security review before agents reach employee devices or customer browsers.
Frequently asked questions
What is the best digital experience monitoring company?
There is no single winner. Dynatrace and Datadog suit large cloud estates, New Relic suits teams that want a free start, ThousandEyes suits network visibility, and Nexthink suits employee devices.
What is digital experience monitoring?
It is the practice of measuring how people experience digital services, using real-user data, synthetic tests, network paths, and endpoint data. The goal is to find slow, broken, or frustrating experiences before users abandon a task.
How much does digital experience monitoring cost?
Costs vary by meter. Some vendors charge per host, some per gigabyte of data, and some per device, so totals depend on scale. Small pilots can start free or at a low host rate, while enterprise estates negotiate custom contracts.
What is the difference between DEM and APM?
APM focuses on application code, traces, and backend services. DEM focuses on the user experience across browsers, networks, and devices, and it often uses APM data to explain why that experience degraded.
Do I need synthetic and real-user monitoring?
Most teams benefit from both. Synthetic tests give a steady baseline from known locations, while real-user data shows what actual visitors experience across devices, networks, and regions.
Sources
See where you really rank - block by block
ProMapRanker scans Google Maps across a grid of your service area. Simple monthly plans from $19, white-label on every plan.
Start freeKeep reading
 who has best internet service
Who Has the Best Internet Service in 2026
Who has best internet service for US homes? We compare fiber, cable, fixed wireless and satellite providers on speed, price, availability and terms today.
Read → which survey tool has the best analytics
Which Survey Tool Has the Best Analytics in 2026
Find which survey tool has the best analytics in 2026, comparing Qualtrics, SurveyMonkey, Typeform, Alchemer, and more on reports, text, and stats today.
Read → which streaming service has the best movies
Which Streaming Service Has the Best Movies in 2026
Answering which streaming service has the best movies, with Netflix, Max, Criterion and more compared on libraries, prices and free options in this guide.
Read →