 ProMapRanker
Best Database Monitoring Tools in 2026


Deep database performance analysis · Pricing starts at: See website
Key takeaways
- SolarWinds Database Performance Analyzer and Redgate SQL Monitor suit teams that want deep, database-first analysis.
- Datadog, Dynatrace and New Relic suit teams that want database health inside a wider observability picture.
- Zabbix and Checkmk give capable open-source monitoring for teams willing to run the platform themselves.
- Quest Foglight and ManageEngine Applications Manager suit mid-size teams that need broad coverage without enterprise observability pricing.
- Query-level detail matters more than dashboard polish when a slow query is hurting customers.
Quick comparison
| Pick | Great for | Pricing starts at | Free tier | |
|---|---|---|---|---|
| SolarWinds Database Performance Analyzer | Deep database performance analysis | See website | Free trial | Visit |
 Datadog Database Monitoring | Database health inside full observability | See website | Free trial | Visit |
 Dynatrace | AI-assisted full-stack monitoring | See website | Free trial | Visit |
 New Relic | Unified monitoring with database views | See website | Free trial | Visit |
 Redgate SQL Monitor | SQL Server focused monitoring | See website | Free trial | Visit |
 Quest Foglight | Multi-database performance monitoring | See website | Free trial | Visit |
 Zabbix | Free open-source infrastructure monitoring | Free | Yes | Visit |
 Checkmk | Configurable open-source monitoring | Free | Yes | Visit |
 ManageEngine Applications Manager | Mid-size application and database monitoring | See website | Free trial | Visit |
The best database monitoring tools
Database monitoring tools watch query performance, wait times, locks, storage and connections, and alert teams before a slow database becomes an outage. The best database monitoring tool for a team depends on which databases it runs, whether it wants database-only depth or full-stack context, and how much it can spend. This list covers both shapes, plus open-source options for teams with engineering time.
SolarWinds Database Performance Analyzer
Great for: Deep database performance analysis
SolarWinds Database Performance Analyzer, often called DPA, focuses on why a database is slow rather than simply reporting that it is slow. Wait-time analysis, query plans and blocking detail help a database administrator find the exact query or resource contention behind a problem. Support spans major platforms including SQL Server, Oracle, MySQL, PostgreSQL and others, which suits mixed estates.
DPA is a specialist tool, and its interface assumes database knowledge. Teams without a dedicated database administrator may find the depth overwhelming at first, and pricing requires a quote. For teams whose core pain is database performance, that depth is exactly the point.
- Detailed wait-time and query analysis
- Supports many database platforms
- Expert tuning advice
- Quote-based pricing
- Interface rewards experienced database administrators
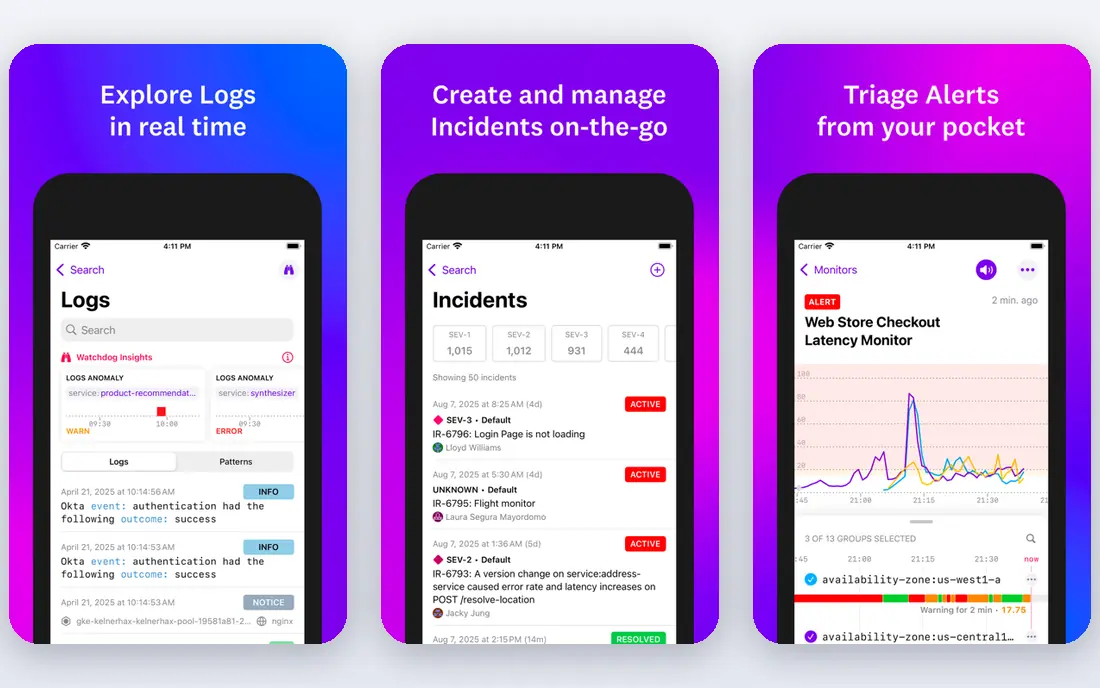
Datadog Database Monitoring suits teams already using Datadog for infrastructure and applications. Database query performance, samples and explain plans appear beside the application traces that called them, which shortens the path from a slow page to a slow query. Alerting and dashboards follow the same model as the rest of the platform.
Pricing is usage-based, so costs need modelling at real data volumes, and teams should check depth for their specific database platform. For a team standardised on Datadog, the context wins. For a database-only team, a specialist tool may give more depth for less money.
- Database metrics beside logs, traces and infrastructure
- Query samples and explain plans
- Strong alerting
- Usage-based pricing can grow quickly
- Database depth varies by platform
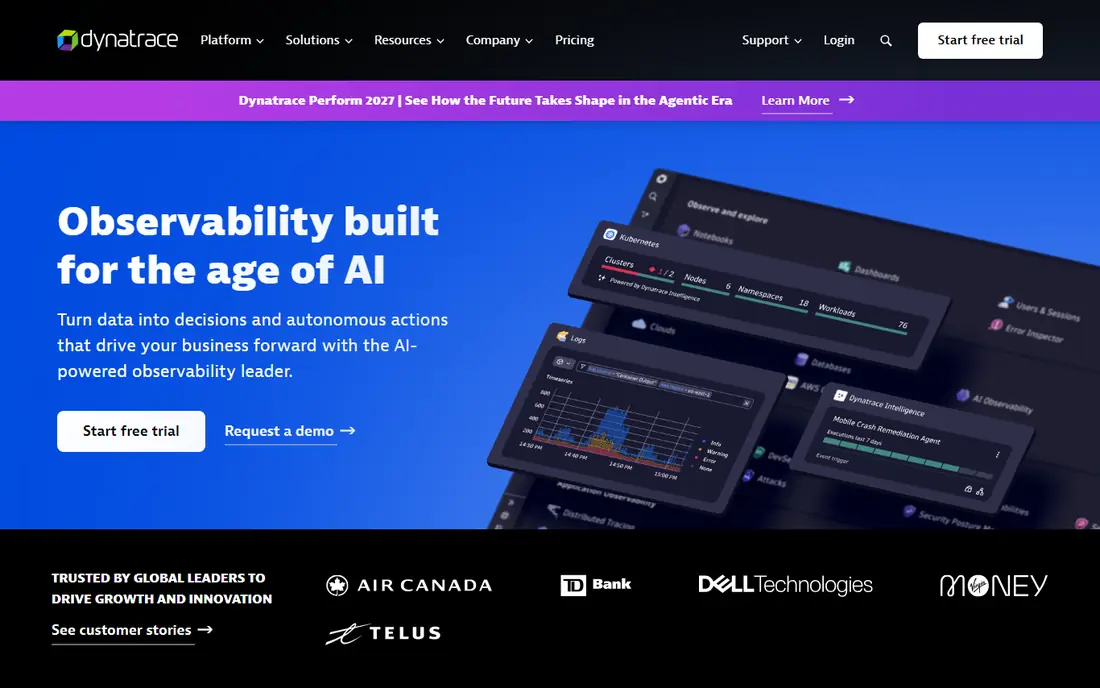
Dynatrace monitors databases as part of a full-stack picture, with automatic discovery of services and dependencies. When a database slows down, its analysis links the problem to affected services and transactions, which helps teams prioritise fixes by customer impact. That context is valuable in complex, distributed systems.
Dynatrace is priced as an enterprise platform, and smaller teams may find it more than they need. Configuration and cost management also take attention as environments grow. Large teams with many services and databases get the most from its automation and analysis.
- Automatic discovery and dependency mapping
- AI-assisted root-cause analysis
- Broad platform coverage
- Enterprise pricing model
- Learning curve for full configuration
New Relic places database performance inside application monitoring, so a team can trace a slow transaction from user request to database query. Its query language lets teams explore metrics and events flexibly, and a free tier helps small teams start without a purchase. That combination suits product teams that own both app and database.
Specialist database advice is thinner here than in DPA or Redgate, so dedicated database teams may still want a specialist alongside New Relic. Usage-based pricing also needs care as data volumes grow. For teams that want one observability home, New Relic is a strong candidate.
- Database performance beside application performance
- Flexible querying
- Free tier for getting started
- Usage costs need watching at scale
- Database-specific tuning advice is thinner than specialists
Redgate SQL Monitor is built around SQL Server, and that focus shows in its detail. Alerting, blocking, deadlocks, backups and estate-wide health appear in views designed for SQL Server administrators, with context that helps a team act without digging through raw metrics. Teams running many SQL Server instances get a clear overview of the whole estate.
The trade-off is scope. Organisations running mostly PostgreSQL, MySQL or Oracle will get more from a multi-platform tool. SQL Server shops, though, often find Redgate's depth and clarity worth the specialist price, especially when uptime and query performance drive revenue.
- Deep SQL Server insight
- Clear alerts with context
- Good estate overview for many servers
- Focus is SQL Server first
- Pricing is quote-based for larger estates
Quest Foglight monitors performance across SQL Server, Oracle, MySQL, PostgreSQL and other platforms, with workload analysis that points to the queries and resources causing trouble. It suits teams with mixed databases that want one monitoring home rather than a separate tool per platform. Cloud and on-premises databases both fit the model.
Foglight is an enterprise tool, so pricing is quote-based and large deployments need planning. Smaller teams may prefer a simpler or open-source option. Mixed-database teams with a dedicated database function will appreciate the breadth and tuning guidance.
- Covers many database platforms
- Workload analysis and tuning advice
- On-premises and cloud databases
- Quote-based pricing
- Deployment takes planning for large estates
Zabbix is a free, open-source monitoring platform that covers servers, networks and databases through templates and agents. It suits teams that want full control and no per-host licence cost, and its alerting and visualisation options are flexible. Database monitoring arrives through templates for common platforms, which teams can extend.
The cost is operational. A team owns installation, upgrades, template tuning and alert management, and database-specific insight takes more setup than a specialist tool provides out of the box. For teams with monitoring skills and a tight budget, Zabbix is a capable foundation.
- Free open-source software
- Flexible templates and alerting
- Large community
- Team must host and maintain it
- Database-specific analysis needs template work
Checkmk offers a free raw edition alongside paid editions, with automatic discovery of hosts and services and a large check catalogue. Database monitoring fits inside a wider infrastructure view, with configurable thresholds and alerting. Teams that like to tune monitoring precisely will appreciate the control.
Paid editions add features such as advanced reporting and support, so buyers should compare editions before assuming the free version covers everything. Setup also rewards experience, since powerful configuration can grow complex. For teams that want open-source flexibility with a clear upgrade path, Checkmk is a strong pick.
- Free raw edition available
- Strong auto-discovery
- Highly configurable checks and alerts
- Paid editions add features teams may want
- Setup rewards monitoring experience
ManageEngine Applications Manager
Great for: Mid-size application and database monitoring
ManageEngine Applications Manager monitors applications and their databases together, which helps mid-size teams trace a slow application to its database without buying a full observability suite. Support covers common database platforms, and the interface stays approachable for teams without a dedicated observability engineer. A free trial lets teams test it against real workloads.
Depth varies by platform, and teams needing the deepest query analysis may still want a specialist. For mid-size teams that want solid application and database coverage at a manageable price, Applications Manager balances breadth, clarity and cost well.
- Application and database monitoring together
- Broad database support
- Approachable pricing model
- Depth varies by database platform
- Enterprise observability features are thinner
How we picked these
We compared official product and pricing pages, documentation and public reviews, and kept only tools that exist and work in October 2026 and truly monitor databases. We included database specialists, full-stack observability platforms and open-source options, because buyers choose across those categories. Where vendors do not publish pricing, we wrote See website rather than estimating.
Choosing database monitoring by database type
Start with the databases you actually run. A SQL Server estate points toward Redgate or DPA, a mixed estate points toward Foglight or a full-stack platform, and a small open-source estate may run well on Zabbix or Checkmk. Check template or agent support for your exact database versions, since a tool that supports a platform in general may lag on a new release.
Next, test alert quality. A good tool alerts on query regressions, blocking and storage pressure with enough context to act, and stays quiet during normal variation. Noisy alerts get ignored, which defeats the purpose. Run a trial against a staging database, introduce a slow query, and see how clearly the tool explains it.
Finally, watch cost drivers. Per-host, per-database and usage-based pricing behave very differently as estates grow, and observability bills can surprise teams that only modelled the entry tier. Model costs at your current size and at double that size, and confirm retention periods for query samples and metrics before signing.
Frequently asked questions
What is the best database monitoring software for small teams?
Zabbix and Checkmk suit small teams with monitoring skills and tight budgets, since both offer free editions. New Relic also suits small product teams through its free tier. Choose open source when engineering time is available, and a managed platform when it is not.
What is the best database monitoring tool for SQL Server?
Redgate SQL Monitor and SolarWinds Database Performance Analyzer lead for SQL Server depth, with Foglight strong for mixed estates that include SQL Server. Redgate suits SQL Server-first shops, while DPA suits teams that also run other platforms.
How much does database monitoring software cost?
Open-source tools are free apart from hosting and staff time, while commercial tools here are mostly quote-based or usage-based. Always model cost at your database count and data volume, since entry prices rarely reflect a full estate. Trials with real workloads give the clearest cost picture.
Does database monitoring replace a database administrator?
No, monitoring surfaces problems and evidence, but tuning, index design and capacity decisions still need database expertise. Monitoring makes a good administrator faster and a team more proactive. It does not turn a dashboard into a database strategy on its own.
What should database monitoring alert on?
Alert on slow and regressing queries, blocking and deadlocks, connection exhaustion, replication lag and storage pressure. Include enough query context to act without a second investigation. Tune thresholds per database, since one threshold rarely fits production and reporting systems alike.
Is Datadog or a specialist tool better for databases?
Datadog suits teams that want database health beside application and infrastructure data in one platform. A specialist such as DPA or Redgate suits teams whose main problem is database performance itself. Many larger teams use both, with the specialist for deep tuning and the platform for incident context.
Sources
See where you really rank - block by block
ProMapRanker scans Google Maps across a grid of your service area. Simple monthly plans from $19, white-label on every plan.
Start freeKeep reading
 who has best internet service
Who Has the Best Internet Service in 2026
Who has best internet service for US homes? We compare fiber, cable, fixed wireless and satellite providers on speed, price, availability and terms today.
Read → which survey tool has the best analytics
Which Survey Tool Has the Best Analytics in 2026
Find which survey tool has the best analytics in 2026, comparing Qualtrics, SurveyMonkey, Typeform, Alchemer, and more on reports, text, and stats today.
Read → which streaming service has the best movies
Which Streaming Service Has the Best Movies in 2026
Answering which streaming service has the best movies, with Netflix, Max, Criterion and more compared on libraries, prices and free options in this guide.
Read →