 ProMapRanker
Best Data and Reporting Tools in 2026

Key takeaways
- Power BI and Tableau remain the main enterprise choices, with Power BI cheaper for Microsoft-centred teams.
- Looker Studio is the best free starting point, especially for teams already using Google Analytics and Sheets.
- Metabase suits SQL-friendly teams that want self-hosted control or a simple cloud plan.
- Zoho Analytics and ThoughtSpot help non-technical users ask questions without waiting for analysts.
- Check viewer licence costs early, since most users only view reports and should not need creator licences.
Quick comparison
| Pick | Great for | Pricing starts at | Free tier | |
|---|---|---|---|---|
 Tableau | Advanced visualisation | $15 per user per month | Free trial | Visit |
 Microsoft Power BI | Microsoft ecosystem | $14 per user per month | Free trial | Visit |
 Looker Studio | Free Google dashboards | Free | Yes | Visit |
 Metabase | SQL-friendly self-serve | Free | Yes | Visit |
 Qlik Sense | Associative analytics | $30 per user per month | Free trial | Visit |
 ThoughtSpot | Search-driven analytics | $25 per user per month | Free trial | Visit |
 Zoho Analytics | Non-technical teams | $24 per month | Free trial | Visit |
 Domo | Executive dashboards | See website | Free trial | Visit |
The best data and reporting tools
The best data reporting tools turn raw numbers into dashboards and scheduled reports that managers can trust. The options below cover free tools, enterprise platforms, and self-serve analytics for different team sizes.
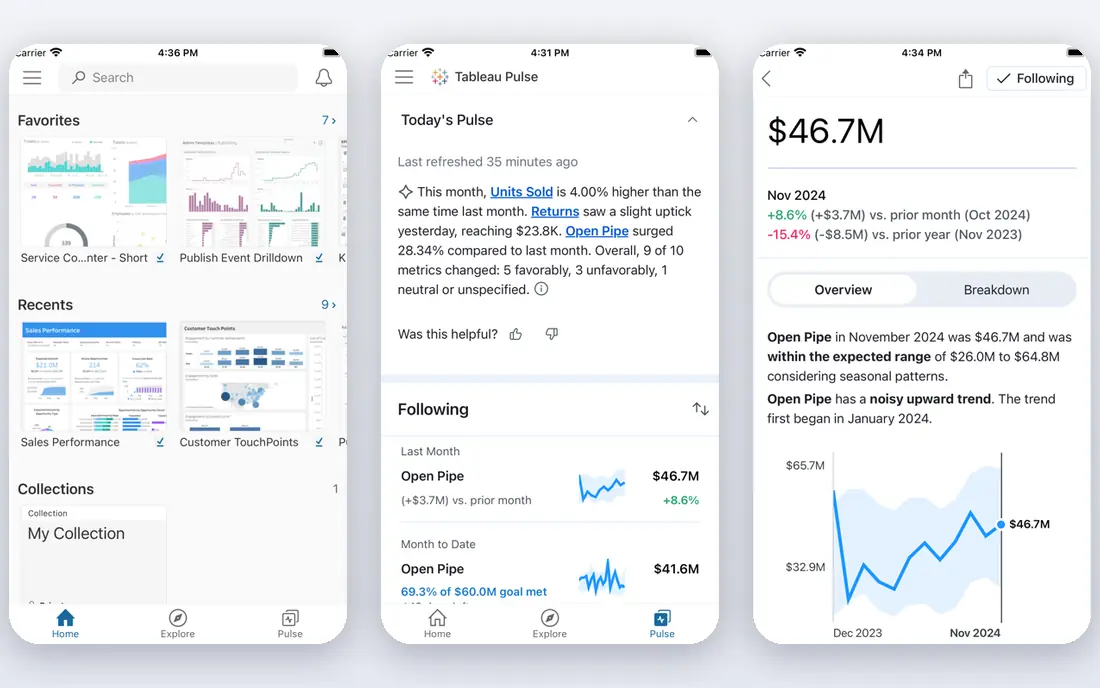
Tableau, now part of Salesforce, remains a leader for teams that need rich, interactive dashboards. Visual exploration is flexible, and the platform handles large and complex datasets with care. Analysts can build detailed views, filters, and drill-downs that go beyond simple charts. The community and training material also help new users learn faster.
Cost needs planning. Viewer licences start low, but Creator licences for people who build dashboards cost far more, so audit who truly builds versus views. Implementation can take weeks for larger deployments. For dashboard-heavy teams with skilled analysts, Tableau is still a top-tier choice.
- Deep visualisation options
- Handles large datasets well
- Strong community and learning resources
- Creator licences cost much more than viewer licences
- Learning curve for new analysts
Power BI suits organisations already using Microsoft tools. Desktop is free for building reports, and Pro licences add sharing, scheduled refresh, and collaboration. Integration with Excel, Teams, SharePoint, and Azure makes adoption easier for Microsoft-centred teams. Data modelling is strong, with a formula language that analysts learn over time.
Sharing rules catch some teams out. Viewers often need Pro licences too, unless Premium capacity covers sharing, and Premium adds significant cost. Still, for the price, Power BI offers the best value in enterprise reporting for most Microsoft shops. Start with Pro, and move to Premium only when sharing needs demand it.
- Low entry price for Pro users
- Deep Excel, Teams, and Azure integration
- Strong data modelling
- Sharing needs Pro licences for viewers
- Premium capacity adds cost at scale
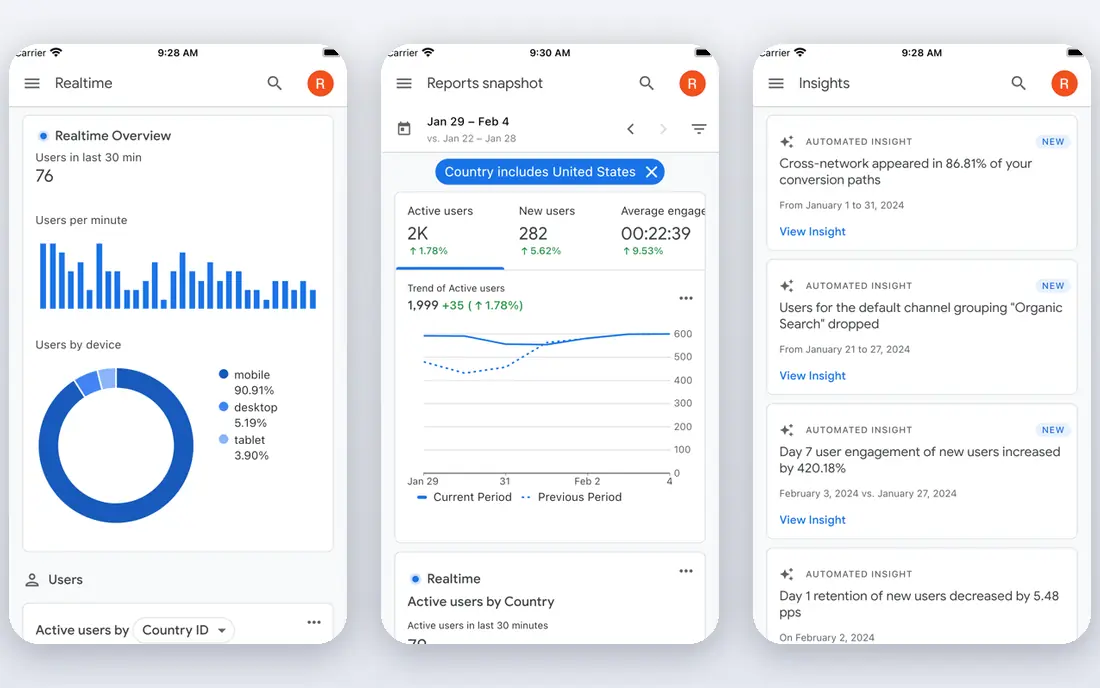
Looker Studio, formerly Google Data Studio, is the best free reporting tool for many small teams. It connects easily to Google Analytics, Google Ads, Sheets, and BigQuery, and sharing works like sharing a document. Departments can build useful dashboards in a day or two without a licence budget. For marketing and web reporting, that speed matters.
Governance is thinner than in enterprise tools. Metric definitions can drift across reports, and there is less control over who changes a shared dashboard. Performance also depends on the source, especially with large BigQuery queries. For low-cost departmental reporting, Looker Studio is an excellent starting point.
- Free to use
- Easy sharing like a Google Doc
- Strong Google data connectors
- Weaker governance and metric control
- Performance depends on source data
Metabase appeals to technical teams that want reporting without enterprise pricing. The open source version can be self-hosted for free, with unlimited users, while cloud plans add hosting and support. SQL users can write queries directly, and non-technical users can use a visual query builder for simpler questions. Dashboards are clean and quick to build.
Self-hosting trades licence cost for maintenance time, including updates, backups, and performance tuning. Advanced permissions and governance features sit on paid tiers. For startups and SQL-friendly teams, Metabase offers a practical balance of cost, control, and ease of use.
- Free self-hosted open source version
- Easy for SQL users
- Simple cloud plans
- Self-hosting needs maintenance
- Advanced governance sits on higher tiers
Qlik Sense uses an associative engine, which lets users explore data freely and see how selections affect related values. That approach suits analysts and managers who want to investigate, not just view a fixed report. Data preparation tools help clean and combine sources before building dashboards. The platform scales from departmental use to enterprise deployments.
Learning takes time, since the associative model differs from standard dashboard tools. Pricing also varies by plan and deployment, so confirm the cost at your user count. For teams that value exploration over static reports, Qlik Sense is a distinctive and capable choice.
- Associative engine shows related data clearly
- Strong data preparation
- Good for guided exploration
- Interface takes learning
- Pricing varies by deployment and user type
ThoughtSpot lets business users type questions in plain language and get charts back, rather than waiting for an analyst to build each report. That self-serve model suits organisations with many recurring questions and a small analytics team. AI features suggest related questions and highlight changes in data. The interface feels closer to search than to a traditional BI tool.
Good results depend on well-modelled, trusted data underneath. Without clean metric definitions, search answers can mislead. Pricing also grows with users, so plan for viewer costs across the business. For search-driven reporting, ThoughtSpot is a strong modern option.
- Search-style questions in plain language
- AI-assisted insights
- Self-serve for business users
- Needs well-modelled data to work well
- Cost rises with users and features
Zoho Analytics is the friendliest tool in this list for non-technical teams. Dashboards build quickly, connectors cover common business apps, and an AI assistant answers plain-language questions about the data. Small businesses get a usable reporting system without hiring a BI specialist. Pricing starts at a modest monthly figure for a small team.
Enterprise teams with complex modelling needs may find it thinner than Power BI or Tableau. Performance and governance at very large scale also favour the enterprise platforms. For small and mid-size businesses that want reports without a steep learning curve, Zoho Analytics is a smart pick.
- Easy for non-technical users
- AI question answering
- Many built-in connectors
- Less suited to very large enterprise deployments
- Advanced modelling thinner than Power BI
Domo targets executives and managers who need a clear, current view of the business. Dashboards combine data from many sources, with alerts when metrics change. Mobile access is strong, so leaders can check key numbers away from their desks. Connector coverage helps teams that pull data from sales, marketing, and finance systems at once.
Pricing is quote-based, which makes budgeting harder without a sales conversation. Implementation also takes planning for larger data estates. Domo fits mid-size to large organisations that want polished executive reporting and can justify enterprise pricing.
- Executive-ready dashboards
- Data connectors and alerts
- Mobile-friendly reporting
- Quote-based pricing
- Implementation can take time
- Cost suits larger teams
How we picked these
We compared vendor pricing pages, feature lists, and independent BI comparisons in October 2026, and we kept only live reporting tools with clear dashboard and sharing features. We favoured tools that cover real reporting work, such as scheduled refresh, sharing, and drill-down, rather than chart-only builders. Where pricing varies by user type, we used the published viewer or entry figure and noted the difference.
Choosing the right reporting tool
Start with who will build reports and who will only view them. That split drives most of the cost and most of the frustration.
Builders, viewers, and self-serve users
Count builders separately from viewers. Most staff only view dashboards, so viewer licences should cover them. Self-serve users need a tool they can question directly, such as ThoughtSpot or Zoho Analytics, while builders need modelling depth from Power BI, Tableau, or Qlik Sense. Buying creator licences for everyone wastes money fast.
Data sources and refresh needs
Connect your real sources during a trial, not demo data. Check refresh frequency, since Power BI Pro refreshes a set number of times per day and other tools vary. Test a dashboard with your largest dataset, since load times on small samples hide performance problems. If a dashboard takes too long to load, people will stop using it.
Governance and total cost
Agree metric definitions before building dozens of dashboards, or teams will argue about numbers instead of acting on them. Assign an owner to each dashboard and review unused reports each quarter. Finally, calculate three-year cost, including licences for all user types, training, and implementation, not just the entry price.
Frequently asked questions
What are the best data reporting tools for small businesses?
Looker Studio is best for free reporting, especially for Google data, while Zoho Analytics and Metabase suit small teams that need more structure. Power BI Pro also works well at a low per-user price for Microsoft users. Start free or low-cost, and upgrade only when sharing, governance, or data volume demands it.
What is the best data and reporting tool for enterprises?
Power BI and Tableau lead for enterprises, with Power BI offering better value for Microsoft shops and Tableau offering deeper visualisation. Domo suits executive reporting, while Qlik Sense suits exploratory analytics. The right pick depends on your existing stack, analyst skills, and viewer count.
Is Looker Studio really free?
Yes, Looker Studio itself is free to use, with no user limits on the core product. You may still pay for underlying data sources, such as BigQuery usage, and for connectors from third parties. For most small teams using Google Analytics and Sheets, the reporting layer itself costs nothing.
How do I choose between Tableau and Power BI?
Choose Power BI if your team already uses Microsoft tools and wants lower entry cost. Choose Tableau if visualisation depth and exploration matter most and your analysts have the skills to use it. Trial both with the same dataset and the same business question, since that test reveals workflow differences faster than feature lists.
What is the difference between BI tools and reporting tools?
Reporting tools focus on scheduled reports and dashboards that present known metrics. BI tools add exploration, modelling, and self-serve analysis on top of reporting. Most tools in this list do both, but ThoughtSpot and Qlik Sense lean toward exploration, while Looker Studio and Domo lean toward clear, shareable reporting.
Sources
See where you really rank - block by block
ProMapRanker scans Google Maps across a grid of your service area. Simple monthly plans from $19, white-label on every plan.
Start freeKeep reading
 github alternatives
Best GitHub Alternatives in 2026
Explore the best GitHub alternatives in 2026, from GitLab and Bitbucket to self-hosted Gitea and Forgejo, with prices and trade-offs for developers for readers.
Read → cineby alternatives
Cineby Alternatives in 2026
We compared legal cineby alternatives for licensed streaming, including Netflix, Hulu, Disney Plus, and free options, so you can watch without piracy sites.
Read → best visibility analysis software
Best Visibility Analysis Software in 2026
Compare the best visibility analysis software for search and AI answers. We review 8 tools that track brand mentions, citations, and rankings Updated for 2026.
Read →