 ProMapRanker
Best Customer Journey Analytics Software in 2026

Key takeaways
- Mixpanel and Amplitude are the strongest choices for product teams that need funnels, retention and journey analysis from event data.
- Heap and PostHog help teams that want to analyse past behaviour without tagging every event in advance, though their pricing models differ.
- Fullstory and Hotjar add the visual side of the journey, with session replay and heatmaps that explain why users drop off.
- Google Analytics remains a useful free baseline, but it does not replace a product analytics tool for detailed journey work.
Quick comparison
| Pick | Great for | Pricing starts at | Free tier | |
|---|---|---|---|---|
 Mixpanel | Product funnels and retention | See website | Yes | Visit |
 Amplitude | Journey and cohort analysis at scale | See website | Yes | Visit |
 Heap | Retroactive analysis without manual tagging | See website | Yes | Visit |
 Fullstory | Session replay and friction analysis | See website | Free trial | Visit |
 PostHog | Open source product analytics | See website | Yes | Visit |
 Pendo | Product analytics plus in-app guidance | See website | Free trial | Visit |
 Hotjar | Heatmaps, recordings and surveys | $39 per month | Yes | Visit |
 Google Analytics | Free baseline web analytics | Free | Yes | Visit |
The best customer journey analytics software
We compared these tools on journey mapping, funnel and retention analysis, session replay, ease of setup, and pricing clarity. Our pick for most product teams is Mixpanel, while Amplitude suits larger teams that need deeper cohort work, and PostHog suits engineering-led teams that want control.
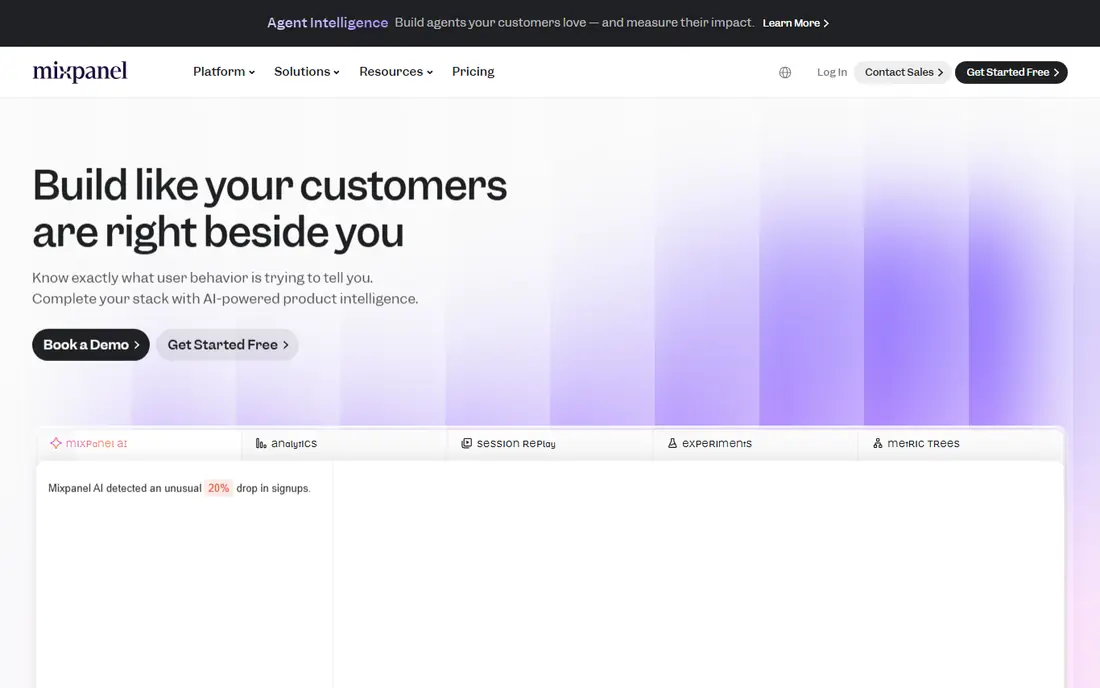
Mixpanel is built around events. When a user signs up, completes onboarding, uses a key feature or cancels, each step becomes an event you can follow through a funnel. That model makes it easy to see where a journey breaks, which steps correlate with retention, and which cohorts return after thirty days. Product and growth teams will find the reports fast and easy to explore without waiting for an analyst.
The main cost driver is event volume. A free plan helps a small product start, but a growing product with many events will move to a paid plan, and the bill needs modelling against monthly active users. Mixpanel also works best when the team agrees on event names early. Without that discipline, reports become messy, no matter how good the tool is.
- Fast self-serve funnel and retention reports
- Strong for product-led growth teams
- Free plan for getting started
- Pricing rises with event volume
- Advanced features need a paid plan
- Setup still needs a clear event plan
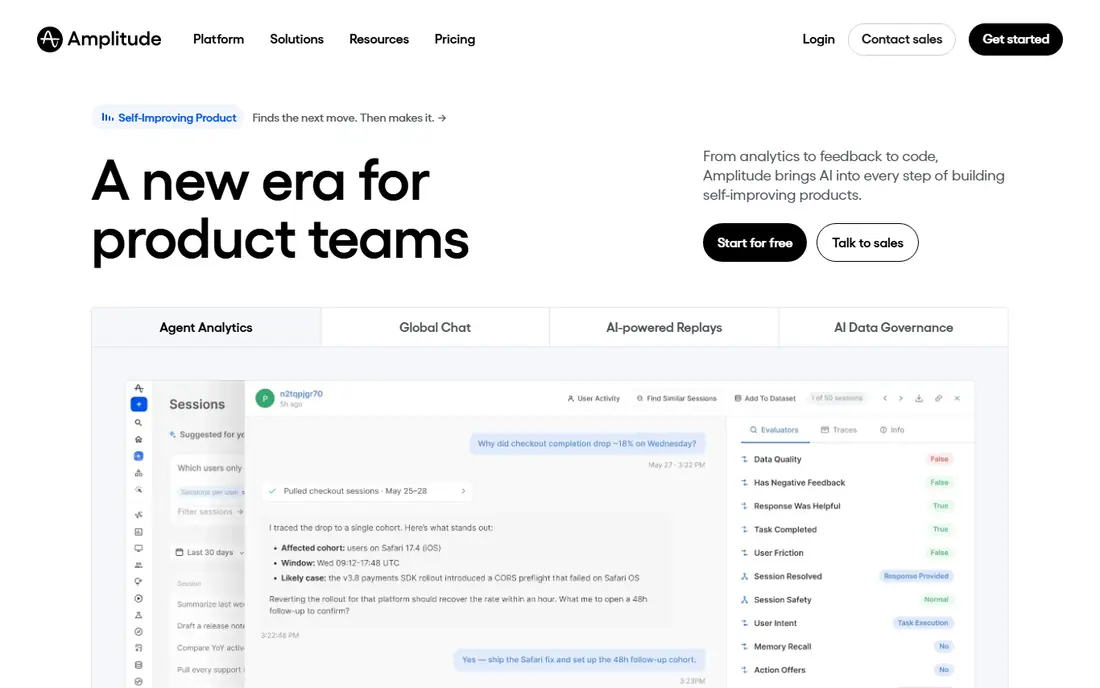
Amplitude goes deeper than a simple funnel tool. Its journey analysis can follow users across many steps, compare cohorts by behaviour, and show which paths lead to long-term retention. For a larger product team, that depth helps answer harder questions, such as which onboarding path works best for each segment, or which feature use predicts renewal.
That depth comes with complexity. New analysts need time to learn the query model, and pricing at scale is quote based in many cases. A small team with one product and a simple funnel may find Mixpanel simpler. A team with several products, large event volumes and a need for governance will find Amplitude's extra depth worth the learning time.
- Deep journey and cohort analysis
- Experimentation and predictive features in higher tiers
- Strong data governance options
- Pricing is complex at scale
- Learning curve for new analysts
- Smaller teams may not use its full depth
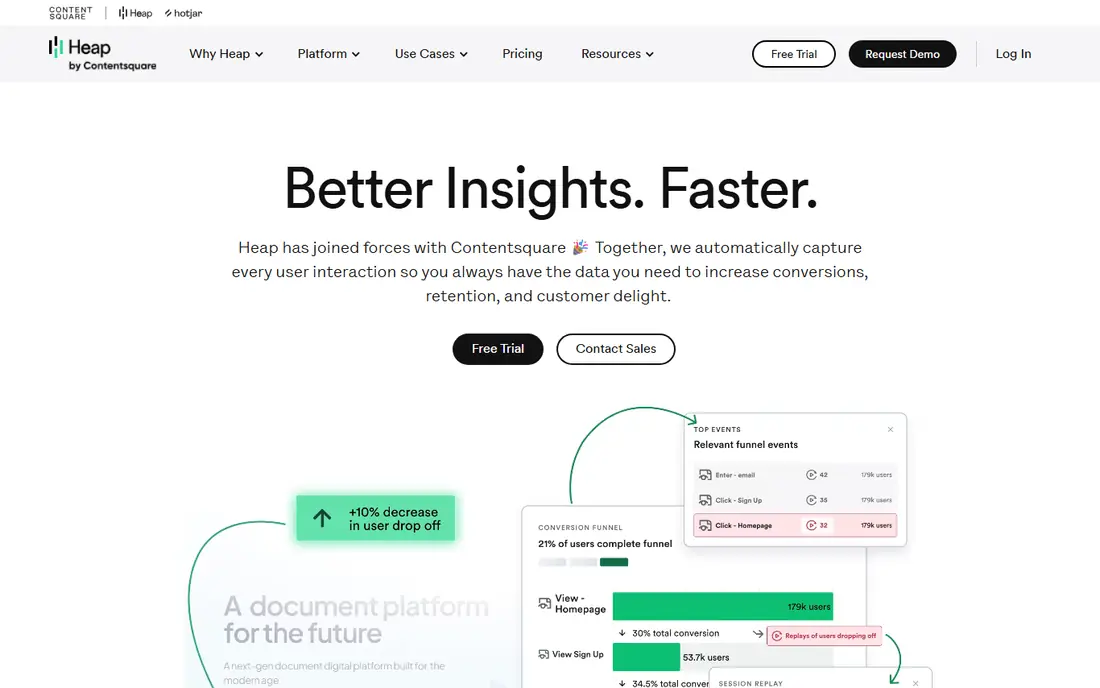
Heap solves a common problem: teams realise too late that they did not tag an event they now need. Because Heap captures interactions automatically, you can define an event after the fact and analyse past behaviour, rather than waiting weeks for new data. That feature alone can save a product team from a costly blind spot during a launch or a redesign.
The catch is that autocapture collects a lot of data, and pricing for larger volumes is set by quote. Teams should also keep a data retention and privacy plan, since automatic capture can collect more than intended if forms and sensitive fields are not excluded. Used with care, Heap is one of the most forgiving analytics tools for teams that move fast.
- Autocapture collects clicks, taps and page views automatically
- Retroactive analysis of past behaviour
- Less upfront tagging work
- Pricing is quote based for larger use
- Data volume can grow quickly
- Analysis still needs a clear question to be useful
Fullstory answers a different question from Mixpanel. Instead of asking how many users dropped off at checkout, it shows what those users actually saw and did. Session replay, combined with frustration signals, helps a UX team spot a broken form field, a confusing error message or a slow page that numbers alone would not explain. That visual evidence often settles debates about a redesign faster than a report.
Fullstory is not a standalone replacement for funnel analytics, and it is priced for teams that will use replay regularly. Pair it with Mixpanel, Amplitude or PostHog for numbers, and use Fullstory when you need to understand why the numbers look that way. For UX-led teams, that pairing is often the best setup.
- High-quality session replay
- Frustration signals such as rage clicks
- Useful for diagnosing drop-offs
- Strong for UX teams
- Enterprise pricing on request
- Not a full replacement for event analytics
- Session volume affects cost
PostHog is the most flexible option here for an engineering-led team. It combines product analytics, session replay, feature flags and experimentation in one open source platform, and it can be self-hosted for teams with strict data control needs. That breadth means a small team can replace several tools with one system, and keep data inside its own infrastructure if needed.
The trade-off is effort. PostHog rewards teams that are comfortable with code, deployment and data modelling, and it is less immediately friendly for a non-technical product manager than Mixpanel. Self-hosting also adds maintenance, updates and security work. For a team that values control and open source, those costs are acceptable. For a team that wants a tool live in an afternoon, a hosted rival will be faster.
- Product analytics, session replay and feature flags in one platform
- Self-hosting option
- Usage-based pricing with a free tier
- Setup needs more engineering time
- Interface is less polished for non-technical users
- Self-hosting adds maintenance work
Pendo stands out because it does not stop at analysis. Once you see where users struggle in a journey, you can add an in-app guide, a tooltip or a survey inside the product, and then measure whether adoption improves. That loop from insight to action is valuable for onboarding, feature adoption and customer success, where a guide at the right moment can change behaviour.
The limit is that Pendo's analytics, while strong, may not match Amplitude's depth for complex cohort work, and pricing is set by quote. It also needs design and product input to make guides effective, not just an analytics setup. For enterprise product teams that want analytics and guidance in one place, Pendo is a strong choice.
- Analytics combined with in-app guides and surveys
- Useful for onboarding and adoption
- Strong for enterprise product teams
- Pricing is quote based
- Analytics depth is less than Amplitude for some teams
- Setup needs product and design input
Hotjar is the simplest visual tool on this list, and that simplicity is its strength. Heatmaps show where visitors click, scroll and linger, recordings show individual sessions, and surveys collect feedback at the point of experience. For a marketing or UX team working on a website, Hotjar can be live in an afternoon and can surface friction that a funnel report would miss.
It is not a full product analytics platform. Complex multi-step journeys across a web app, mobile app and email are better handled by Mixpanel or Amplitude. Hotjar also limits sessions on lower plans, so a high-traffic site needs a higher tier. Used as a visual companion to a main analytics tool, it is excellent value.
- Simple heatmaps and session recordings
- Built-in surveys and feedback
- Easy setup for websites
- Free plan for small sites
- Less suited to complex product funnel analysis
- Session limits on lower plans
- Now part of Contentsquare, so plans may change
Google Analytics, in its GA4 form, remains the baseline for web analytics. It tracks traffic sources, page views, conversions and basic user paths at no cost, and it integrates with Google Ads and Search Console. For a small site or a team just starting with journey analysis, it gives a useful picture without a new budget line.
The limits matter for product teams. GA4 is built for web traffic and marketing attribution, not for detailed in-product journeys, retention cohorts or session replay. Privacy rules also require careful consent and data settings, especially in Europe. Use Google Analytics as a free baseline, and add a product analytics tool when you need to follow users through a product journey in detail.
- Free for most sites
- Wide integration with Google tools
- Useful baseline for traffic and conversions
- Familiar to many marketers
- Less detailed for product journeys than dedicated tools
- Privacy and consent setup needs care
- Enterprise GA360 is a separate paid tier
How we picked these
We compared official product pages, pricing pages and public reviews, and we kept only tools that exist and work in October 2026 and that truly fit customer journey analytics, whether through event funnels, journey mapping, session replay or heatmaps. We favoured tools that let a team follow a user from first visit to retention, and we mixed free, usage-based and enterprise options so the list covers small sites and large product teams. Prices that could not be verified from a vendor page are listed as See website.
How to set up journey analytics well
Start with the journey you care about, not with the tool's full feature list. Write down the five steps from first visit to a retained customer, and define the event for each step in plain language. Agree on event names with product, marketing and engineering before you implement anything. A shared naming plan prevents the most common analytics failure, which is a report that no one trusts because events were named differently by different teams.
Next, combine numbers with visual evidence. Use funnel and retention reports to find where users drop off, then use session replay or heatmaps to see what those users experienced. That pairing turns a drop-off rate into a fixable problem, such as a form error, a slow load or a confusing step. Review the top three drop-offs each month, fix one, and measure the change before moving on.
Finally, handle privacy from the start. Exclude sensitive form fields from capture, set data retention limits, and check consent requirements for your markets. A journey tool that captures too much can create legal risk and damage trust. Document what you capture, why you capture it, and who can access it, and review that document when you add a new tool or a new event.
Frequently asked questions
What is customer journey analytics software?
Customer journey analytics software follows users across steps, from first visit through sign-up, purchase and retention, and shows where they continue and where they drop off. It uses events, funnels, cohorts and sometimes session replay to explain behaviour. The goal is to find friction and fix it, not just to count page views.
Is Mixpanel or Amplitude better for journey analysis?
Mixpanel is often simpler and faster for funnel and retention work, while Amplitude offers deeper journey and cohort analysis at scale. A small or mid-size product team will usually find Mixpanel enough. A larger team with several products and complex segments will get more from Amplitude, if it can invest the learning time.
Do I need session replay as well as funnel analytics?
Session replay helps when numbers show a problem but do not explain it. A funnel can show that users leave at checkout, while replay can show a broken field or a confusing error. Many teams use both, with funnel analytics for measurement and replay for diagnosis. Hotjar and Fullstory are good visual companions to a main analytics tool.
Can I analyse journeys without tagging every event in advance?
Yes, with autocapture tools such as Heap, which collect interactions automatically and let you define events from past data. PostHog also offers flexible capture, though it needs more setup. Autocapture still needs a privacy plan, since it can collect more data than a manual tagging plan would.
Is Google Analytics enough for customer journey analytics?
Google Analytics is enough for basic web traffic, source attribution and simple conversions, and it is free. It is less suited to detailed product journeys, retention cohorts and in-product behaviour. Add a product analytics tool when you need to follow users through a product in detail, rather than just through a website.
How much does customer journey analytics software cost?
Costs range from free for Google Analytics and free tiers on several tools, to quote-based enterprise pricing for Amplitude, Fullstory and Pendo. Usage-based tools such as PostHog charge by event or session volume, so the bill grows with traffic. Model your monthly event volume before choosing, and check the free tier limits.
Sources
See where you really rank - block by block
ProMapRanker scans Google Maps across a grid of your service area. Simple monthly plans from $19, white-label on every plan.
Start freeKeep reading
 best tour operator software
Best Tour Operator Software in 2026
Compare the best tour operator software for bookings, channel management, waivers and payments, with pricing models for day tours and multi-day trips.
Read → best time clock app for small business
Best Time Clock App for Small Business in 2026
We compare the best time clock app for small business options, with free plans, GPS clock ins, scheduling and payroll links for hourly teams and payroll help.
Read → best test automation tools
Best Test Automation Tools in 2026
Compare the best test automation tools, from Playwright and Selenium to Cypress, Katalon and BrowserStack, with prices, languages and best uses explained.
Read →