 ProMapRanker
Best Crypto Charting Software in 2026


All-round crypto charting · Pricing starts at: $14.95 per month
Key takeaways
- TradingView is the most complete charting pick for most users, with a free plan and a large indicator and script library.
- Coinigy fits traders who hold coins across many exchanges and want one portfolio and chart view.
- GoCharting and DexScreener cover different ends of the market: GoCharting for indicator-heavy analysis, DexScreener for fast token discovery.
- Free plans are real here, but indicator counts, alert limits, and historical data rise sharply on paid tiers.
- This article is general information only, not financial advice, and crypto trading carries risk, including loss of capital.
Quick comparison
| Pick | Great for | Pricing starts at | Free tier | |
|---|---|---|---|---|
| TradingView | All-round crypto charting | $14.95 per month | Yes | Visit |
 Coinigy | Multi-exchange trading and tracking | $18.66 per month | Free trial | Visit |
 GoCharting | Indicator-heavy technical analysis | $20 per month | Yes | Visit |
 Cryptowatch | Clean exchange charts | See website | Yes | Visit |
 DexScreener | New token discovery | Free | Yes | Visit |
 CoinGlass | Derivatives and market data | See website | Yes | Visit |
 TrendSpider | Automated chart analysis | See website | Free trial | Visit |
 Bookmap | Order book and order flow | See website | Free trial | Visit |
The best crypto charting software
Crypto charting software turns price history into readable charts, indicators, and alerts. The best choice depends on how you trade: a long-term holder needs clean charts and alerts, a multi-exchange trader needs one view across venues, and a derivatives trader needs order book and liquidation data alongside price.
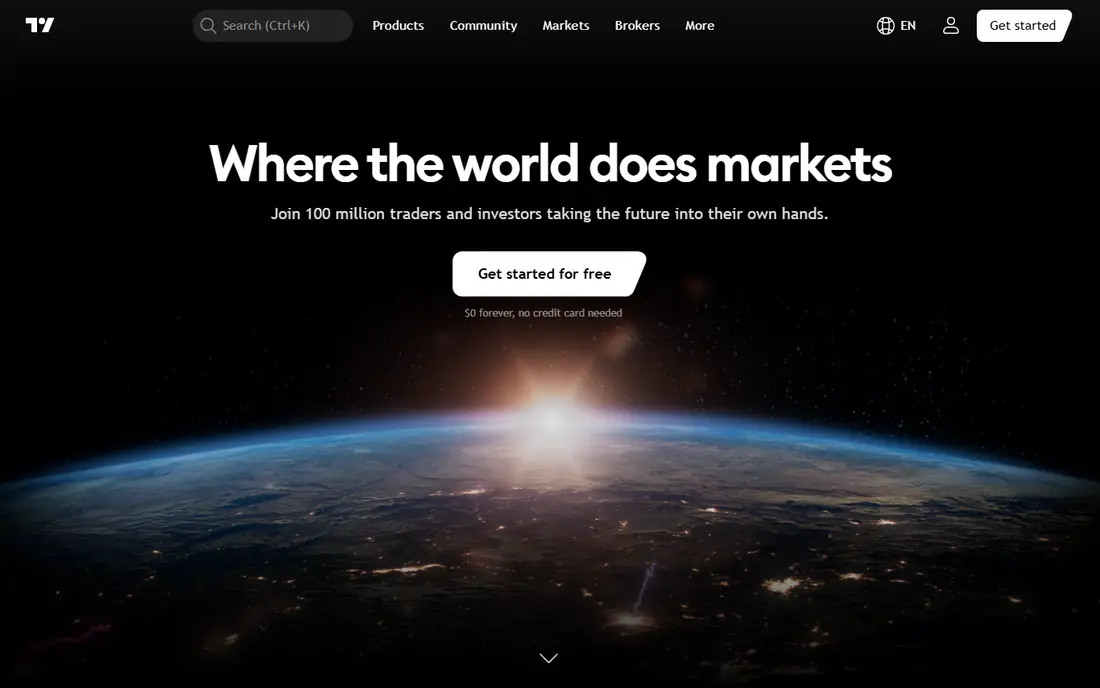
TradingView is the default charting tool for many crypto traders, and for good reason. It covers thousands of crypto pairs across major exchanges, with candlestick, line, and range charts, hundreds of built-in indicators, and drawing tools for trend lines, levels, and patterns. Custom scripts let users build and share their own indicators.
The free Basic plan includes one chart per tab, two indicators per chart, and a small alert limit, which is enough to learn the platform. Essential costs $14.95 per month, Plus $34.95, Premium $69.95, and Ultimate $239.95, with lower monthly equivalents on annual billing. The main catch is that higher indicator counts, alert capacity, and historical bars sit on higher tiers, so active traders often land on Plus or Premium.
- Huge indicator and drawing tool set
- Many crypto exchanges and pairs
- Large script library and community ideas
- Paid tiers needed for more indicators and alerts
- Some exchange data is a paid add-on
- Ads on the free plan
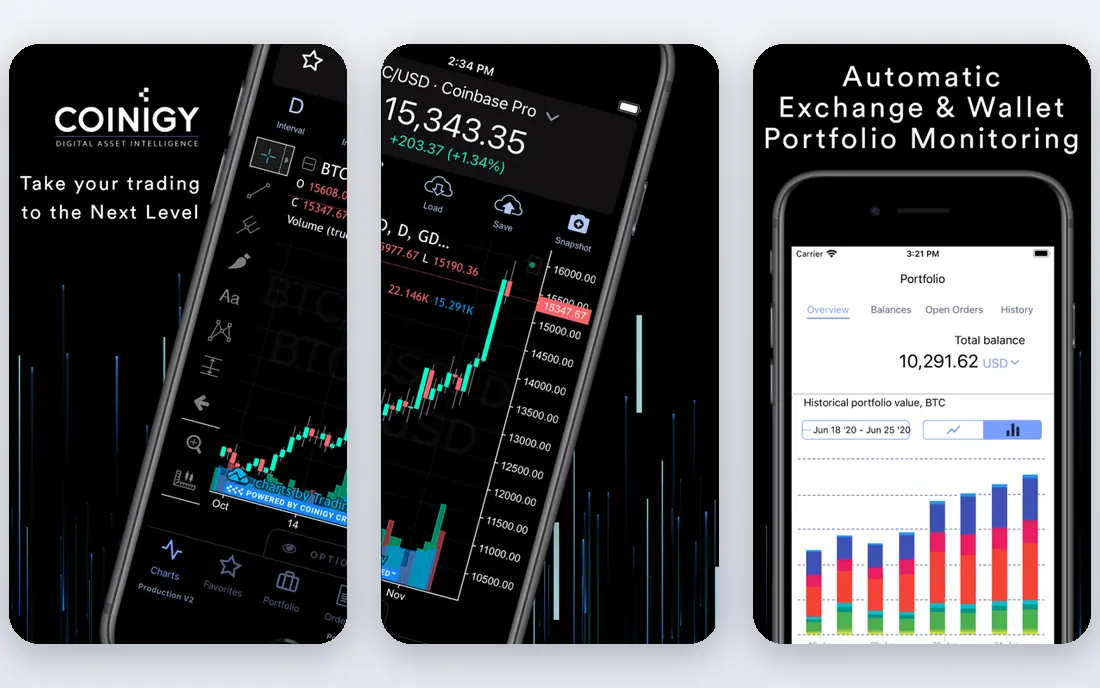
Coinigy solves a different problem from TradingView. Instead of going deep on one chart, it pulls balances, orders, and prices from many exchanges into one dashboard, so a trader with coins spread across venues can see total exposure without opening many tabs. Charts use TradingView charting, with timeframes, indicators, and alerts.
The Starter plan is a 7-day trial. Pro Trader costs $18.66 per month, and an API Developer plan costs $99.99 per month for developer access. Coinigy fits traders who manage positions across exchanges and want to place trades from one place. Pure chart analysts who do not trade across venues may get more depth from TradingView directly.
- Connects many exchanges in one dashboard
- Portfolio tracking with charting
- Trading from one interface
- No permanent free plan, only a trial
- Charting depth is less than TradingView alone
- Exchange API changes can affect connections
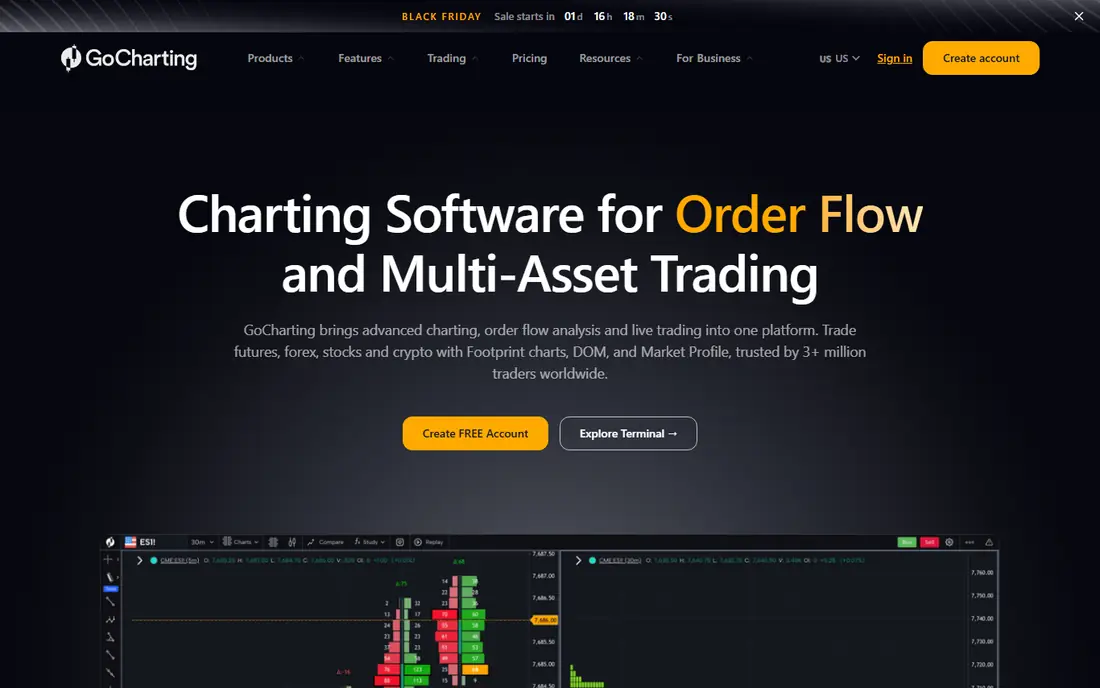
GoCharting is aimed at traders who want serious technical analysis without paying for a full TradingView Premium tier. It offers advanced charts, a wide indicator set, drawing tools, and screeners that help users find setups across many pairs. Its guides also help newer traders learn how indicators work, rather than just applying them blindly.
A free plan is available for basic charting, and Premium is listed at $20 per month. That price point makes it a useful middle option for traders who have outgrown a free chart but do not need the top TradingView tiers. The trade-off is community size: fewer shared scripts and ideas than TradingView, so users rely more on their own setups.
- Advanced charting with many indicators
- Scanner and screener tools
- Guides for newer traders
- Smaller community than TradingView
- Paid plan needed for full features
- Interface takes time to learn
Cryptowatch, owned by Kraken, offers clean and fast crypto charts with order book, market depth, and recent trade data next to the price chart. That layout suits traders who watch liquidity and order flow while they read price action, without a crowded interface.
A free tier covers basic charting, and paid options add more features, though buyers should check current pricing on the vendor site. Cryptowatch is not the widest charting library in this list, but it is a calm, focused tool for traders who mainly follow Kraken markets or want a second, simpler chart view.
- Clean, fast charts from Kraken
- Order book and trade views alongside price
- Simple interface
- Narrower exchange coverage than TradingView
- Fewer community features
- Pricing details should be checked on the vendor site
DexScreener is the discovery tool in this list. It tracks tokens on decentralized exchanges across many chains, with price charts, liquidity, volume, and holder data in one view. Traders use it to spot new pairs early, check liquidity before buying, and follow trending tokens without waiting for a centralized listing.
The core service is free, which makes it easy to add alongside a deeper charting tool. The warning matters more here than elsewhere: new and low-liquidity tokens can lose value quickly, and some are scams or honeypots. Use DexScreener for research and liquidity checks, not as a signal to buy, and never risk money you cannot afford to lose.
- Fast discovery of new and trending tokens
- Charts across many chains and exchanges
- Free to use
- New tokens carry high risk and scams
- Less depth for long-term analysis
- No built-in trading for most users
CoinGlass is best used next to a charting tool, not instead of one. It aggregates derivatives data such as open interest, funding rates, liquidations, and long and short ratios across major exchanges, which helps traders understand positioning behind a price move. A sharp liquidation cascade, for example, reads very differently when open interest and funding are visible.
A free tier covers much of the core data, with paid plans adding more depth and history. CoinGlass suits traders who already use futures or perpetual contracts and want market structure data. Spot-only holders will get less value from it, and new traders should learn the terms before acting on the numbers.
- Liquidation, open interest, and funding data
- Exchange and coin views
- Useful alongside price charts
- Focused on derivatives data, not full charting
- Some features need a paid plan
- Data can overwhelm new traders
TrendSpider automates parts of technical analysis that take time by hand. It can draw trend lines, detect patterns, scan for setups, and run alerts across timeframes, which suits traders who follow many pairs and want the software to surface candidates first. Backtesting tools let users test a rule against past price data before using it live.
Pricing should be checked on the vendor site, since published figures vary and plans are tiered by features and alert capacity. TrendSpider fits active traders who want automation and scanning, rather than a simple chart viewer. Beginners should still learn what each pattern means, since an automated signal is not a guarantee of a profitable trade.
- Automated trend lines and pattern detection
- Alerts and backtesting tools
- Multi-timeframe analysis
- Pricing is not always clearly published
- Stronger for US markets in some reviews
- Learning curve for automation features
Bookmap shows the market as a living order book, with bids, asks, and executed trades visualized as a heatmap over time. Short-term traders use it to see where large orders sit, where liquidity builds, and how price reacts at key levels. That view is very different from a standard candlestick chart, and it rewards traders who study order flow.
A free trial is available, with paid plans varying by exchange data feed and features. Bookmap is not the pick for a long-term holder who only needs weekly charts. It fits scalpers and day traders who trade around liquidity, and it takes practice before the heatmap reads as useful information rather than noise.
- Visual order book and heatmap
- Order flow and liquidity views
- Useful for short-term traders
- Steep learning curve
- Pricing varies by data feed
- Not a general long-term charting tool
How we picked these
We compared official feature and pricing pages, plus recent 2026 comparisons of crypto charting tools. We favored tools that are live now, that truly focus on crypto price charts or crypto market data, and that cover different trading styles rather than repeating the same chart. We did not claim hands-on trading results, and where pricing was not clearly published we used See website. This article is general information only, not financial advice, and no tool here promises returns.
How to choose a charting tool
Start with your trading style. A holder needs clean charts, alerts, and a screener. A multi-exchange trader needs portfolio aggregation and one trading view. A derivatives trader needs open interest, funding, and liquidation data. A short-term trader needs order flow. Buying the deepest tool for a simple job adds cost and clutter.
Free plans, indicators, and alerts
Free plans are useful, but they limit indicators per chart, alerts, saved layouts, and historical data. Count the indicators you actually use on a typical chart, and check how many alerts you need running at once. If you regularly hit the cap, a paid tier is cheaper than missing a level because an alert expired.
Data quality and exchange coverage
Check whether the tool covers the exchanges and pairs you trade, and whether real-time data for a given exchange is included or sold as an add-on. A chart is only as good as its feed, and delayed or thin data can mislead. Also check whether the tool shows spot, futures, or both, since some pairs exist in one market only.
Risk, security, and API keys
If a tool connects to exchanges, use read-only API keys where possible, limit permissions, and never share a key that allows withdrawals. Keep trading funds on reputable exchanges, use two-factor authentication, and treat any chart signal as one input, not a decision. Crypto prices are volatile, and losses can exceed the cost of any subscription.
Frequently asked questions
What is the best crypto charting software?
The best crypto charting software for most users is TradingView, thanks to its chart depth, indicator library, and exchange coverage. Coinigy fits multi-exchange traders, GoCharting fits indicator-heavy traders, and DexScreener fits token discovery. The right pick follows your trading style.
What are the best crypto charting platforms for beginners?
Beginners should start with a free plan on TradingView, GoCharting, or Cryptowatch, and learn one or two indicators at a time. DexScreener is useful for research, but new tokens carry high risk. Avoid paying for a top tier until you know which indicators and alerts you actually use.
Is crypto charting software free?
Several tools offer free plans or trials. TradingView, GoCharting, Cryptowatch, DexScreener, and CoinGlass all offer free tiers, while Coinigy, TrendSpider, and Bookmap offer trials. Paid plans add indicators, alerts, historical data, and market data depth.
Can charting software predict crypto prices?
No. Charting software shows past price, volume, and market data, and can highlight patterns and levels, but it cannot predict future prices. Treat charts as a research aid, manage risk with position size and stop levels where appropriate, and do not rely on any single indicator.
What is the difference between TradingView and Coinigy?
TradingView is a general charting platform with deep indicators, scripts, and community ideas across many markets. Coinigy is a multi-exchange trading and portfolio tool that uses TradingView charting, but its main value is managing balances and trades across many exchanges in one dashboard.
Is crypto trading risky?
Yes. Crypto prices can move sharply, liquidity can vanish, and some tokens are scams. Only risk money you can afford to lose, use reputable exchanges, protect API keys, and treat this article as general information only, not financial advice.
Sources
See where you really rank - block by block
ProMapRanker scans Google Maps across a grid of your service area. Simple monthly plans from $19, white-label on every plan.
Start freeKeep reading
 who has best internet service
Who Has the Best Internet Service in 2026
Who has best internet service for US homes? We compare fiber, cable, fixed wireless and satellite providers on speed, price, availability and terms today.
Read → which survey tool has the best analytics
Which Survey Tool Has the Best Analytics in 2026
Find which survey tool has the best analytics in 2026, comparing Qualtrics, SurveyMonkey, Typeform, Alchemer, and more on reports, text, and stats today.
Read → which streaming service has the best movies
Which Streaming Service Has the Best Movies in 2026
Answering which streaming service has the best movies, with Netflix, Max, Criterion and more compared on libraries, prices and free options in this guide.
Read →