 ProMapRanker
Best Apps Data Analytics in 2026

Key takeaways
- Power BI is the best value for Microsoft-based teams, while Tableau remains the strongest choice for deep, polished visual analysis.
- Looker Studio is the best free start for small teams, and Zoho Analytics and Metabase offer low-cost routes with more structure.
- Qlik Sense, ThoughtSpot, and Domo suit larger teams that need governed models, natural language questions, or enterprise reporting.
- License prices tell only part of the story, so model viewer seats, data capacity, and implementation time before you commit.
- Start with one clean data source and a few key dashboards, because a new tool will not fix messy or inconsistent data on its own.
Quick comparison
| Pick | Great for | Pricing starts at | Free tier | |
|---|---|---|---|---|
 Tableau | deep visual analysis | $15 per month | Free trial | Visit |
 Microsoft Power BI | Microsoft-based teams | Free | Yes | Visit |
 Looker Studio | free small-team reporting | Free | Yes | Visit |
 Qlik Sense | governed, associative analysis | $30 per month | Free trial | Visit |
 Domo | enterprise dashboards and apps | See website | Free trial | Visit |
 Zoho Analytics | low-cost small business BI | $24 per month | Yes | Visit |
 ThoughtSpot | natural language analytics | $25 per month | Free trial | Visit |
 Metabase | simple, open-source-friendly BI | Free | Yes | Visit |
 Sisense | embedded analytics | See website | Free trial | Visit |
The best data analytics platforms
We compared pricing, data connections, visualization depth, governance, and ease of use, using vendor pricing pages and current BI comparisons. Prices are per user per month unless stated, and many platforms also charge for capacity or enterprise tiers.
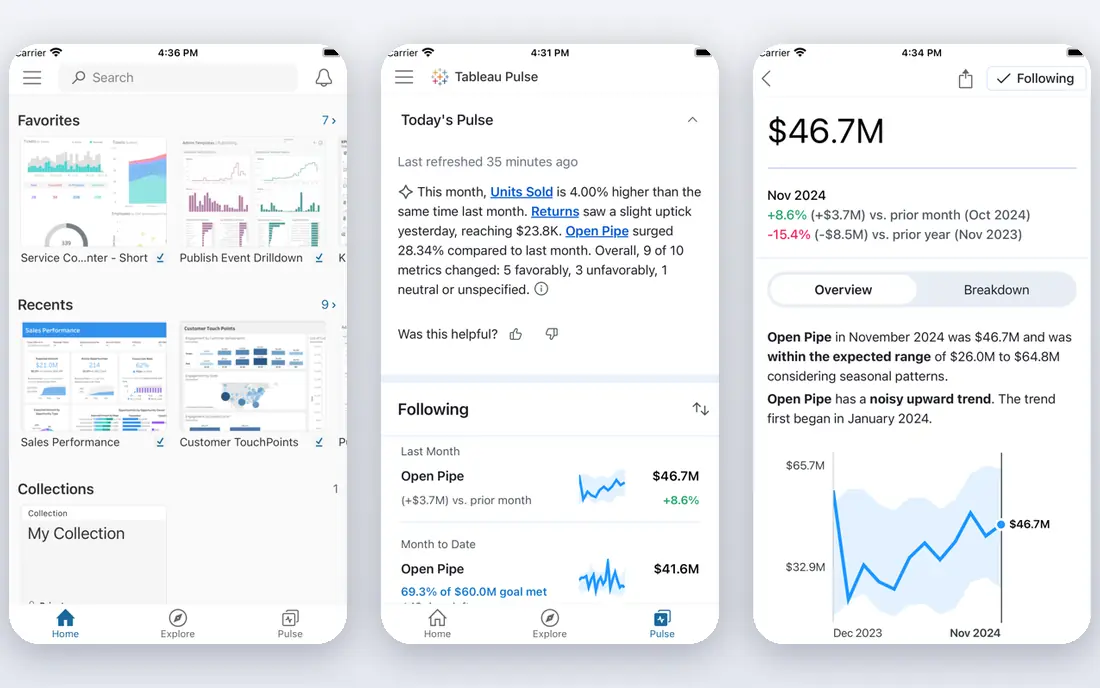
Tableau remains the reference point for visual analytics. Its drag-and-drop exploration, rich chart types, and polished dashboards suit analysts who need to explore data freely, not just view a fixed report. Tableau runs on Windows and Mac, connects to many databases and spreadsheets, and has a large community sharing techniques and templates.
The cost is the main barrier. Viewer seats start at $15 per user per month on the Standard edition, Explorer seats cost $42, and Creator seats cost $75, all billed annually. A team with many authors will pay far more than a Power BI team for the same headcount. Tableau is worth that premium when visual depth and analyst productivity matter most, but it is overkill for simple monthly reports.
- Outstanding visualization and exploration
- Works on Windows and Mac
- Strong community and learning resources
- Creator seats cost $75 per month
- Enterprise costs rise quickly
- Needs at least one Creator seat
Power BI is the best value analytics platform for most Microsoft-based organizations. Power BI Desktop is free for building reports, Pro costs $14 per user per month for sharing and collaboration, and Premium Per User costs $24 per user per month for extra features. Integration with Excel, Teams, SharePoint, and Azure makes adoption easy when those tools are already in use.
The limits are platform and scale. Power BI Desktop has no native Mac app, so Mac users build in the browser or run Windows in a virtual machine. Sharing also requires paid licenses unless content sits on qualifying Fabric capacity, and large deployments need capacity planning. For a Windows-based team, or a team already paying for Microsoft 365, Power BI is usually the sensible default.
- Very low entry cost
- Deep Excel, Teams, and Azure integration
- Free desktop app for building reports
- Desktop app is Windows-only
- Sharing needs a paid license
- Enterprise scale needs Fabric capacity
Looker Studio, formerly Google Data Studio, is the easiest free start for small teams. It connects smoothly to Google Analytics, Google Sheets, BigQuery, and many marketing tools, and you can share a dashboard with a link at no cost. For a marketing team, a small business, or a startup tracking a handful of metrics, Looker Studio covers most needs without a license bill.
The trade-off is depth. Looker Studio lacks the governed semantic models, advanced calculations, and enterprise controls of Looker, Tableau, or Power BI, and very large or complex datasets can slow it down. A Pro tier adds per-user and per-project pricing for teams that need more. Start with Looker Studio when your reports are simple, and move up when you need governed metrics or complex modeling.
- Free for standard use
- Easy Google Analytics and Sheets connections
- Simple sharing with a link
- Less powerful than Tableau or Power BI for complex models
- Pro features cost extra
- Governance is lighter
Qlik Sense stands out for its associative engine, which links related datasets automatically and lets users explore connections without writing a query for every question. That approach suits analysts working with many tables, where a fixed dashboard would hide useful relationships. Qlik also offers live connections to source data, so reports can reflect current values without a full data load.
Qlik's pricing has several tiers, with Business seats around $30 per user per month and cloud analytics plans starting at $300 per month for a starter bundle. Advanced modules for machine learning, printing, and geoanalytics cost extra, so model the full stack. The interface also takes time to learn, especially for business users new to analytics. For a team that values exploration and governed data models, Qlik is a strong enterprise alternative to Tableau.
- Associative engine surfaces related data automatically
- Strong data modeling
- Live source connections
- Learning curve for new users
- Advanced modules cost extra
- Interface can feel busy
Domo combines data connectors, preparation, dashboards, and low-code apps in one cloud platform, which suits organizations that want business users to build reports without managing many separate tools. Its Magic ETL tools, connectors, and mobile dashboards work well for executive reporting and operational teams that need current numbers on any device. Domo also supports AI-assisted features for summarizing and exploring data.
Pricing is quote-only, with mid-market contracts often reported in the tens of thousands of dollars per year, so Domo is not a small-team impulse buy. Its consumption credit model also needs monitoring, because heavy use can raise costs. Domo fits best for mid-sized and large organizations that want one platform for data and dashboards, with the budget to match.
- All-in-one data, dashboards, and apps
- Strong connectors and data preparation
- Good executive reporting
- Quote-only pricing
- Enterprise contracts can be large
- Credit-based consumption needs careful monitoring
Zoho Analytics is one of the most affordable analytics platforms for small businesses, with a free tier for two users and paid plans starting at $24 per month for two users on the Basic tier. It blends data from spreadsheets, databases, and business apps, including Zoho CRM and popular third-party tools, and its Zia AI assistant can generate dashboards and answer plain-language questions. For a small team that needs real reports without an enterprise budget, Zoho is an easy shortlist pick.
The limits are modeling depth and live data. Many sources sync on a schedule rather than in real time, and advanced query and modeling options are weaker than in Qlik or Tableau. Very large datasets can also slow the platform. If your team already uses Zoho apps, or you need low-cost reporting with a gentle learning curve, Zoho Analytics offers strong value.
- Low published pricing
- Free tier for two users
- AI assistant for auto-dashboards and plain-language questions
- Relies on scheduled syncs rather than live connections for many sources
- Advanced modeling is limited
- Performance can slow on large datasets
ThoughtSpot lets business users type a question in plain language, such as sales by region last quarter, and get a chart back, without writing SQL. That search-first approach suits teams where managers want answers directly, rather than waiting for an analyst to build a dashboard. Its governed models keep metrics consistent, and its AI assistant helps users explore follow-up questions.
Pricing starts at $25 per user per month for Essentials, billed annually, with Pro at $50 per user per month and Enterprise by quote. Essentials also has user limits that may push growing teams to Pro. ThoughtSpot works best when the underlying data model is clean and well defined, because natural language answers are only as good as the model behind them. For a team that wants self-service answers at scale, it is a leading choice.
- Search-based analytics in plain language
- Strong governed models
- Good for business users without SQL
- Essentials tier has user limits
- Pro and Enterprise costs rise
- Setup needs a clean data model
Metabase is a popular choice for startups and small teams that want simple analytics without a large bill. The open-source version is free to self-host, and cloud plans start at $100 per month for five users on the Starter tier. Its question builder lets non-technical users filter, group, and chart data without SQL, while analysts can still write SQL when needed. Dashboards are easy to share, and the learning curve is gentle.
Metabase visualizations are simpler than Tableau's, and features such as row-level security and single sign-on sit in Pro and Enterprise tiers. Self-hosting also needs someone to manage updates and backups. If you want a low-cost, easy-to-adopt tool for internal dashboards, and you are comfortable with simpler charts, Metabase is an excellent fit.
- Free open-source version for self-hosting
- Easy question builder for non-technical users
- Low-cost cloud plans
- Less polished visualization than Tableau
- Advanced governance needs paid tiers
- Self-hosting needs IT effort
Sisense is best known for embedded analytics, where a software company adds dashboards and reports inside its own product for customers to use. Its data modeling, APIs, and white-label options suit product teams that need analytics as a feature, not just an internal tool. Sisense also works for internal BI, with dashboards, alerts, and data preparation in one platform.
Pricing is quote-only and negotiated, with embedding licensed separately in many deals, so small teams should expect a sales process. Implementation also needs technical work to model data and embed dashboards well. If you are building analytics into a product, Sisense deserves a close look. If you only need internal reports, Power BI, Tableau, or Metabase will usually be simpler and cheaper.
- Strong embedded analytics for customer-facing products
- Flexible data modeling
- Good for product teams
- Quote-only pricing
- Implementation needs technical effort
- Less suited to casual internal reporting
How we picked these
We compared vendor pricing pages and current BI comparisons, focusing on entry cost, data connections, visualization depth, governance, and fit by team size. We favored platforms with active development, clear pricing or a clear enterprise model, and a distinct strength, from free reporting to embedded analytics. We did not claim hands-on testing with production data, and we noted where pricing is quote-only rather than publishing a guess.
How to choose the best platform for data analytics
Start with your team and your data, not with a feature list. A tool that fits your stack and your users will get used, while a powerful tool nobody opens is wasted money.
Match the tool to your stack
Microsoft teams usually get the most value from Power BI, Google teams from Looker Studio or Looker, and Zoho teams from Zoho Analytics. If you run Snowflake, BigQuery, or Databricks, consider warehouse-native tools such as Looker or ThoughtSpot, which query the warehouse directly. Check connectors for your key sources before you buy.
Model the real cost
Count viewer seats, not just author seats, because most teams have far more viewers than authors. Add data capacity, premium features, and implementation time to the license price. A free tool with a week of setup can cost more in staff time than a paid tool that connects in an afternoon.
Test with a real question
Pick one business question, such as monthly revenue by product, and build it end to end in each finalist. Check how hard it is to connect data, define the metric once, and share the result. The tool that makes that workflow easy for your team is usually the right one, even if another tool has a longer feature list.
Frequently asked questions
Which platform is best for data analytics for a small business?
Looker Studio is the best free start, and Zoho Analytics and Metabase are the strongest low-cost paid options for small businesses. Looker Studio suits simple marketing and sales reports, while Zoho and Metabase add more structure, users, and dashboard control. Choose based on your data sources and whether you need a governed model.
What are the best data analytics tools for beginners?
Looker Studio, Metabase, and Power BI are the most beginner-friendly tools in this list, thanks to visual builders and free entry points. ThoughtSpot also suits beginners who prefer typing questions in plain language. Start with a free tier, build one dashboard, and only pay once the tool proves useful.
What is the best data analytics platform for large companies?
Tableau, Power BI, Qlik Sense, and Domo lead for large companies, with different strengths. Tableau wins on visual depth, Power BI on Microsoft value, Qlik on governed exploration, and Domo on all-in-one dashboards and apps. Large companies should run a pilot with real data and real users before committing.
What is the best platform for data analytics if we use Google tools?
Looker Studio is the natural free choice for Google Analytics, Sheets, and BigQuery reporting. Looker, Google's enterprise platform, adds governed models and Gemini-assisted analytics for larger teams. If you only need a few marketing dashboards, Looker Studio is enough, and you can upgrade later.
Are there good best data analytics apps for mobile use?
Most platforms here offer mobile apps or mobile-friendly dashboards, including Power BI, Tableau, Domo, and Metabase. Domo and Power BI have particularly strong mobile reporting for executives who check numbers on the go. Test the mobile view for your key dashboard, because a chart that looks good on desktop can be hard to read on a phone.
How much do data analytics platforms cost?
Costs range from free for Looker Studio, Power BI Desktop, and Metabase open source, to $14 per user per month for Power BI Pro, $15 to $75 per user per month for Tableau roles, and quote-only enterprise pricing for Domo and Sisense. Add viewer seats and capacity costs to get a true total, and use a free trial to test before paying.
Sources
- https://www.tableau.com
- https://www.microsoft.com/en-us/power-bi
- https://lookerstudio.google.com
- https://www.qlik.com
- https://www.domo.com
- https://www.zoho.com/analytics
- https://www.thoughtspot.com
- https://www.metabase.com
- https://www.sisense.com
- https://www.basedash.com/blog/bi-tool-pricing-plans-seat-limits-and-ai-costs-2026
- https://www.goodfirms.co/business-intelligence-software/blog/business-intelligence-software-pricing
See where you really rank - block by block
ProMapRanker scans Google Maps across a grid of your service area. Simple monthly plans from $19, white-label on every plan.
Start freeKeep reading
 best tour operator software
Best Tour Operator Software in 2026
Compare the best tour operator software for bookings, channel management, waivers and payments, with pricing models for day tours and multi-day trips.
Read → best time clock app for small business
Best Time Clock App for Small Business in 2026
We compare the best time clock app for small business options, with free plans, GPS clock ins, scheduling and payroll links for hourly teams and payroll help.
Read → best test automation tools
Best Test Automation Tools in 2026
Compare the best test automation tools, from Playwright and Selenium to Cypress, Katalon and BrowserStack, with prices, languages and best uses explained.
Read →