 ProMapRanker
Best Application Monitoring Service in 2026


Cloud-native teams wanting one platform · Pricing starts at: $31 per host per month
Key takeaways
- Datadog and Dynatrace suit large, complex estates, while New Relic and Grafana Cloud give smaller teams a cheaper way in.
- Sentry is the fastest route when errors and releases matter more than full infrastructure coverage.
- Per-host, per-gigabyte, and per-event pricing grow in very different ways, so model your own traffic before you commit.
- A free tier is useful for a trial, but check retention limits and data caps before you rely on it in production.
Quick comparison
| Pick | Great for | Pricing starts at | Free tier | |
|---|---|---|---|---|
| Datadog | Cloud-native teams wanting one platform | $31 per host per month | Free trial | Visit |
 New Relic | Usage-based teams starting small | See website | Yes | Visit |
 Dynatrace | Large enterprises needing automatic root cause | See website | Free trial | Visit |
 Sentry | Developers focused on errors and performance | $26 per month | Yes | Visit |
 Grafana Cloud | Open-source stack teams | $19 per month | Yes | Visit |
 Honeycomb | Debugging complex distributed traces | $150 per month | Yes | Visit |
 Splunk Observability Cloud | Teams already invested in Splunk | See website | Free trial | Visit |
 Elastic Observability | Search-led teams wanting deployment control | See website | Yes | Visit |
 IBM Instana | Automatic discovery across containers | See website | Free trial | Visit |
The best application monitoring services
Application monitoring shows which request slowed down, which deploy introduced an error, and which service sat behind a failed checkout. We compared official pricing pages, feature pages, and public documentation for the services below.
Datadog appeals to teams that run many services across cloud providers and want one place to check them. Its APM view links traces to logs and infrastructure metrics, which shortens the hunt when a single endpoint degrades. The integration catalog is wide, so common databases, queues, and cloud services usually connect without custom work.
The catch is billing discipline. Per-host pricing plus add-ons for logs and custom metrics can grow faster than headcount, so set usage alerts early. Smaller teams may find the platform more than they need, but larger teams often value having everything under one login.
- Broad integration catalog
- Strong dashboards and alerts
- APM, logs, and infrastructure in one place
- Costs can climb quickly with hosts and custom metrics
- Setup takes time at scale
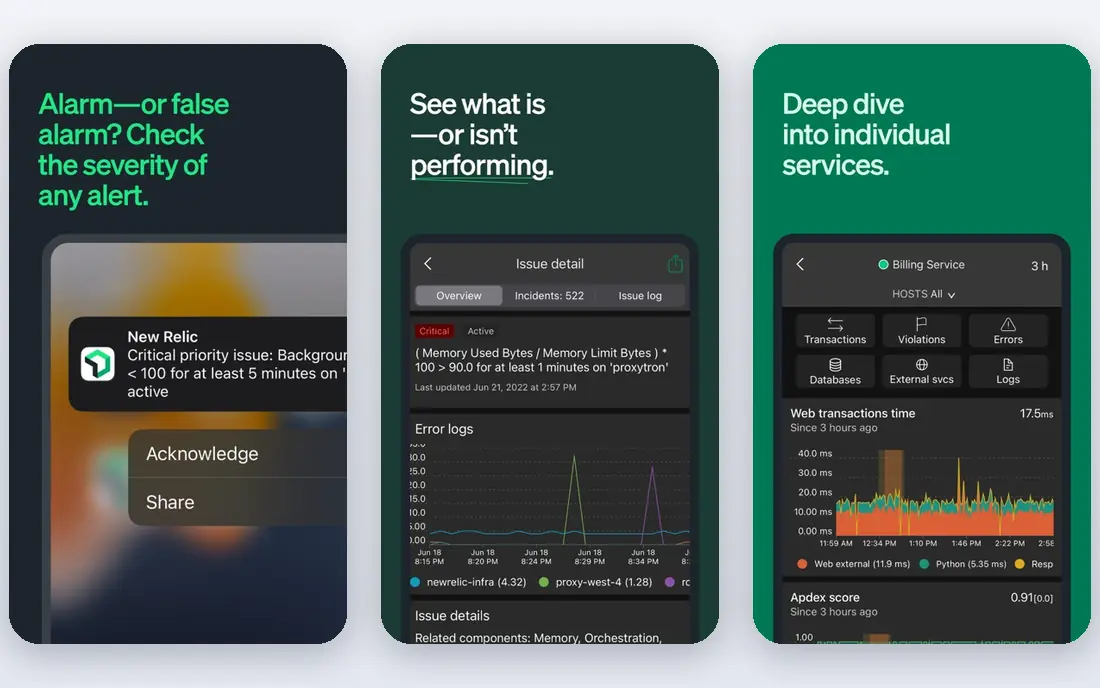
New Relic stands out for teams that want to start without counting hosts. Its free tier includes a monthly data allowance that covers many small production workloads, and basic users can view dashboards without a full-platform seat. That makes it easy to share visibility with product and support colleagues.
As data volume grows, the bill follows data ingest and full-platform seats rather than host count. That can suit bursty or container-heavy workloads, but chatty logging will cost you. Keep an eye on ingest and retention settings from the first week.
- Free data allowance for small workloads
- No per-host counting
- Broad platform coverage
- Paid user seats and data overages add up
- Pricing model takes study to predict

Dynatrace takes an opinionated approach: one agent discovers hosts, services, and dependencies, then maps them for you. For a large estate where nobody holds the full architecture in their head, that map is the main selling point. Its analysis aims to point at a probable cause rather than leaving you to correlate charts by hand.
The trade-off is scale and commitment. Pricing is built around committed usage, and the platform assumes a sizable environment. A small team with a handful of services will likely pay for depth it does not use.
- Automatic discovery and dependency mapping
- Strong root-cause analysis
- Managed deployment option
- Commitment-based pricing
- Heavyweight for small teams
Sentry is the pick when the question is what broke in code, not whether a server ran out of disk. A small SDK change sends errors with stack traces, release versions, and affected users, so a developer can move from alert to fix without a long search. Performance monitoring adds slow transaction views on top of that error core.
It does not replace infrastructure monitoring. If you also need host metrics, log management, and uptime checks at depth, pair Sentry with another tool on this list. Watch event quotas, since a noisy error loop can burn through a monthly allowance fast.
- Fast setup for error tracking
- Release and commit links
- Useful performance tracing
- Not a full infrastructure platform
- Event volume caps matter on busy apps
Grafana Cloud suits teams that already think in Prometheus, Loki, and Tempo, or want to learn that stack without running it all themselves. The free tier covers a useful amount of metrics, logs, and traces, and the paid Pro plan starts with a modest platform fee plus usage. Because the underlying tools are open, moving to self-hosted Grafana later does not force a rewrite of every dashboard.
The cost of that freedom is effort. You design dashboards, tune queries, and decide what to keep. Teams that want a guided, opinionated setup may prefer Datadog or Dynatrace instead.
- Open standards and portable dashboards
- Generous free tier
- Flexible query options
- You assemble more of the experience yourself
- Less guided setup than rivals
Honeycomb is built for a specific pain: a request that is slow for some users, in some regions, under some conditions, and no dashboard shows why. Its event-based model lets you slice traces by many attributes at once, which helps when the problem hides in a combination of factors. Teams with mature OpenTelemetry instrumentation get the most from it.
That focus is also its limit. Honeycomb is not trying to be your all-purpose server monitor, and the paid entry point is higher than some rivals. Buy it for debugging depth, not as a cheap catch-all.
- Excellent high-cardinality event exploration
- Strong OpenTelemetry support
- Fast querying for debugging
- Higher entry price
- Less suited as a general infrastructure monitor
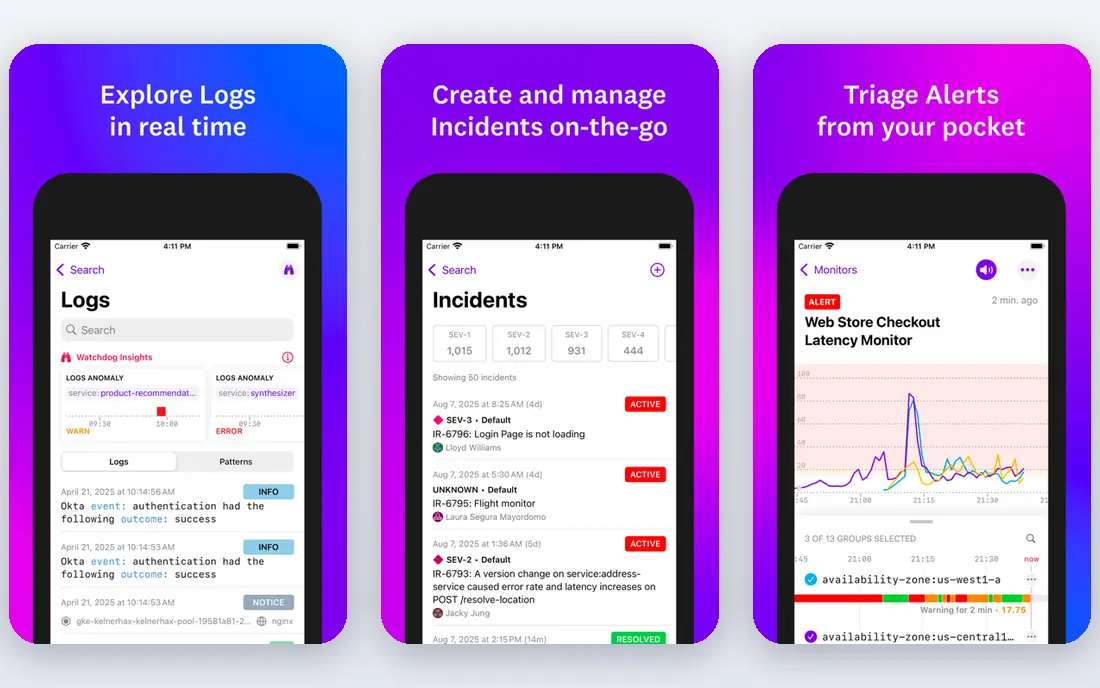
Splunk Observability Cloud fits organisations that already run Splunk for security or log analysis and want application data in the same family of tools. Full-fidelity tracing can help when sampled traces keep missing the rare failure, and the platform covers infrastructure, APM, and digital experience in one suite.
Cost and complexity are the honest drawbacks. At scale it sits at the expensive end of this list, and getting value from it usually needs dedicated time. For teams without a Splunk base, a simpler rival often delivers faster results.
- Deep integration with Splunk security and log tools
- Full-fidelity tracing options
- Enterprise controls
- Among the pricier options at scale
- Setup and tuning take real effort
Elastic Observability appeals to teams that already use Elasticsearch and want application data searchable in the same way as logs. You can run it yourself or use Elastic Cloud, which gives control over data location and deployment shape that pure SaaS rivals do not offer. APM agents cover common languages and frameworks.
Self-hosting is not free in effort, even when the software costs nothing to download. Upgrades, scaling, and storage planning become your job. Teams that want a fully managed service should compare the cloud price carefully against Grafana Cloud and New Relic.
- Self-hosting option
- Strong search across logs and traces
- Flexible deployment choices
- Running it yourself adds operational work
- Cloud pricing depends on deployment size
Instana focuses on automatic discovery, including short-lived containers that appear and disappear between scrapes. That granularity helps in Kubernetes environments where services churn quickly. Traces, metrics, and profiles arrive together, so an engineer can move from a slow request to the code and host behind it.
Pricing is not published as a simple starting rate, so you will need a quote to budget accurately. The community and integration catalog are smaller than Datadog, which matters if you rely on niche tooling.
- Automatic discovery at fine granularity
- Strong container and Kubernetes views
- Low overhead agent design
- Quote-based pricing
- Smaller community than the largest rivals
How we picked these
We compared official pricing pages, feature documentation, and public product descriptions for each service, and checked that each one is still offered in October 2026. We favoured services that cover real application tracing and performance data, not uptime checks alone, and we kept a mix of per-host, usage-based, and self-hosted models so different team shapes can compare fairly. We did not claim hands-on testing, and prices shown are starting points that change with volume, retention, and contract terms.
What to check before you buy
Start with how you will be billed. Count hosts, estimate data volume, and list how many engineers need full access, because each vendor meters a different thing. A tool that looks cheap at ten hosts can become expensive at a thousand containers, and a data-based tool can surprise you if logging is chatty.
Match the tool to the incident you fear most
If slow checkouts are the problem, prioritise tracing depth and high-cardinality search. If outages are the problem, prioritise infrastructure coverage, alerting, and on-call integrations. If developer speed is the problem, prioritise error tracking and release links. One tool rarely wins on all three, so name your top incident type before you shortlist.
Trial with your own traffic
Run a trial on a real service, not a demo app, and send production-like traffic if you safely can. Check how long it takes from alert to a named service and code path, and whether dashboards make sense to someone who did not build them. Also test retention: a trace you cannot find after a week is little use for a slow-burn problem.
Control cost from day one
Set billing alerts, drop noisy log fields, and sample high-volume traces where full fidelity adds little value. Review usage after the first month and again after a deploy that changes traffic patterns. Small settings here often save more than a plan downgrade.
Frequently asked questions
What is the best application monitoring service for a small team?
New Relic, Grafana Cloud, and Sentry are strong starting points, because each offers a free tier that covers small workloads. Choose Sentry if errors lead your work, Grafana Cloud if you already use open-source tooling, and New Relic if you want a broad platform without counting hosts.
What are the best application monitoring platforms for large enterprises?
Datadog, Dynatrace, and Splunk Observability Cloud lead for large estates, thanks to broad coverage, automation, and enterprise controls. Dynatrace stands out for automatic root-cause analysis, while Datadog suits teams that want one vendor across many signals.
How much does application monitoring cost?
It depends on the meter. Per-host tools often start around $31 per host per month for APM, usage-based tools charge by data or events, and enterprise platforms are usually quote-based. Model your host count, data volume, and user seats together, since a headline rate alone rarely predicts the invoice.
Do I need APM if I already monitor servers?
Server monitoring tells you a host is healthy, while APM tells you why a specific request is slow or failing. If your incidents are about user-facing latency or errors rather than host outages, APM adds the code-level detail that infrastructure charts cannot show.
Can I use a free application monitoring plan in production?
Yes, within limits. Free tiers cap data volume, retention, or users, so they suit small services and early trials. Plan an upgrade path before a traffic spike forces one, and check whether the free tier covers the retention period you need for investigations.
Sources
- https://www.datadoghq.com/pricing/
- https://newrelic.com/pricing
- https://www.dynatrace.com/pricing/
- https://sentry.io/pricing/
- https://grafana.com/pricing/
- https://www.honeycomb.io/pricing
- https://www.splunk.com/en_us/products/observability-cloud.html
- https://www.elastic.co/pricing
- https://www.instana.com/pricing
See where you really rank - block by block
ProMapRanker scans Google Maps across a grid of your service area. Simple monthly plans from $19, white-label on every plan.
Start freeKeep reading
 who has best internet service
Who Has the Best Internet Service in 2026
Who has best internet service for US homes? We compare fiber, cable, fixed wireless and satellite providers on speed, price, availability and terms today.
Read → which survey tool has the best analytics
Which Survey Tool Has the Best Analytics in 2026
Find which survey tool has the best analytics in 2026, comparing Qualtrics, SurveyMonkey, Typeform, Alchemer, and more on reports, text, and stats today.
Read → which streaming service has the best movies
Which Streaming Service Has the Best Movies in 2026
Answering which streaming service has the best movies, with Netflix, Max, Criterion and more compared on libraries, prices and free options in this guide.
Read →