 ProMapRanker
Alternatives to InfluxDB

Key takeaways
- TimescaleDB is our pick for most teams, since it adds time series power to familiar PostgreSQL.
- QuestDB and VictoriaMetrics suit high-speed ingestion, while Prometheus suits metrics and alerting.
- ClickHouse and Apache Druid suit large analytical workloads, while TDengine and Apache IoTDB suit industrial IoT.
- Open source editions are free to self-host, but managed cloud prices and hosting costs vary, so check the vendor site.
Quick comparison
| Pick | Great for | Pricing starts at | Free tier | |
|---|---|---|---|---|
 TimescaleDB | PostgreSQL teams | $30 per month | Free trial | Visit |
 QuestDB | Fast SQL ingestion | Free | Yes | Visit |
 VictoriaMetrics | Scalable metrics | Free | Yes | Visit |
 Prometheus | Monitoring and alerts | Free | Yes | Visit |
 ClickHouse | Large analytics | See website | Free trial | Visit |
 TDengine | Industrial IoT | Free | Yes | Visit |
 Apache Druid | Real-time analytics | Free | Yes | Visit |
 Apache IoTDB | Industrial time series | Free | Yes | Visit |
The best alternatives to InfluxDB
InfluxDB is a well-known time series database, but teams leave it for many reasons: cost at scale, query language preferences, PostgreSQL compatibility, or simpler operations. The databases below all handle time-stamped data well, and none of them is InfluxDB itself. We compared official docs, pricing pages, and public guides to build this list.
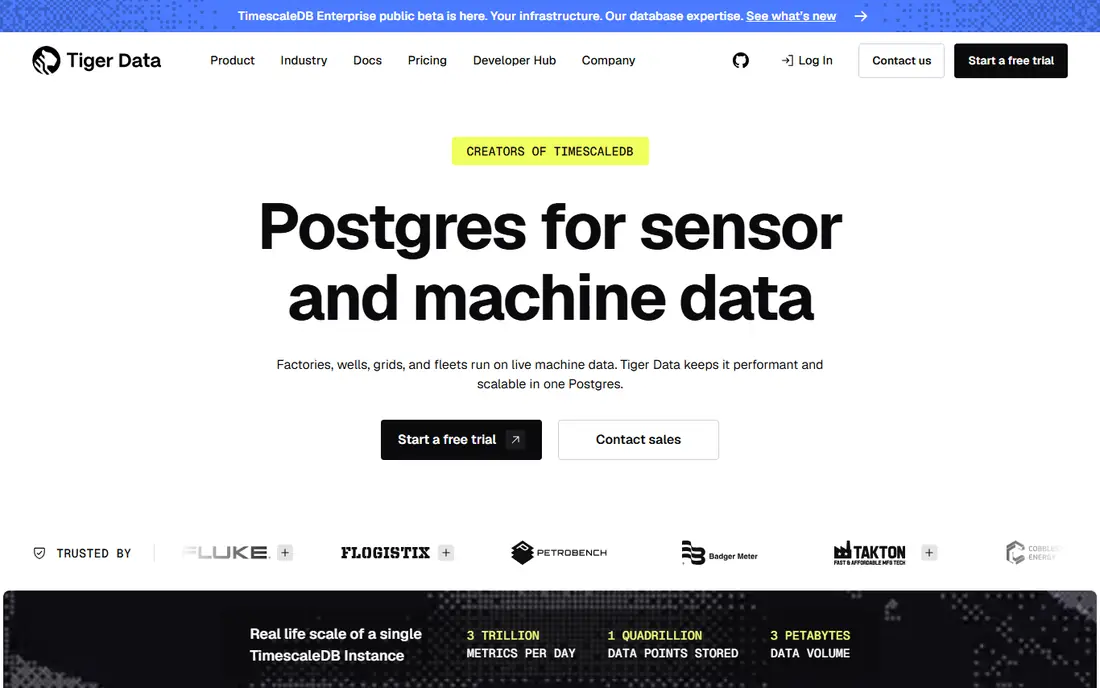
TimescaleDB, now from Tiger Data, is our pick for most teams because it builds on PostgreSQL. If your team already knows SQL and PostgreSQL tools, you can add time series tables, compression, and retention policies without learning a new query language. That familiarity cuts training time and tooling work.
Compression is a real strength. Hypertables can compress historical chunks heavily, which cuts storage cost for long retention. Continuous aggregates also speed up dashboards that query the same ranges repeatedly, which helps monitoring and IoT apps.
The catch is licensing and cloud cost. Some enterprise features sit behind a paid licence, and managed cloud pricing starts at $30 per month for a Performance plan in recent guides, rising with compute and storage. Self-hosting the open source edition avoids licence fees but adds operations work.
- Full PostgreSQL compatibility
- Strong compression
- Managed cloud option
- Some enterprise features need a paid licence
- Cloud cost grows with data
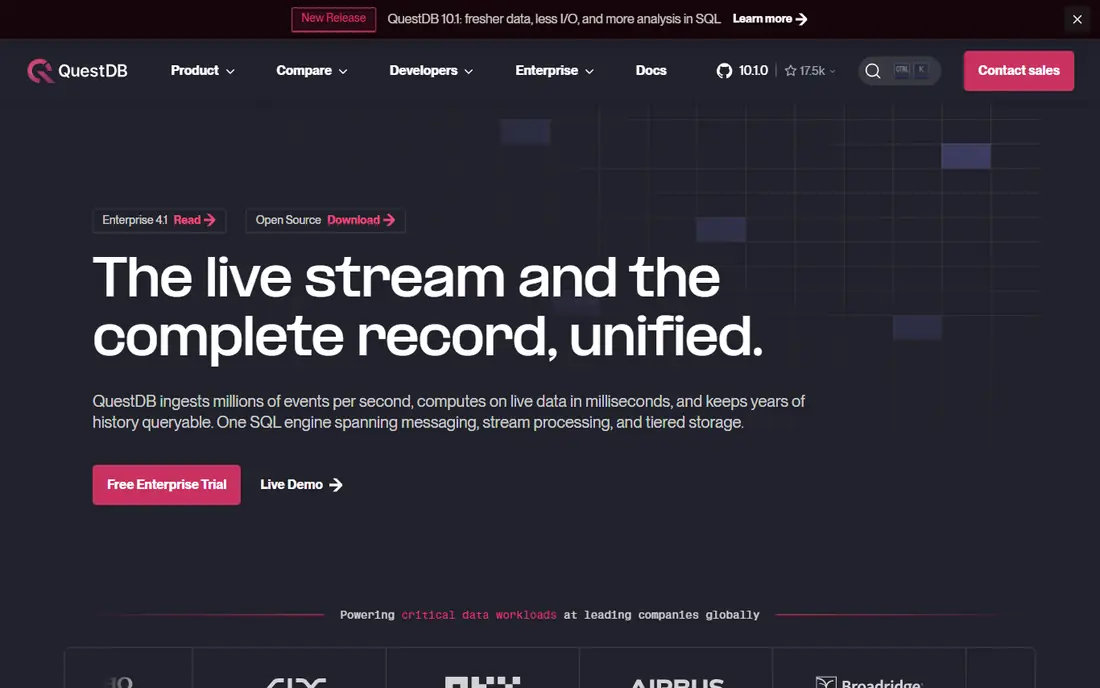
QuestDB suits teams that need fast ingestion and SQL queries without a heavy cluster. Its engine handles high write rates on modest hardware, and its SQL extensions make time series queries feel natural. A small footprint also helps edge and single-server deployments.
Migration help is another plus. QuestDB supports the InfluxDB line protocol, so existing agents can send data with less rework. That lowers the cost of testing a move from InfluxDB, since you can try QuestDB without replacing your whole pipeline at once.
The limit is high availability. Open source QuestDB lacks built-in replication and automatic failover, so production systems that need those features must use Enterprise, whose pricing is quote based. For pilots and internal analytics, open source is a strong start.
- Fast ingestion with SQL
- Small footprint
- InfluxDB line protocol support
- Open source lacks replication and failover
- Enterprise pricing is quote based
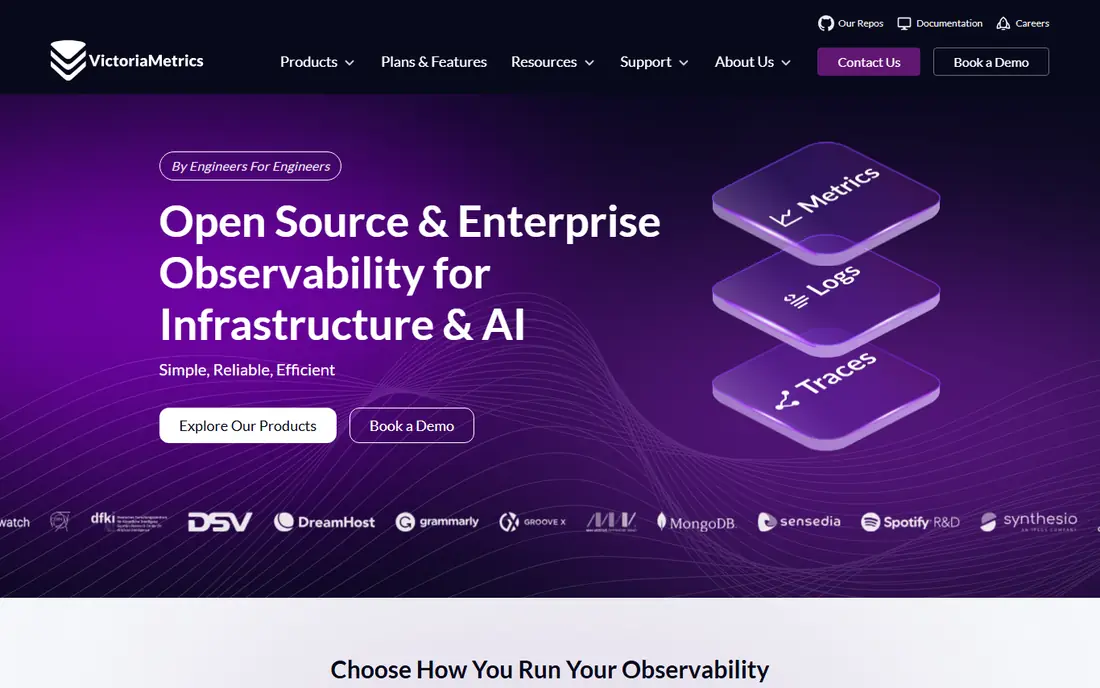
VictoriaMetrics is built for large metrics workloads, from infrastructure monitoring to IoT sensors. It ingests millions of data points per second on a single instance in vendor claims, and compression keeps storage costs down. Prometheus compatibility helps teams move existing metrics pipelines with less friction.
Operations are simpler than many clustered systems. A single binary can run a capable setup, and the cluster edition scales when data grows. That path from small to large suits teams that do not want to rebuild their stack as they grow.
The trade-off is query style. VictoriaMetrics uses its own query language alongside PromQL-style queries, so SQL-first teams may prefer TimescaleDB or QuestDB. Cluster setup also adds work, so start with the single-node edition for pilots.
- High ingestion and compression
- Prometheus compatibility
- Single binary option
- Cluster setup adds complexity
- Query language differs from SQL
Prometheus is the default choice for metrics and alerting in cloud-native teams. It pulls metrics from services, stores them as time series, and pairs with Alertmanager for notifications. Grafana dashboards make it easy to visualise the data, and the ecosystem is enormous.
Its query language, PromQL, is expressive for monitoring questions like rates, averages, and alerts over time windows. For operational dashboards and incident response, Prometheus is fast to set up and easy to reason about.
The limit is long-term storage. Prometheus is not built for years of high-cardinality data, and scaling beyond a single server needs tools like Thanos or Cortex-style systems. Use Prometheus for monitoring, and pair it with a long-term store if you need deep history.
- Free and open source
- Strong alerting
- Huge Grafana ecosystem
- Not built for long-term high-cardinality storage
- Scaling needs extra tools
ClickHouse suits teams that need fast analytics over huge time series and event data. Its columnar storage and compression make large scans fast, and SQL support feels familiar to analysts. For product analytics, logs, and wide event tables, ClickHouse is hard to beat on speed.
It also handles time series well, with time-based partitioning and functions for time ranges. Teams that outgrow a pure metrics store often move analytical workloads here, while keeping Prometheus for live alerting.
The downside is operations and pricing. Running ClickHouse at scale takes care, and cloud pricing is usage based, with trial credit in recent guides rather than a simple flat rate. Budget carefully, test with real data volumes, and compare total cost with TimescaleDB before you commit.
- Very fast analytical queries
- Strong compression
- Broad SQL support
- Operational complexity at scale
- Cloud pricing is usage based and hard to predict
TDengine is built for IoT and industrial data, where thousands of devices send readings constantly. Its design handles high ingestion rates and stores data efficiently, which matters when device counts grow. SQL-like queries keep it approachable for developers.
It suits energy, manufacturing, and smart device teams that need fast writes and time-range reads. Connectors and client libraries cover common languages, and the open source edition is free to self-host.
The trade-off is ecosystem size. TDengine has fewer third-party tools and integrations than PostgreSQL or Prometheus, so check your dashboard, alerting, and pipeline needs first. Some advanced features also sit in paid editions, so read the edition comparison before you plan.
- Built for IoT ingestion
- Efficient storage
- SQL-like queries
- Smaller ecosystem than PostgreSQL
- Some features need paid editions
Apache Druid suits real-time analytics where dashboards must update as data arrives. It ingests streaming data, indexes it for fast queries, and serves user-facing dashboards with low latency. For product and operational analytics at scale, Druid is a proven choice.
Its architecture separates ingestion, storage, and query roles, which helps scale each part independently. That design suits large teams with dedicated operations staff and clear capacity plans.
The catch is complexity. Druid is a distributed system, not a single binary, and setup, tuning, and capacity planning take real work. Small teams will find TimescaleDB or QuestDB easier to run. Choose Druid when real-time dashboard speed justifies the operations cost.
- Real-time ingestion and queries
- Strong for user-facing dashboards
- Open source
- Distributed setup is complex
- Needs careful capacity planning
Apache IoTDB is built for industrial time series, from energy grids to factories and transport systems. It handles device hierarchies, multi-protocol ingestion, and edge-to-cloud sync, which suits plants where connectivity is uneven. Data integrity and uptime matter more than developer ergonomics here, and IoTDB reflects that priority.
Its time series model fits sensor data well, with alignment across devices and aggregation over time. For teams that manage physical infrastructure, IoTDB can be a better fit than a general metrics store.
The downside is community size and learning curve. IoTDB has a smaller ecosystem than TimescaleDB or Prometheus, so finding examples and integrations takes more effort. Test it with your actual device data before you commit to a migration.
- Built for industrial telemetry
- Edge to cloud sync
- Open source
- Smaller community than mainstream databases
- Learning curve for new users
How we picked these
We compared official docs, pricing pages, and public guides for time series databases that exist and work today. We kept only databases with real time series strengths, and we mixed SQL, metrics, and industrial options. We did not claim hands-on benchmarks. Managed prices change, so check the vendor site for your workload.
How to choose an InfluxDB alternative
Start with your query language and existing stack. PostgreSQL teams should try TimescaleDB first, Prometheus users should try VictoriaMetrics or stay with Prometheus for monitoring, and SQL fans who need speed should try QuestDB. Matching your stack cuts migration work more than any single feature.
Next, test with real data volume and retention. Ingestion speed, compression, and query speed all change with cardinality and history length. Run a pilot with a week of real data, measure storage and query times, and check dashboard and alerting integrations. Finally, price the full system, including hosting, backups, and operations time, not just the licence. A free database that needs a large team can cost more than a managed service.
Frequently asked questions
What are the best InfluxDB alternatives?
TimescaleDB is our pick for most teams, thanks to PostgreSQL compatibility. QuestDB suits fast SQL ingestion, VictoriaMetrics suits scalable metrics, and Prometheus suits monitoring and alerting. ClickHouse, TDengine, Apache Druid, and Apache IoTDB suit larger or industrial workloads.
Is TimescaleDB better than InfluxDB?
It depends on your stack. TimescaleDB wins for teams that already use PostgreSQL, since it adds time series features to familiar SQL and tooling. InfluxDB wins for teams built around its line protocol and Flux queries. Test both with your data before you migrate.
Can I migrate from InfluxDB to QuestDB easily?
QuestDB supports the InfluxDB line protocol, which helps existing agents send data with less rework. Query migration still needs work, since SQL differs from Flux. Start with a pilot, move one pipeline at a time, and keep InfluxDB running until the new system proves itself.
Are these InfluxDB alternatives free?
Open source editions of TimescaleDB, QuestDB, VictoriaMetrics, Prometheus, ClickHouse, TDengine, Apache Druid, and Apache IoTDB are free to self-host. Managed cloud services charge for compute, storage, and support, and some enterprise features need paid licences. Check the vendor site for current pricing.
Which alternative is best for IoT data?
TDengine and Apache IoTDB are built for IoT and industrial telemetry, with high ingestion and device-focused models. TimescaleDB also handles IoT well for PostgreSQL teams, while VictoriaMetrics suits large metrics fleets. Choose based on device count, query style, and existing tooling.
Sources
See where you really rank - block by block
ProMapRanker scans Google Maps across a grid of your service area. Simple monthly plans from $19, white-label on every plan.
Start freeKeep reading
 best subscription manager app
Best Subscription Manager App in 2026
Find the best subscription manager app for your budget with our 2026 comparison of 8 apps, covering automatic detection, renewal alerts and free plans.
Read → best stock picking service
Best Stock Picking Service in 2026
Compare the best stock picking service options for 2026, with 8 stock recommendation services for long-term, dividend, quant, growth and income investors.
Read → best software wallet
Best Software Wallet in 2026
Compare the best software wallet options for 2026, with 8 crypto wallets for desktop and mobile, covering self-custody, supported chains, fees and security.
Read →