 ProMapRanker
Best Zenoss Alternatives in 2026

Key takeaways
- Zabbix is the strongest free enterprise option, with no license cost and deep SNMP and agent monitoring.
- PRTG suits Windows-led teams that want fast setup, auto-discovery, and clear sensor pricing.
- Nagios XI fits teams that already use Nagios plugins and want a supported commercial front end.
- Cloud teams should compare Datadog and Checkmk against open source tools, because per-host pricing changes the total fast at scale.
Quick comparison
| Pick | Great for | Pricing starts at | Free tier | |
|---|---|---|---|---|
 Zabbix | Free enterprise monitoring | Free | Yes | Visit |
 PRTG Network Monitor | Fast Windows setup | Free | Yes | Visit |
 Nagios XI | Nagios plugin shops | $1,995 one-time | No | Visit |
 Checkmk | Rule-based infrastructure monitoring | Free | Yes | Visit |
 Icinga | Modern Nagios-style monitoring | Free | Yes | Visit |
 LibreNMS | Auto-discovered network graphs | Free | Yes | Visit |
 Datadog | Cloud and container observability | $15 per host per month | Yes | Visit |
 ManageEngine OpManager | Mixed vendor networks | See website | No | Visit |
 SolarWinds Network Performance Monitor | Large enterprise networks | See website | No | Visit |
The best zenoss alternatives
Zenoss covers infrastructure, network, and application monitoring with event management and service views. Replacements split into open source platforms you run yourself, sensor or device-priced commercial tools, and cloud observability suites. The right pick depends on team skills, device count, and whether you need cloud, container, or traditional network depth most.
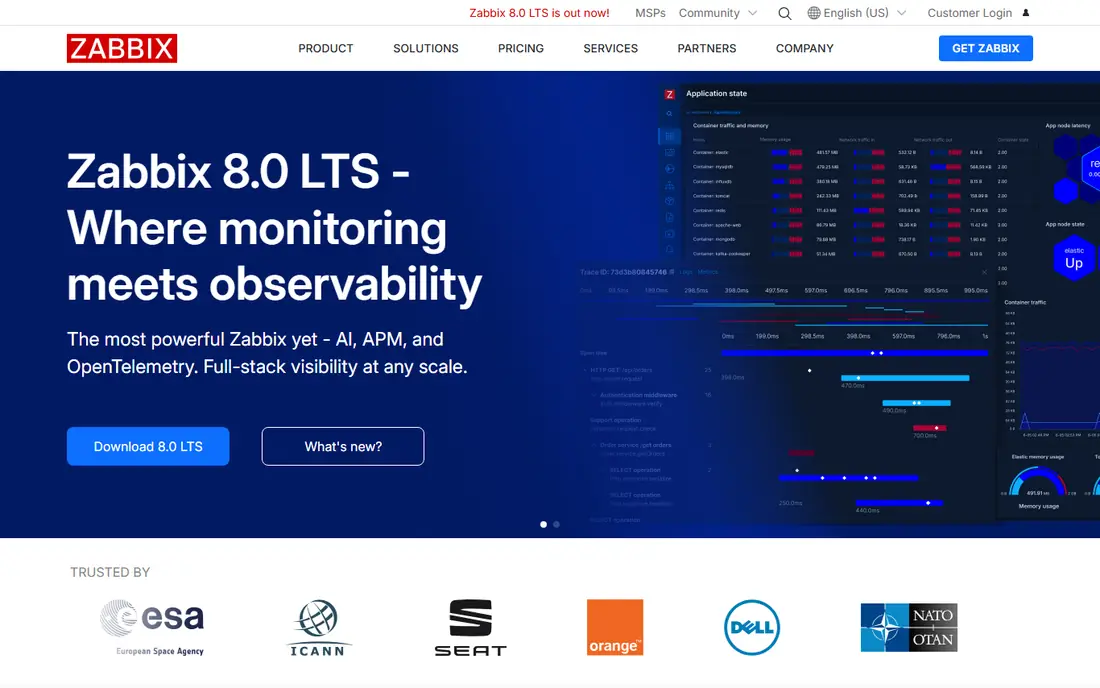
Zabbix is our pick for teams with Linux skills that want enterprise monitoring without a license bill. You can monitor servers, network devices, cloud instances, and services from one system, use templates to apply standard checks quickly, and scale with proxies for remote sites. The community and documentation are large, which helps when you hit a tricky device type.
The cost is time, not money. Initial setup, template tuning, and database care need an engineer who owns the system, and a poorly tuned setup can flood you with alerts. Teams that invest that time get a very capable platform for free, while teams without that skill should look at PRTG or a managed option.
- No license cost for the core platform
- SNMP, agents, ICMP, and HTTP monitoring
- Distributed monitoring and auto-discovery
- Setup and tuning take real Linux skill
- Interface and templates need time to learn
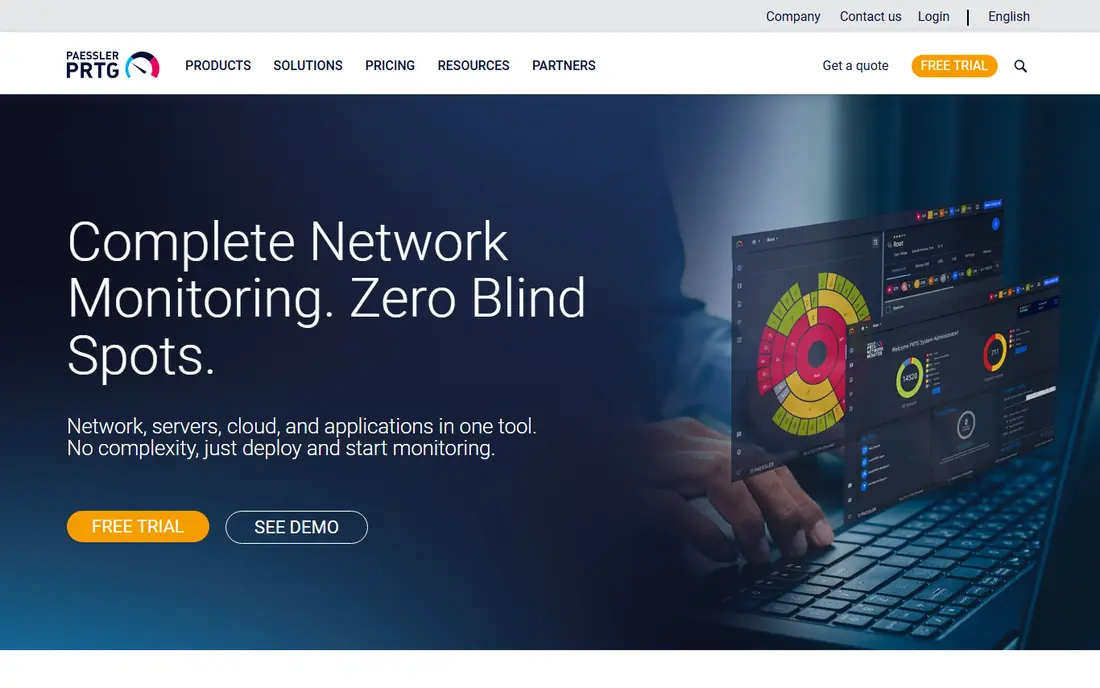
PRTG suits a Windows-led IT team that wants monitoring running this week, not next quarter. Install, run auto-discovery, and you get sensors for ping, SNMP, traffic, and common services with maps that managers can read at a glance. The free tier covers up to 100 sensors, which is enough for a small network test.
Sensor math is the catch. Each metric counts as a sensor, so a few dozen devices can use hundreds of sensors quickly, and paid tiers are priced by sensor bands. Count sensors during a trial, not devices, and compare the band price against Zabbix time cost before you commit.
- Free for up to 100 sensors
- Auto-discovery of devices and sensors
- Clear maps and dashboards for non-experts
- Sensor count grows fast and raises price
- Windows-centric history, though Linux options exist in its current offer
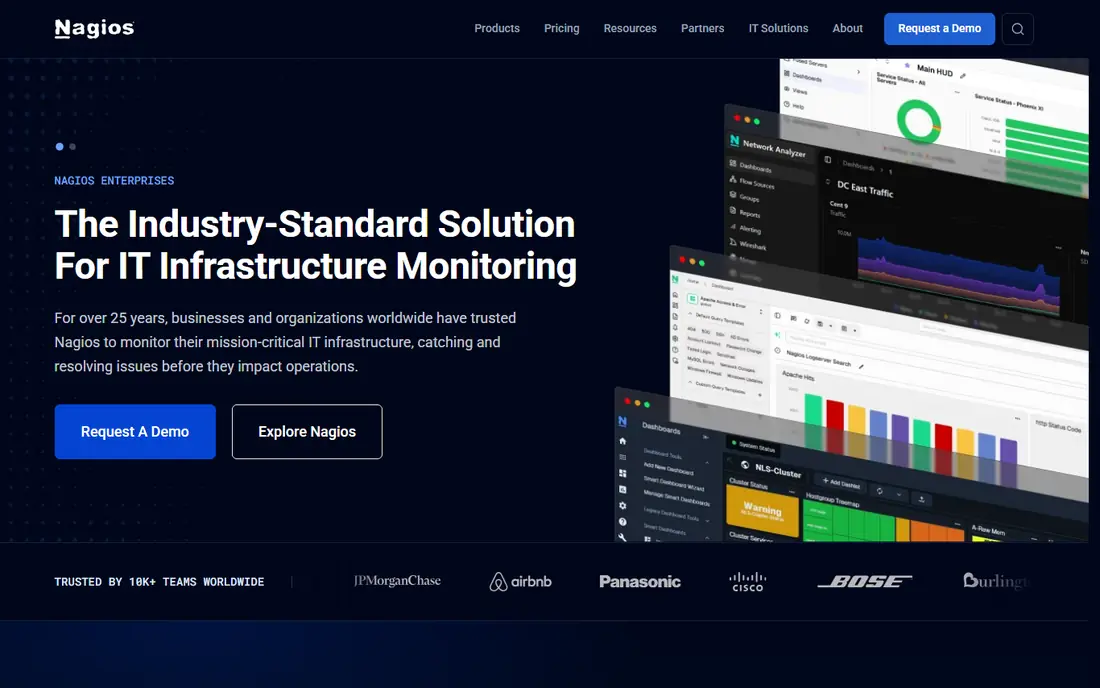
Nagios XI gives Nagios Core users a supported commercial front end with dashboards, reporting, and easier configuration than text files alone. The plugin library covers thousands of devices and services, so a team with existing Nagios checks can reuse that work instead of rebuilding it in a new tool.
It is not the most modern interface here, and large estates need careful planning around node counts and edition limits. Still, for a shop that already trusts Nagios checks and wants vendor support, XI is a safer move than a full platform change.
- Large plugin ecosystem for checks
- Commercial web interface and reporting
- Familiar for teams already on Nagios Core
- Configuration still feels older than Zabbix or Checkmk
- Per-node pricing on higher editions adds cost
Checkmk fits teams that manage many similar hosts and want one rule to configure them all. Instead of editing each host, you set rules for thresholds, notifications, and checks, and Checkmk applies them across groups. That approach scales well for distributed sites and mixed server and network estates.
The free Raw edition covers core monitoring, while paid editions add features such as advanced automation and reporting. Teams should trial the edition that holds the features they need, because the gap between Raw and Enterprise matters for larger operations.
- Free Raw edition for core monitoring
- Rule-based configuration for large estates
- Strong agent and SNMP coverage
- Enterprise features need a paid edition
- Learning rules takes time for new users
Icinga began as a Nagios fork and grew into a modular platform with a cleaner web interface and a strong API. You can automate host creation, build custom dashboards, and run distributed monitoring across sites, all on free core software. Nagios plugin compatibility also eases migration for existing Nagios users.
Enterprise modules and support are subscription-based, so a team that needs those extras should price the subscription, not just the free core. For a technical team that values API automation, Icinga is a strong, modern Nagios-style choice.
- Free core platform with modern web interface
- REST API for automation
- Distributed monitoring for multiple sites
- Paid subscriptions needed for some enterprise modules and support
- Setup needs technical skill
LibreNMS is loved by network engineers for one reason: point it at a network, and it discovers devices and builds detailed graphs quickly. SNMP polling, traffic graphs, alerting, and device health views work well for switches, routers, firewalls, and wireless gear, with little manual template work.
It is less of a full infrastructure suite than Zabbix or Checkmk. Server metrics, application checks, and business service views are thinner, so many teams pair LibreNMS for network graphs with another tool for servers. For a network-first job, though, it is hard to beat for free.
- Free open source platform
- Fast auto-discovery with detailed SNMP graphs
- Good for network engineers
- Server and application depth is thinner than Zabbix
- Needs Linux care and updates
Datadog suits cloud and container teams that need one view across hosts, containers, applications, and network traffic. Infrastructure monitoring starts at the entry per-host price, with logs, APM, synthetics, and network monitoring as separate products that add to the bill. The integration library is very broad, which shortens setup for cloud stacks.
Cost is the main risk. A team that turns on many products across many hosts can see a large monthly bill, so start with infrastructure only, set usage alerts, and add products one at a time. For cloud-native work, the unified view is worth that discipline, but for a traditional network, Zabbix or PRTG will cost far less.
- Unified metrics, logs, traces, and network data
- Strong cloud and Kubernetes coverage
- Large integration library
- Per-host and per-feature pricing grows fast
- Cost control needs active management
OpManager fits mid-sized teams with mixed Cisco, Juniper, HP, and other vendor gear. Discovery, performance graphs, fault alerts, and dashboards cover network, server, and virtual environments, with add-ons for traffic analysis and configuration management. That breadth helps a team that wants one vendor for network operations.
Pricing depends on device packs and edition, so the public page alone does not give a single starting price for every estate. Request a quote for your actual device count, trial it on your hardest device types, and compare the total against Zabbix plus staff time.
- Broad device support across vendors
- Automated discovery and dashboards
- Add-ons for flow, firewall, and storage monitoring
- Pricing varies by device pack and edition
- Interface can feel busy for small teams
SolarWinds NPM suits large enterprises with complex, multi-vendor networks that need deep diagnostics. NetPath traces a path across devices and clouds, traffic analysis shows where bandwidth goes, and reporting covers capacity and performance for management reviews. That depth is the reason many large network teams stay with it.
It is quote-priced and heavier to run than open source tools, so small teams should not start here. For a large enterprise that needs vendor support, deep network views, and a proven reporting set, NPM remains a serious Zenoss alternative.
- Deep network diagnostics and NetPath views
- Strong reporting for large estates
- Broad vendor device support
- Quote-only pricing for most estates
- Needs Windows infrastructure and planning for scale
How we picked these
We compared official feature and pricing pages, plus public reviews on setup effort, scaling, and device support. We kept tools that are live in October 2026, that monitor networks, servers, or infrastructure as a core job, and that offer a realistic Zenoss replacement for at least one common estate type. We left out uptime-only tools, log-only tools, and tools with no clear current product page.
What to check before you switch
Start with device count and type, not with a feature list. Count switches, routers, servers, virtual hosts, and cloud instances, then check how each candidate prices that count, whether by sensor, device, host, or free open source. Trial the tool on your hardest devices first, including an older switch or a firewall with tricky SNMP settings, because a tool that handles easy devices but fails on hard ones will not survive production.
Tune alerts before you go live
A new monitoring tool that alerts on everything will be ignored within a week. Set thresholds from a baseline week of data, group related alerts, and define who gets paged versus who gets an email summary. Test one real incident end to end, from alert to dashboard to fix, before you switch off the old system.
Plan data retention and scale
Check how long metrics are kept, how much disk a month of data uses, and how the tool scales when you add a new site. Open source tools need database care, sensor-priced tools need sensor audits, and cloud tools need usage caps. A short retention and scale check now avoids a painful migration later when history is missing or costs spike.
Frequently asked questions
What is the best free Zenoss alternative?
Zabbix is the best free alternative for most teams, because it offers enterprise monitoring, SNMP, agents, and distributed monitoring with no license cost. LibreNMS is best for network-only graphs, while Icinga and Checkmk Raw are strong free options for Nagios-style and rule-based shops.
Is PRTG cheaper than Zabbix?
PRTG can be cheaper in staff time, but not in license cost, because Zabbix itself is free. PRTG charges by sensor bands, while Zabbix costs engineer time for setup and care. Compare the PRTG band price for your sensor count against the staff time Zabbix needs in your team.
Does Nagios XI replace Zenoss for large networks?
Yes, for teams already on Nagios, XI can replace Zenoss with a supported interface and a large plugin library. Teams without Nagios history may prefer Zabbix or Checkmk, which offer more modern configuration and scaling for a fresh deployment.
Which tool is best for cloud and Kubernetes monitoring?
Datadog is best for cloud and Kubernetes work in this list, because it unifies infrastructure, logs, traces, and network data with broad cloud integrations. Zabbix and Checkmk can monitor cloud hosts too, but they need more manual work for container-native views.
How do I avoid alert overload after switching?
Baseline thresholds for a week, suppress duplicate alerts from the same device, and separate paging alerts from daily summaries. Review alert volume weekly for the first month, tune the noisiest checks first, and keep only alerts that require a human action.
Sources
- https://www.zabbix.com/pricing
- https://www.paessler.com/pricing
- https://www.nagios.com/products/nagios-xi
- https://www.checkmk.com/pricing
- https://www.icinga.com/pricing
- https://www.librenms.org
- https://www.datadoghq.com/pricing
- https://www.manageengine.com/network-monitoring/pricing
- https://www.solarwinds.com/network-performance-monitor/pricing
See where you really rank - block by block
ProMapRanker scans Google Maps across a grid of your service area. Simple monthly plans from $19, white-label on every plan.
Start freeKeep reading
 zoro.to alternatives
Best Zoro.to Alternatives in 2026
We compare the best zoro.to alternatives in 2026, listing only legal licensed anime streaming services, from Crunchyroll to free options for fans today.
Read → zip alternatives
Best Zip Alternatives in 2026
We compare the best zip alternatives for buy now, pay later in 2026, covering pay-in-4 plans, fees, spending limits, and credit reporting options today.
Read → yesware alternatives
Best Yesware Alternatives in 2026
Compare the best yesware alternatives for sales email tracking, templates, and sequences, with current pricing and honest tradeoffs for small sales teams.
Read →