 ProMapRanker
Who Offers the Best Network Monitoring Service in 2026

Key takeaways
- The best network monitoring service depends on your environment: cloud, on-premises, hybrid, or managed service provider.
- Per-device, per-sensor, and per-host pricing are not directly comparable, so model your real device count before budgeting.
- Auto-discovery, live topology maps, and useful alerts matter more than a long feature list.
- Open-source tools save license fees but need staff time for setup, tuning, and maintenance.
- A free trial on your own network tells you more than a demo on a vendor sample network.
Quick comparison
| Pick | Great for | Pricing starts at | Free tier | |
|---|---|---|---|---|
 Datadog | Cloud and hybrid observability | See website | No | Visit |
 SolarWinds Network Performance Monitor | Deep on-premises network analytics | See website | No | Visit |
 Paessler PRTG | Sensor-based flexibility | See website | Yes | Visit |
 Auvik | MSP and multi-site networks | See website | No | Visit |
 ManageEngine OpManager | Budget mid-market monitoring | See website | No | Visit |
 Zabbix | Open-source full control | Free | Yes | Visit |
 LogicMonitor | Enterprise hybrid monitoring | See website | No | Visit |
The best network monitoring services
Network monitoring answers a simple question: what is up, what is slow, and what changed. The services below cover routers, switches, firewalls, servers, and cloud traffic with different deployment models and pricing. We compared official feature pages, pricing pages, documentation, and public reviews to build this list.
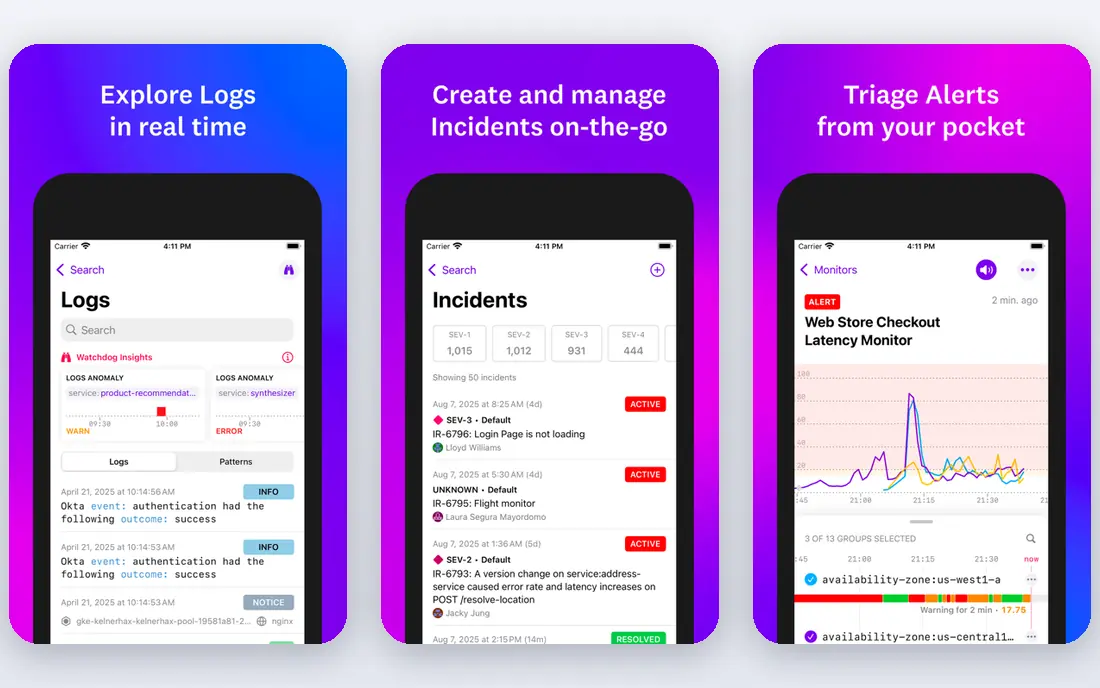
Datadog suits cloud-first teams that need network data beside application and infrastructure data. Its network monitoring covers host traffic, device monitoring, and flow data, and it correlates that data with logs and application traces in one interface. For a team already running cloud services, that correlation can shorten the time from alert to root cause.
The pricing model is the catch. Each module bills separately, by host, device, or usage, so a full setup costs more than the single network price suggests. Teams need tagging discipline and usage alerts to avoid surprise bills. For cloud and hybrid teams that want full-stack visibility, Datadog is our pick for most people in that category.
- Very broad integrations
- Network, infrastructure, logs, and APM in one platform
- Strong dashboards and alerting
- Modular pricing adds up fast
- Learning curve for new teams
- Usage costs need active monitoring
SolarWinds Network Performance Monitor
Great for: Deep on-premises network analytics
SolarWinds Network Performance Monitor, often called NPM, is built for large on-premises networks where deep diagnostics matter. It monitors routers, switches, and firewalls, maps network paths, and offers detailed performance analytics that help engineers find faults across complex estates. Organizations with an existing SolarWinds stack get added value from shared data and workflows.
Complexity is the honest weakness. Pricing is quoted rather than simple, modules add cost, and tuning alerts for a large network takes skilled staff. Smaller teams may find a simpler tool faster to run. For large enterprises with dedicated network engineers, SolarWinds NPM remains a serious option.
- Deep network diagnostics and NetPath analysis
- Strong for large on-premises estates
- Mature alerting
- Pricing is quoted and complex
- Setup and tuning take time
- Additional modules add cost
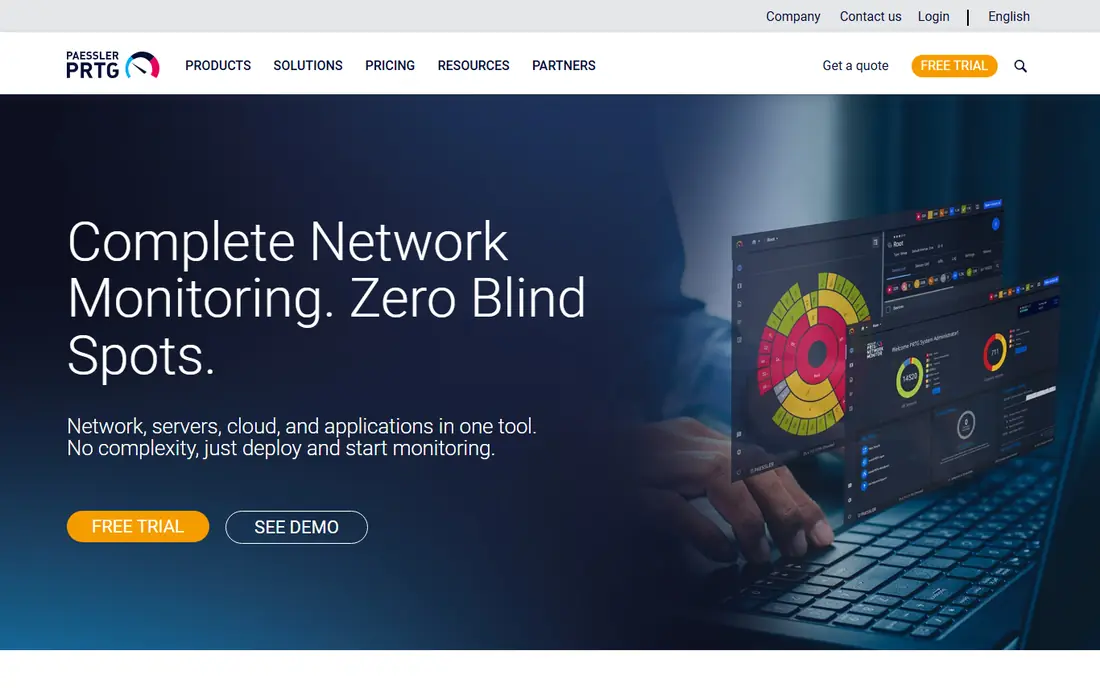
PRTG from Paessler is a practical middle ground for Windows-friendly teams and mixed networks. It auto-discovers devices, builds maps, and monitors with sensors for SNMP, flow, ping, and many other protocols. The free tier with 100 sensors lets a small network run real monitoring without a license, which is rare among commercial tools.
Scaling is where sensor math matters. Each monitored metric uses a sensor, so a large network can need many sensors and a higher tier. Plan sensor counts before buying, and use sensor groups to keep the bill predictable. For small to mid-size networks that want a proven, sensor-flexible tool, PRTG is a strong pick.
- Free tier with 100 sensors
- Auto-discovery and maps
- Sensor model fits mixed environments
- Sensor count drives cost as you scale
- Windows-based server heritage
- Interface feels dated to some users
Auvik is designed for teams managing several sites or many clients. Its cloud platform auto-discovers devices, draws live topology maps, backs up device configurations, and alerts on changes. That combination saves time for managed service providers and distributed IT teams, who otherwise juggle separate tools per site.
Per-device pricing is the limit for very large networks, since every monitored device adds to the bill. Auvik also focuses on network infrastructure rather than full application observability. For MSPs and multi-site teams that need clear maps and fast onboarding, Auvik is a natural fit.
- Cloud-managed with live topology maps
- Automated config backup
- Built for multi-site and MSP use
- Per-device pricing adds up for large estates
- Less suited to deep application monitoring alone
ManageEngine OpManager suits mid-size organizations that want solid network and server monitoring without enterprise observability pricing. It covers routers, switches, servers, and virtual machines, with dashboards, alerts, and workflow automation. Per-device pricing is easier to model than usage-based pricing, and some editions offer perpetual licensing.
The interface is functional rather than slick, and it takes time to configure well for a large estate. Advanced features such as flow analysis and configuration management may need higher editions. For budget-conscious mid-market teams with on-premises infrastructure, OpManager offers strong value.
- Per-device pricing with perpetual options on some tiers
- Broad device support
- Workflow and alerting tools
- Interface can feel dense
- Advanced flow and configuration features sit on higher editions
Zabbix is the open-source pick for teams that want full control and no license fee. It monitors networks, servers, cloud instances, and applications with agents, SNMP, and other protocols, and it supports templates, triggers, and dashboards for large estates. Organizations with Linux skills can build a powerful system without per-device license costs.
Staff time is the real price. Installation, template tuning, alert design, and upgrades fall to your team, and paid support is separate. Teams without monitoring experience may struggle at first. For skilled teams that value openness and control, Zabbix is hard to beat on value.
- Free open-source core
- Highly customizable
- Scales to large networks with skilled staff
- Setup and tuning need Linux and monitoring skills
- Support is paid separately
- Interface takes learning
LogicMonitor fits hybrid enterprises that want SaaS convenience with on-premises coverage. Collectors run inside your network, while the cloud platform handles dashboards, alerting, and administration. Its LogicModules provide prebuilt monitoring for network devices, servers, storage, and cloud services, which shortens setup compared with a fully self-built stack.
Pricing is quoted, and custom devices still need tuning, so a trial with your real estate is essential. Model costs by resource count, not just by site count. For enterprises that want managed hybrid monitoring with broad device coverage, LogicMonitor is a credible choice.
- SaaS platform with collectors on site
- Prebuilt LogicModules for many devices
- Hybrid coverage
- Quoted pricing
- Custom environments still need tuning
- Per-resource costs need modeling
How we picked these
We compared official feature pages, pricing models, documentation, and public reviews for services that monitor networks in production today. We favored tools with auto-discovery, alerting, and a clear deployment model, and we included open-source, mid-market, and enterprise options so different team sizes can compare fairly. We excluded tools with no verifiable current network monitoring offering.
How to choose the right network monitoring service
Start with your environment, not a feature list. Count devices, sites, and cloud accounts, and decide whether you want SaaS, on-premises, or hybrid deployment. A cloud team and an on-premises factory network need different tools, even if both say network monitoring on the box.
Next, run a trial on your own network. Check auto-discovery accuracy, map quality, alert noise in the first week, and how long it takes to find a real fault. A tool that floods your inbox with low-value alerts will be ignored, while a tool with clear, grouped alerts will actually get used. Test escalation, on-call routing, and reporting during the trial, not after purchase.
Finally, model total cost for three years. Include licenses, modules, support, and staff time for tuning. Open-source tools look free until staff time is counted, and usage-priced tools look cheap until traffic grows. The right service is the one your team will maintain, not the one with the longest feature page.
Frequently asked questions
Who offers the best network monitoring service overall?
There is no single winner, because cloud teams, MSPs, and large on-premises enterprises need different tools. Datadog fits cloud observability, Auvik fits multi-site MSP work, and PRTG or OpManager fit mid-size networks. Match the tool to your environment and team skills first.
Is open-source network monitoring good enough for business use?
Yes, for teams with the skills to run it. Zabbix and similar tools monitor large networks well, but they need setup, tuning, and maintenance time. Businesses without that staff time often save money overall with a managed or commercial tool.
What is the difference between per-device and per-sensor pricing?
Per-device pricing charges for each monitored device, while per-sensor pricing charges for each monitored metric on a device. A switch with many metrics can use many sensors but counts as one device. Model both against your real estate before comparing prices.
Do I need network monitoring if I already use cloud dashboards?
Cloud dashboards cover cloud resources, but they rarely cover on-premises switches, firewalls, and WAN links in the same view. Hybrid teams benefit from a tool that joins both sides. A single pane helps when a fault spans cloud and local networks.
How do I reduce alert noise from a new monitoring tool?
Start with a small set of high-value alerts, tune thresholds during the first weeks, and group related alerts by device or site. Review ignored alerts weekly and remove or fix the noisy ones. A quiet, trusted alert stream beats a loud stream that staff learn to ignore.
Should a small business buy network monitoring or use free tools?
A small network can start with a free tier such as PRTG with 100 sensors, or an open-source tool if staff skills allow. Buy a commercial tool when device counts grow, multi-site coverage matters, or support and reporting become business needs. Start small and upgrade when limits bite.
Sources
See where you really rank - block by block
ProMapRanker scans Google Maps across a grid of your service area. Simple monthly plans from $19, white-label on every plan.
Start freeKeep reading
 worlds best local seo company
8 Worlds Best Local SEO Companies for Map Pack Growth in 2026
Compare the worlds best local seo company options for Google Business Profile work, citations, reviews, and multi-location rankings and reporting in 2026.
Read → world's best web hosting company
World's Best Web Hosting Company in 2026
Searching for the world's best web hosting company? We compared 10 hosts on price, renewal rates, speed, and support to help you choose well today in 2026.
Read → who's got the best nanny tax services
Who's Got the Best Nanny Tax Services in 2026
We answer who's got the best nanny tax services, comparing full filing, back taxes, software, and pricing so families can handle nanny taxes correctly.
Read →