 ProMapRanker
Top Business Analytics Software in 2026


Visual dashboards and deep analysis · Pricing starts at: $15 per user per month
Key takeaways
- Power BI gives Microsoft shops the lowest paid starting price, while Tableau leads on visual depth at a higher per-user cost.
- Looker Studio and Metabase suit tight budgets, because both offer a free route for basic dashboards and reports.
- Zoho Analytics is the clearest value pick for small teams that already use Zoho apps and need ready connectors.
- Role-based pricing can change the total fast, so count viewers and creators separately before you commit.
Quick comparison
| Pick | Great for | Pricing starts at | Free tier | |
|---|---|---|---|---|
| Tableau | Visual dashboards and deep analysis | $15 per user per month | No | Visit |
 Microsoft Power BI | Microsoft 365 teams | $14 per user per month | Yes | Visit |
 Google Looker Studio | Free Google-based reporting | Free | Yes | Visit |
 Qlik Sense | Associative analysis | See website | Free trial | Visit |
 Domo | Company-wide dashboards | See website | Free trial | Visit |
 Sisense | Embedded analytics | See website | Free trial | Visit |
 Zoho Analytics | Small teams on a budget | $30 per month | Yes | Visit |
 ThoughtSpot | Search-based analytics | See website | Free trial | Visit |
 Metabase | Open source dashboards | Free | Yes | Visit |
The best business analytics software
We compared official pricing pages, connector lists, and published feature guides to find tools that fit real small and mid-size business work, not only enterprise reporting.
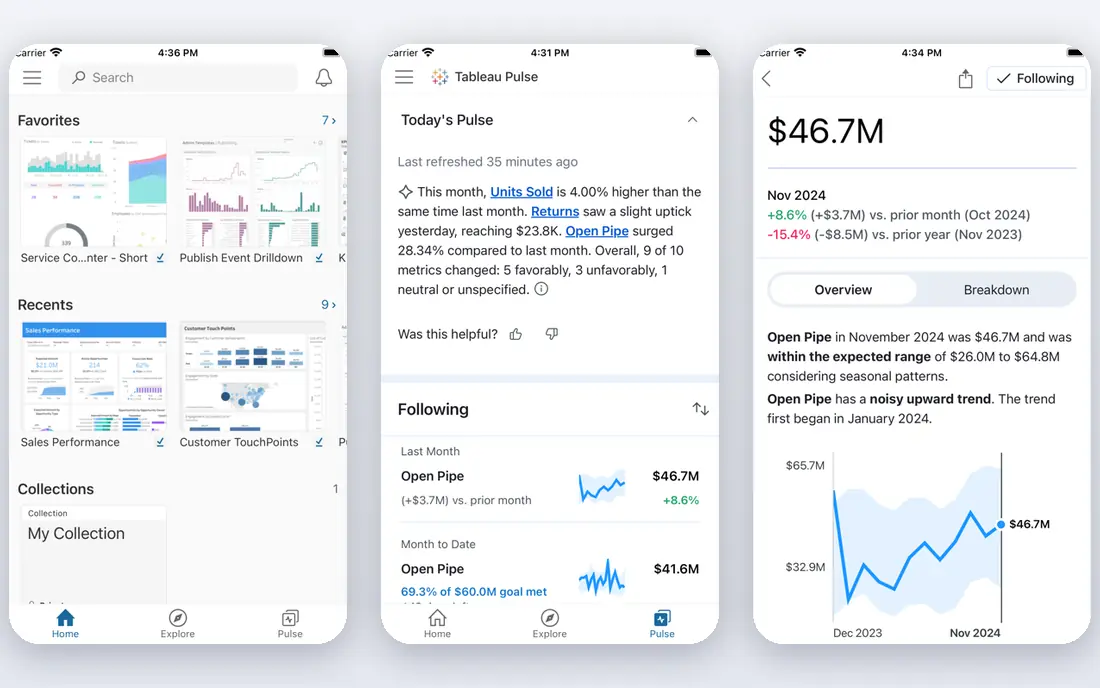
Tableau remains the visual standard for many analysts. Drag-and-drop charts, filters, and calculated fields make it easier to turn a messy spreadsheet into a dashboard that managers can read at a glance. The community, templates, and public gallery also help new users learn by example rather than starting from a blank page.
The catch is price and structure. Viewer seats start at $15 per user per month, Explorer seats cost more, and Creator seats cost $75 per user per month on the Standard tier, all billed annually in the published pricing we checked. Small teams should start with one Creator and add Viewer seats only for people who need to read reports. If your team mostly reads dashboards, a cheaper tool may serve you just as well.
- Strong visual design
- Wide connector range
- Large learning community
- Creator seats cost much more
- Licensing can feel complex for small teams

Power BI is the natural pick for teams that already live in Excel, Teams, and SharePoint. Reports built in the free Desktop app can be published and shared once users have Pro seats, and the familiar Microsoft interface keeps training time short. Data modeling with Power Query also suits teams that already clean data in Excel.
Sharing is where the cost appears. The free tier covers personal building, but colleagues who view shared reports generally need Pro at $14 per user per month, or Premium Per User at $24 per user per month for larger models and more refreshes. Count every viewer before you budget. For a Microsoft shop, that math still often beats Tableau, but it is not free at team scale.
- Low Pro price
- Tight Excel and Teams links
- Free Desktop app for building
- Sharing needs paid seats
- Advanced work can require Premium capacity

Looker Studio is the best free starting point for marketing and sales reporting. It connects directly to Google Analytics, Google Sheets, and other Google sources, and sharing a report is as simple as sharing a document link. For a small business that needs weekly traffic, sales, and campaign views, it often does the whole job.
Its limits show up with larger or more complex data. Modeling options are thinner than Power BI or Tableau, and very large data sets can slow a report down. Treat Looker Studio as a reporting layer, not a full data warehouse tool. If you outgrow it, you can move the same questions into a paid platform later without losing your habits.
- Free to use
- Simple Google Sheets and Analytics links
- Easy sharing
- Limited advanced modeling
- Performance can slow on large data sets
Qlik Sense stands out for exploration. Its associative engine lets users click a value and see how every related chart changes, which helps analysts spot patterns that fixed filters can hide. Data loading and transformation tools are also solid for teams that pull from several systems at once.
The main drawback is pricing clarity. Qlik sells through quotes and trials, so small teams cannot easily compare a monthly figure before talking to sales. The interface also rewards training, and casual users may need a short onboarding period. Pick Qlik when your analysts want to explore freely, not when you only need a few fixed weekly charts.
- Fast associative exploration
- Strong data loading
- Good for analysts
- Pricing is quote-based
- Interface takes time to learn
Domo aims to put sales, marketing, finance, and operations numbers in one place. Its connector library covers many common business apps, and its mobile app makes it practical for managers who check numbers away from a desk. Alerts can flag a missed target without waiting for a weekly meeting.
Pricing is the trade-off. Domo is sold by quote, with a free trial for evaluation, and small teams often find it priced above simpler tools. It fits best when several departments need one shared view and you are ready to pay for that breadth. A single-department team will likely get the same result for less elsewhere.
- Many built-in connectors
- Mobile-friendly dashboards
- Alert options
- Quote-based pricing
- Can be costly for small teams
Sisense works well for companies that want analytics inside their own product or customer portal. Embedded dashboards, white-label options, and a broad data layer make it a common choice for software teams. Internal teams also benefit from its ability to join data from databases, files, and cloud apps.
Setup is the honest catch. Sisense is quote-based, and a full deployment can need data help at the start, especially if your sources are messy. It is a strong pick for product and data teams with a clear embedding goal. For a simple internal dashboard, a lighter tool will be faster to launch.
- Strong embedding options
- Handles varied data sources
- Flexible dashboards
- Quote-based pricing
- Setup can need technical help
Zoho Analytics gives small teams a published price ladder that is easy to read. The free plan covers 2 users and 10,000 rows, and the Basic plan costs $30 per month with more rows and connectors. If you already use Zoho CRM, Books, or other Zoho apps, the built-in links save setup time and keep reporting close to daily work.
Row limits matter as you grow. The Basic tier covers half a million rows, and higher tiers raise that cap at higher monthly prices. Teams with very large sales or web data should check row counts before choosing a tier. For most small businesses, though, Zoho Analytics offers a clear path from free to paid without a sales call.
- Low published pricing
- Free plan for 2 users
- Many Zoho connectors
- Row limits on lower tiers
- Fewer advanced features than enterprise tools
ThoughtSpot lets business users type questions in plain language and get charts back, which lowers the barrier for managers who do not want to learn a query language. Saved answers, pinboards, and alerts turn one-off questions into repeatable views. For teams where analysts are a bottleneck, that self-service angle is the main appeal.
Good results still depend on good data. ThoughtSpot works best when tables are modeled clearly, with sensible names and joins, and quote-based pricing makes small-team budgeting harder. Try the trial with your own data, not only demo data, before you judge it. If your data is clean, it can cut waiting time for routine questions.
- Search-style questions
- AI-assisted answers
- Business-user friendly
- Quote-based pricing
- Needs clean modeled data to work well
Metabase is a friendly open source option for teams that want dashboards without a large bill. The question builder lets non-technical users filter and group data without writing SQL, while analysts can still drop into SQL when they need to. Dashboards and saved questions are simple to share inside a company.
The open source edition is free to self-host, and paid cloud and enterprise tiers add features such as permissions, serialization, and support. Self-hosting means your team owns updates, backups, and security, which is a real cost in time. If you have basic technical help, Metabase is a strong low-cost route to solid internal reporting.
- Free open source edition
- Simple question builder
- Easy dashboard sharing
- Advanced features sit in paid tiers
- Self-hosting needs upkeep
How we picked these
We checked official pricing pages, free plans, connector lists, and published product documentation for each tool, and we left out tools that are no longer sold or that only fit one narrow niche. We favored tools that a small or mid-size business can actually buy and run, with a mix of free, mid-price, and enterprise options. Prices change, so confirm the current page before you buy.
What to check before you buy
Start with the questions you answer every week, not with a feature list. Write down the five reports your team actually opens, the sources they draw from, and who needs to edit versus only view them. That list will show whether you need a free reporting tool, a mid-price platform, or an enterprise system with strict permissions.
Next, test with your own data during a trial. Connect your real sales, marketing, or finance source, build one dashboard, and share it with two colleagues. Watch for slow loads, confusing filters, and missing connectors. A tool that looks polished on demo data can still struggle with your field names, date formats, or row counts.
Finally, price the whole team, not one seat. Add creators, editors, and viewers, plus any capacity or embedding fees, and ask about renewal terms. A low per-user price can still grow fast when every viewer needs a paid seat. A short trial and a clear seat count will save more money than any discount negotiation later.
Frequently asked questions
Which software is best for business analytics?
It depends on your stack and budget. Power BI suits Microsoft teams, Tableau suits visual analysis, Looker Studio suits free Google reporting, and Zoho Analytics suits small teams that want published pricing.
What is the best business analytics platform for my business?
Pick the platform that connects to your current tools and matches your viewer count. A small team with a few reports often does well on Looker Studio, Metabase, or Zoho Analytics, while larger teams may need Power BI, Tableau, or Domo.
What are the best business analytic tools for beginners?
Looker Studio and Metabase are the gentlest starts, because both let you build charts without deep modeling knowledge. Power BI is also friendly for Excel users, since many concepts carry over from spreadsheets.
Which software is best for business analytics on a small budget?
Looker Studio is free, Metabase offers a free open source edition, and Zoho Analytics offers a free plan for 2 users. Start there, then move up only when row limits, permissions, or sharing needs force a change.
Do I need a data warehouse to use these tools?
No, not at first. Spreadsheets, CRM exports, and direct app connectors cover most small business reporting. A warehouse becomes useful later, when data volume grows or several systems need one clean source of truth.
Sources
See where you really rank - block by block
ProMapRanker scans Google Maps across a grid of your service area. Simple monthly plans from $19, white-label on every plan.
Start freeKeep reading
 zscaler alternatives
Best Zscaler Alternatives in 2026
Looking for zscaler alternatives? We compare 9 SASE and zero trust platforms on architecture, data protection, pricing, and fit for your network and team.
Read → zapier alternatives free
Best Zapier Alternatives Free in 2026
Nine automation tools for zapier alternatives free in 2026, all with genuinely free tiers, plus free plan limits, starting prices and upgrade paths explained.
Read → which platform is best for online reputation
Which Platform Is Best for Online Reputation in 2026
Wondering which platform is best for online reputation? We compare 8 review, listing, and response tools for small and multi-location businesses and agencies.
Read →