 ProMapRanker
Best SolarWinds Alternatives in 2026


Cloud observability with network data · Pricing starts at: $15 per host per month
Key takeaways
- Zabbix and PRTG are the best starting points for most teams, with open source depth on one side and easy setup on the other.
- Datadog, Dynatrace and LogicMonitor suit cloud and hybrid estates where app, host and network data belong in one platform.
- Sensor, device and host pricing differ sharply, so count sensors and devices before comparing headline prices.
- Auvik suits MSPs and multi-site teams that need live topology maps and config backup without building their own platform.
Quick comparison
| Pick | Great for | Pricing starts at | Free tier | |
|---|---|---|---|---|
| Datadog | Cloud observability with network data | $15 per host per month | Yes | Visit |
 Zabbix | Free open source monitoring | Free | Yes | Visit |
 PRTG | Easy sensor-based monitoring | $200 per month | Yes | Visit |
 Nagios XI | Plugin-based monitoring for existing Nagios shops | See website | No | Visit |
 ManageEngine OpManager | Mid-market device monitoring | See website | Free trial | Visit |
 LogicMonitor | Hybrid infrastructure monitoring | $16 per hybrid unit per month | Free trial | Visit |
 Dynatrace | Full-stack monitoring with network context | $29 per host per month | Free trial | Visit |
 Auvik | MSP and multi-site network mapping | See website | Free trial | Visit |
The best solarwinds alternatives
SolarWinds Network Performance Monitor is known for SNMP polling, network maps and diagnostics for large on-prem networks. The tools below cover the same ground, from free open source monitoring to SaaS observability platforms, with different strengths in setup, scale and price. None of them is SolarWinds itself, and all of them were available in October 2026.

Datadog suits cloud and container teams that already monitor apps and hosts and want network data beside that telemetry. Its network monitoring covers host agents, SNMP device data and synthetics, so a team can trace a network issue into app and infrastructure impact in one place. That unified view is the main reason to choose Datadog over a network-only tool.
The bill needs watching. Infrastructure pricing is per host, while logs, metrics volume and other products add usage charges, so a network-only buyer may pay for platform breadth they do not use. If your estate is cloud-first and you already use Datadog, adding network monitoring is a natural step. If you only need network polling, a cheaper network tool may serve you better.
- Host, network and app data in one platform
- SNMP device monitoring
- Synthetics and dashboards
- Usage-based add-ons can raise the bill
- Network features sit inside a larger platform price
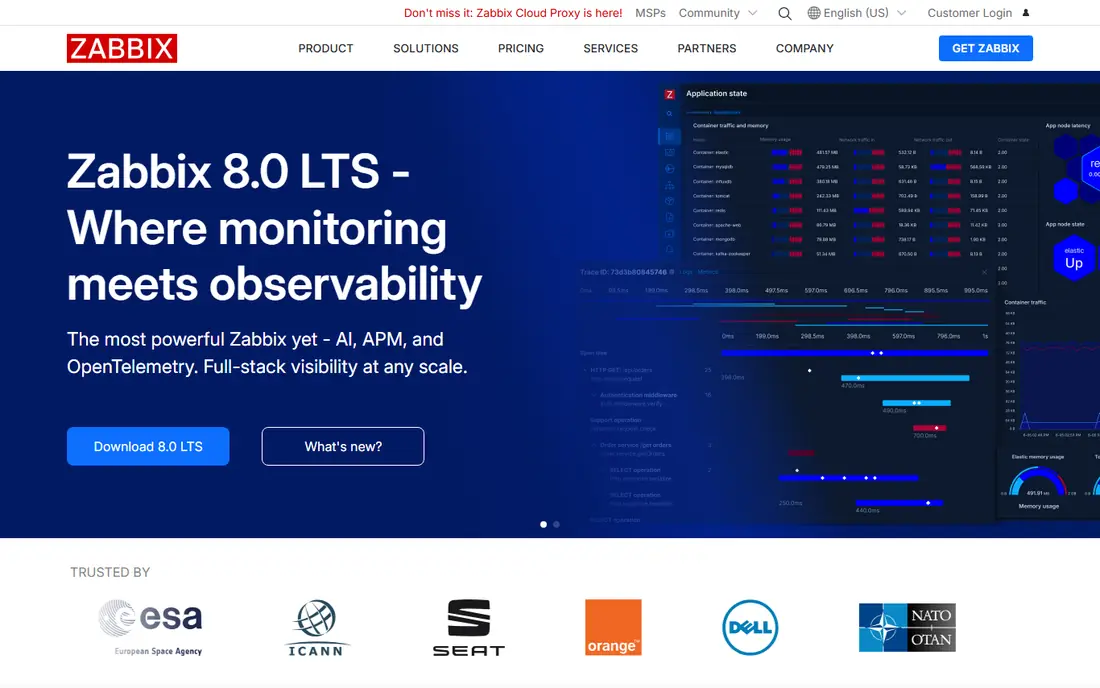
Zabbix is our pick for teams with a zero licence budget and the skill to run it. It monitors networks, servers, virtual machines and cloud services through SNMP, agents and APIs, with templates, triggers and dashboards that scale to large estates. There is no licence meter for discovering another switch, which makes it attractive for growing networks.
The cost is staff time. Designing templates, tuning triggers, sizing a database and handling upgrades all fall to your team, and that work can outweigh licence savings for a very small IT department. For an experienced Linux team, Zabbix is a powerful, free platform. For a two-person team covering many other duties, a managed tool may be cheaper in total effort.
- Free and open source
- SNMP, agents, IPMI and API collection
- Servers and network in one tool
- Setup and tuning take real Linux skill
- Interface feels dated to some users
- Support is paid
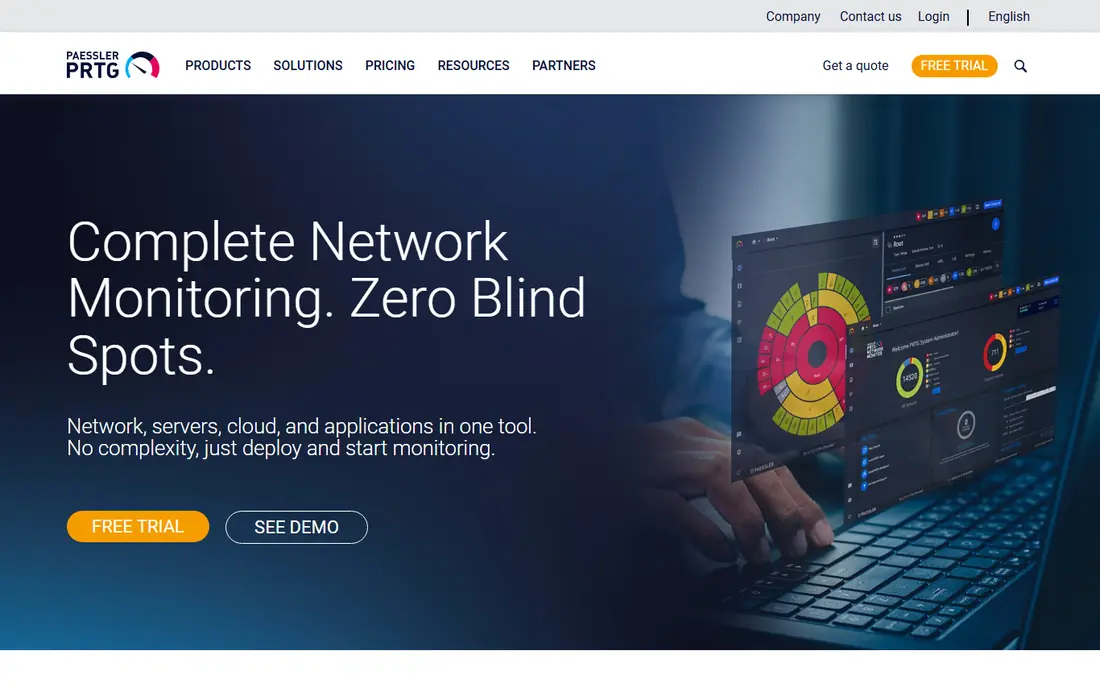
PRTG, from Paessler, is the easiest commercial route for small and mid-sized networks. Auto-discovery finds devices, ready-made sensors cover SNMP, flow, servers and applications, and maps and dashboards are built in. A free tier covering 100 sensors suits a small network of a handful of devices, and paid tiers scale by sensor count.
Sensor math is the trap. A sensor is one monitored item, such as interface traffic or CPU load, so a single 48-port switch can consume many sensors. Count sensors during a trial, not devices, and size the tier from that count. If your sensor count is modest and your team wants a friendly setup, PRTG is a strong, explainable buy.
- Auto-discovery and ready-made sensors
- Free tier for 100 sensors
- Maps and dashboards built in
- Sensor counting can surprise new buyers
- Windows-centric deployment
- Costs rise with sensor count
Nagios XI is the commercial upgrade path for teams that already run Nagios Core. It adds a web interface, dashboards, reporting and configuration tools on top of the plugin ecosystem that Nagios is known for, so existing checks and plugins largely carry over. For a shop with years of Nagios investment, that continuity matters more than a shinier interface elsewhere.
New buyers face a steeper climb. Configuration still takes more work than a SaaS tool with auto-discovery, and pricing is per node, so a quote check is needed for your device count. If you already run Nagios, XI is a natural step. If you start fresh, Zabbix or PRTG will likely get you live faster.
- Huge plugin ecosystem
- Familiar to Nagios Core users
- Flexible checks for any device or service
- Setup and config take more work than a SaaS tool
- Pricing is per node and needs a quote check
ManageEngine OpManager suits mid-market IT teams and MSPs with mixed vendor estates. It monitors routers, switches, firewalls, servers and virtual machines through SNMP, WMI and flow data, with device-based licensing and editions for multi-site and MSP use. That breadth helps a team with Cisco, Juniper, Fortinet and HP gear in one estate.
Pricing varies by edition, device pack and add-ons, so we list See website here rather than a single figure that would mislead. Check the edition that matches your device count, and price flow, firewall and wireless add-ons separately if you need them. For a mid-sized team that wants one tool for network and server monitoring, OpManager is a practical, widely used choice.
- Device-based licensing
- SNMP, WMI and flow support
- Multi-site and MSP editions
- Pricing varies by edition and device pack
- Interface can feel busy
- Add-ons increase the total
LogicMonitor is built for hybrid estates: on-prem servers, network gear and cloud resources in one SaaS platform. Auto-discovery is a genuine strength, and its hybrid unit model normalises different resource types into one meter, which makes budgeting easier than juggling separate device, host and cloud meters. Integrations cover a wide range of platforms and vendors.
It is less of an APM-first tool than Datadog or Dynatrace, so a team that needs deep application tracing should pair it accordingly or choose a different platform. For infrastructure and network monitoring across hybrid sites, though, LogicMonitor offers a clean SaaS route without on-prem servers to maintain.
- Strong auto-discovery
- Hybrid unit pricing for mixed resources
- Broad integration set
- APM depth is thinner than observability-first rivals
- Trial is short
- Pricing rises with resource count
Dynatrace suits complex estates where a network issue needs to be traced through app dependencies. Its infrastructure monitoring starts at a published per-host rate, while full-stack monitoring scales with host memory, so larger hosts cost more to monitor. Dependency mapping helps a team see which services and hosts sit behind a slow or failing path.
The commercial model needs care. There is no permanent free plan, only a trial, and paid use follows a platform subscription with an annual commitment. That model suits an enterprise that already plans a multi-year observability spend, but it is heavy for a small team that only needs network polling. For full-stack context at scale, Dynatrace is a leading choice.
- Full-stack and infrastructure monitoring
- Dependency mapping
- Network context beside app data
- No permanent free plan, only a trial
- Full-stack pricing scales with host memory
- Annual commitment model
Auvik is the pick for MSPs and multi-site teams that need to see a network clearly. It builds live topology maps automatically, backs up device configs, and runs through cloud-managed collectors, so a team can manage many sites without a heavy on-prem footprint. That mapping and config backup combination is especially useful when a team inherits a network it did not build.
Pricing is quoted per network device, so we list See website here, and costs can rise for very large estates. Auvik also focuses on network management rather than full app observability, so a team that needs deep APM should pair it with another platform. For network visibility across many sites, Auvik is one of the strongest tools here.
- Automated topology mapping
- Config backup and restore
- Cloud-managed collectors
- Quote-only pricing
- Per-device cost can rise at scale
- Less suited to app-level observability
How we picked these
We compared official pricing pages, feature pages and public roundups from October 2026, and we kept only tools that monitor networks, devices or infrastructure and that work today. We excluded SolarWinds itself, and we excluded pure uptime checkers that only ping a website. Prices are entry paid plans where published, and we used See website where a vendor quotes rather than publishes a price.
How to choose without a billing surprise
Count before you buy. For PRTG, count sensors. For device tools, count devices and interfaces. For host tools, count hosts and their memory size. A tool that looks cheap per device can become costly once interfaces, flows and add-ons are included, while a host-priced tool can look costly until you count how much app and log data it replaces.
Then run a trial on your real network, not a demo lab. Let auto-discovery find your devices, check whether topology maps match reality, and test alerts during a planned change. A tool that discovers cleanly and alerts usefully on your estate is worth more than a tool with a longer feature list that needs weeks of manual configuration to reach the same point.
Frequently asked questions
What is the best free SolarWinds alternative?
Zabbix is the best free alternative for a team with Linux skills, while PRTG offers a free tier for 100 sensors that suits a small network. Choose Zabbix for scale and depth, and PRTG for easier setup on a small estate.
Which alternative is best for MSPs?
Auvik is the strongest MSP pick here, thanks to automated topology maps, config backup and cloud-managed collectors across many sites. ManageEngine OpManager also offers an MSP edition for multi-client monitoring.
Can these tools monitor cloud networks as well as on-prem?
Yes, but depth varies. Datadog, Dynatrace and LogicMonitor cover cloud and hybrid estates well, while Zabbix, PRTG and Nagios XI are strongest on-prem and need extra work for cloud-native resources.
How does PRTG sensor pricing work?
PRTG charges by sensor, where one sensor is one monitored item such as interface traffic, CPU load or ping response. A single switch can use many sensors, so count sensors during a trial before choosing a tier.
Do I need a separate tool for app monitoring?
It depends on the tool. Datadog and Dynatrace cover app and network data in one platform, while network-focused tools such as Auvik, PRTG and Zabbix are best paired with an APM tool when deep app tracing matters.
Sources
See where you really rank - block by block
ProMapRanker scans Google Maps across a grid of your service area. Simple monthly plans from $19, white-label on every plan.
Start freeKeep reading
 zscaler alternatives
Best Zscaler Alternatives in 2026
Looking for zscaler alternatives? We compare 9 SASE and zero trust platforms on architecture, data protection, pricing, and fit for your network and team.
Read → zapier alternatives free
Best Zapier Alternatives Free in 2026
Nine automation tools for zapier alternatives free in 2026, all with genuinely free tiers, plus free plan limits, starting prices and upgrade paths explained.
Read → which platform is best for online reputation
Which Platform Is Best for Online Reputation in 2026
Wondering which platform is best for online reputation? We compare 8 review, listing, and response tools for small and multi-location businesses and agencies.
Read →