 ProMapRanker
Best Site24x7 Alternatives in 2026


Engineering teams needing one observability platform · Pricing starts at: $15 per host per month
Key takeaways
- Datadog and New Relic give the deepest application and infrastructure coverage, but their bills grow with hosts, users and data volume.
- UptimeRobot and Better Stack suit small teams that mainly need reliable uptime checks, alerts and status pages at a lower cost.
- PRTG and Zabbix suit network-led teams, with PRTG offering sensor-based licensing and Zabbix offering an open source core.
- Pingdom and Grafana Cloud sit in the middle, with Pingdom focused on website checks and Grafana Cloud built around open standards.
- Start with the checks you cannot miss, then test alert routing and status pages before you commit to a paid plan.
Quick comparison
| Pick | Great for | Pricing starts at | Free tier | |
|---|---|---|---|---|
| Datadog | Engineering teams needing one observability platform | $15 per host per month | Free trial | Visit |
 New Relic | Application teams that want a usable free tier | Free | Yes | Visit |
 Dynatrace | Large enterprises with complex environments | See website | Free trial | Visit |
 PRTG | Network-led IT teams | See website | Yes | Visit |
 Zabbix | Teams that want self-hosted open source monitoring | Free | Yes | Visit |
 UptimeRobot | Simple uptime monitoring on a budget | Free | Yes | Visit |
 Pingdom | Website performance and transaction checks | See website | Free trial | Visit |
 Better Stack | Uptime, incidents and on-call together | $29 per month | Yes | Visit |
 Grafana Cloud | Teams committed to open observability standards | $19 per month | Yes | Visit |
The best site24x7 alternatives
Site24x7 covers a lot in one bundle, from website uptime to servers, networks and applications. The tools below replace different parts of that bundle, so the right pick depends on what you monitor most.
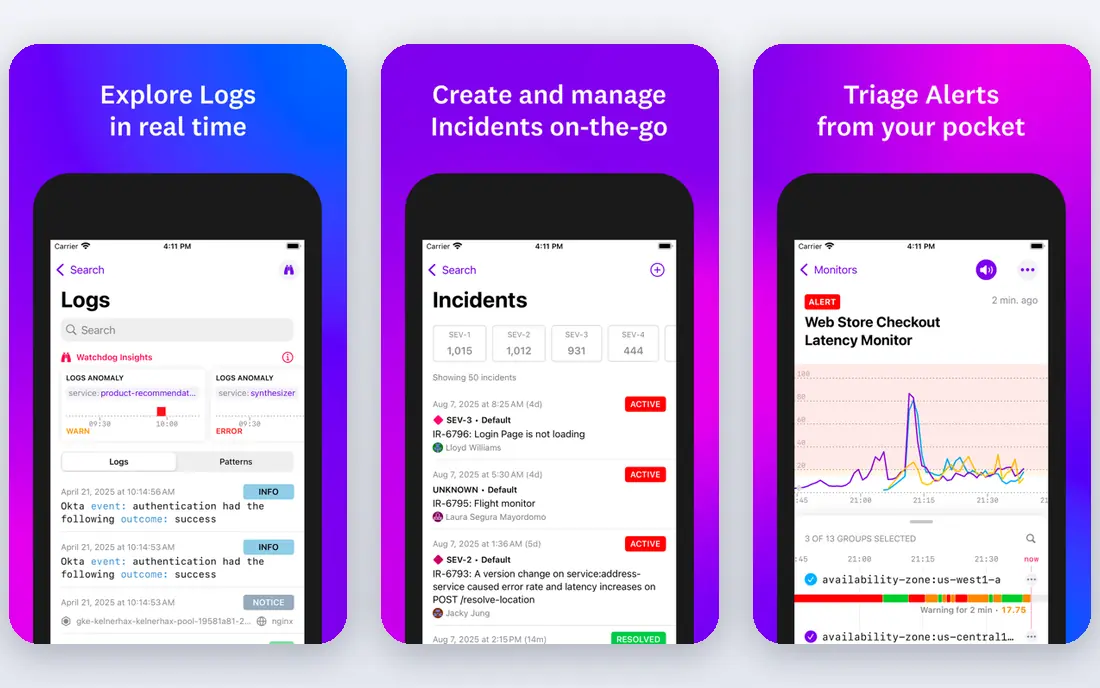
Datadog pulls infrastructure metrics, application traces, logs and synthetic checks into one platform, which helps a team trace a slow page back to a host, a service or a database query. Its integration library is wide, covering major cloud providers, containers, databases and common SaaS tools. For a growing engineering team, that breadth removes the need to stitch several tools together.
The catch is cost control. Hosts, ingested logs and extra products each add to the bill, so a team should set retention limits and usage alerts early. The interface also has a learning curve, since each product area has its own settings. Datadog fits best when one team owns monitoring end to end and can manage the budget as usage grows.
- Broad integrations
- Metrics, traces and logs in one view
- Strong dashboards and alerting
- Costs can rise quickly with usage
- Many products to learn
- Pricing is complex
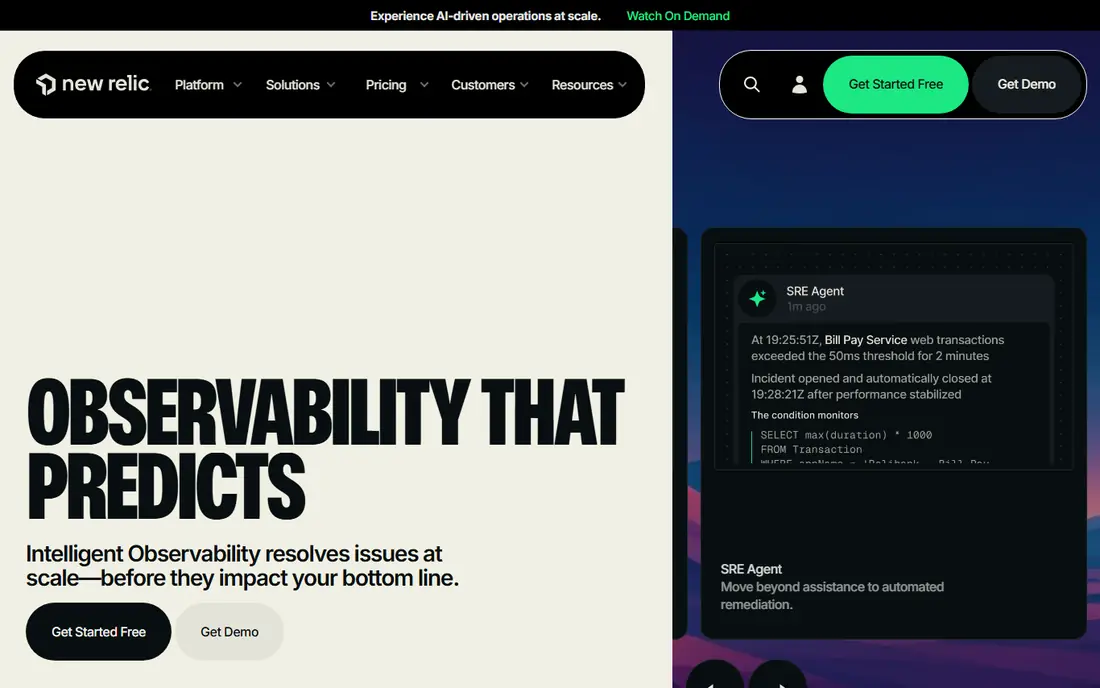
New Relic focuses on application performance, with dashboards that show slow transactions, errors and service dependencies in plain terms. Its free tier gives smaller teams room to monitor real applications without paying from day one. That makes it a practical first step for a team moving from basic uptime checks to application insight.
Paid plans are priced in part by user, so costs rise as more engineers need full access. Teams should also check which features sit on each tier before assuming a dashboard or alert option is included. For application-led teams that value a free starting point and clear performance views, New Relic is a strong choice.
- Generous free data allowance
- Clear application performance views
- Useful for smaller teams
- Paid user pricing can climb
- Advanced features sit on higher tiers
- Setup takes care for large estates
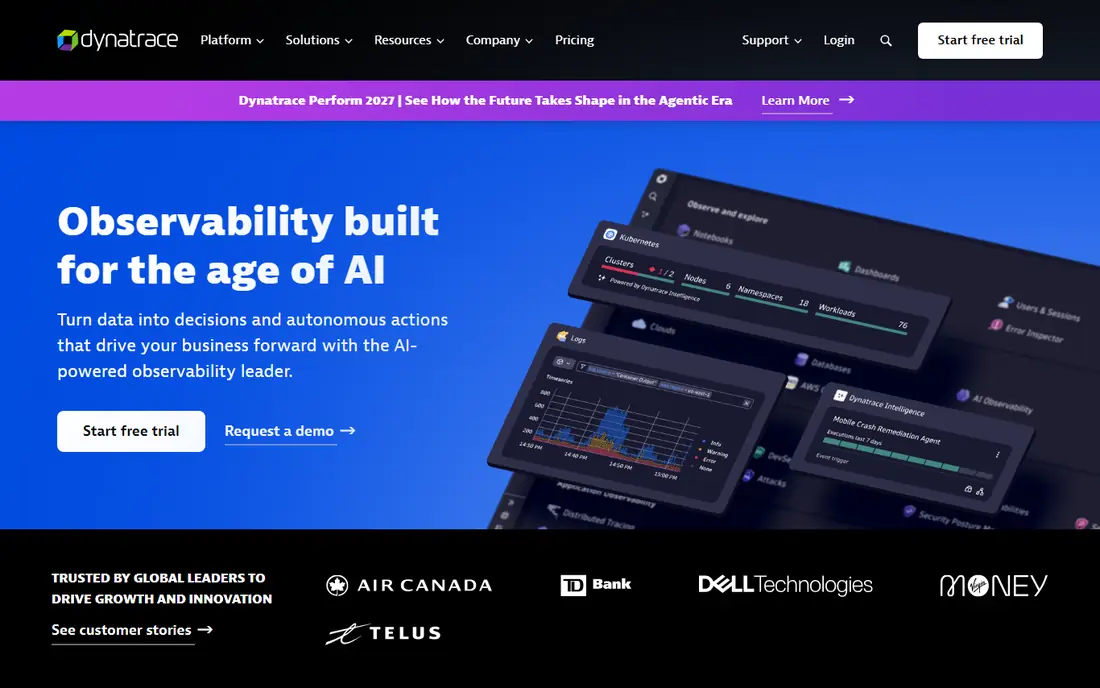
Dynatrace is built for large, tangled environments where services, hosts and cloud resources change often. It maps dependencies automatically and groups related alerts into a single problem, which can cut through noise during an incident. That automation matters most when a team manages hundreds of services and cannot maintain every monitor by hand.
Small teams will likely find it heavy and expensive. The platform rewards careful rollout, with roles, retention and access set up before it scales. For an enterprise that needs governance, deep application insight and automated root-cause hints, Dynatrace earns its place on the shortlist.
- Automatic service mapping
- Strong AI-assisted problem detection
- Broad enterprise coverage
- Enterprise pricing and complexity
- Overkill for small sites
- Implementation takes planning
PRTG takes a sensor approach, with each check counting as a sensor, from ping and HTTP to SNMP, NetFlow and hardware health. That model suits IT teams that manage switches, servers, printers and other devices alongside websites. The free tier covers small setups, which lets a team prove the tool before buying sensors.
The main limits are platform and scale planning. PRTG is a Windows-based product, and sensor totals grow faster than expected once every device gets several checks. Teams should list their devices and checks first, then size the license to that list. For network-first monitoring, PRTG remains a dependable and practical pick.
- Sensor-based coverage for networks and devices
- Many built-in sensor types
- Free tier for small setups
- Runs on Windows infrastructure
- Interface feels dated in places
- Sensor counts need planning
Zabbix is open source monitoring software for networks, servers, cloud resources and applications, and it runs on infrastructure you control. Templates, triggers and custom scripts give a skilled team a great deal of control over what gets checked and how alerts fire. There is no per-host license cost for the core product, which helps larger estates.
That freedom comes with responsibility. Your team installs, upgrades, backs up and secures the system, and the learning curve is real for new users. Paid support and services are available from the vendor for teams that want help. Zabbix fits best when in-house skill exists and control over hosting and data matters.
- No license cost for the core product
- Strong SNMP and custom checks
- Flexible templates
- Setup and upkeep fall on your team
- Interface takes time to learn
- Support is a paid extra
UptimeRobot keeps the job simple: it checks HTTP, keyword, ping, port, DNS and SSL endpoints and alerts you when one fails. The free plan covers 50 monitors, which is generous for a small business, a freelancer portfolio or a side project. Status pages are included, so visitors can see current availability without a separate tool.
It does not test multi-step journeys such as login and checkout in a real browser, so a page can return a success code while a key flow is broken. Paid plans shorten check intervals and add monitors and seats. For basic uptime coverage at low cost, UptimeRobot is hard to beat.
- Free plan with 50 monitors
- Easy setup
- Built-in status pages
- No browser transaction checks
- Check intervals are slower on free plan
- Depth is limited
Pingdom, part of SolarWinds, focuses on the visitor-facing side of monitoring: uptime, page speed and transaction checks that follow a journey through a site. That focus helps teams that care most about checkout, signup or booking flows working end to end. Alerts and status pages are straightforward, and the reporting is easy to share with non-technical colleagues.
It is not a full infrastructure platform, so server and network depth will need another tool if that matters. There is no permanent free plan, only a trial, and costs depend on the number and type of checks. Pingdom suits teams whose main risk is a broken website journey rather than a failing server.
- Clear website monitoring
- Transaction checks for key journeys
- Status pages included
- No free plan
- Focused on websites rather than servers
- Pricing rises with check volume
Better Stack combines uptime monitoring, status pages, incident management and on-call schedules in one product. That combination helps a small operations team move from alert to acknowledged incident to public status update without switching tools. It also offers logs, traces and real user monitoring for teams that want more context around an outage.
Pricing is built around responders and usage, so a larger on-call rota costs more, and telemetry volume needs watching. The integration list is narrower than the largest platforms. For a team that wants monitoring and incident response in one place, Better Stack is a tidy and modern option.
- Uptime checks plus incident management
- On-call schedules and escalation
- Logs and traces available
- Per-responder pricing adds up
- Telemetry costs need care
- Smaller integration list than Datadog
Grafana Cloud hosts the Grafana stack for metrics, logs, traces and dashboards, with a free tier for small teams. It fits teams already using Prometheus, Loki or OpenTelemetry, since those standards carry over without a full rebuild. Dashboards are flexible, and the same views can serve engineering, operations and product teams.
The trade-off is assembly. Grafana Cloud brings several products together, and a team still needs to decide what to collect, how long to keep it and how to alert on it. Usage beyond the free allowances adds cost. For standards-led teams that want control and portability, Grafana Cloud is a solid alternative.
- Built on Prometheus and OpenTelemetry
- Strong dashboards
- Free tier for small use
- Several pieces to configure
- Usage-based costs
- Support depth varies by plan
How we picked these
We compared official feature pages, pricing pages and app store listings, plus public reviews, to check that each product is live in October 2026 and covers part of what Site24x7 covers. We favored tools with clear monitoring, alerting and reporting, and we noted where pricing was quote-only instead of inventing a figure. We did not claim hands-on testing, and we kept products that fit a distinct need rather than listing near-duplicates.
What to check before you switch
Start by listing every check you rely on today, including websites, APIs, servers, network devices and key user journeys. That list decides the category: uptime-only tools suit a handful of public pages, while infrastructure and application platforms suit servers, containers and code. Next, test alerts with a real failure, not just a setup screen, and confirm who gets paged, how escalation works and how a status page updates.
Check retention and pricing limits in the same pass. Ask how long metrics, logs and uptime history are kept, what happens when you pass a monitor or data limit, and how annual billing changes the monthly figure. Finally, run a short trial with your own sites and services, and keep the old monitors running until the new alerts have fired correctly at least once.
Frequently asked questions
Is there a free alternative to Site24x7?
Yes. UptimeRobot, Zabbix and New Relic all offer free tiers, and Grafana Cloud and Better Stack offer free starting plans. Free tiers usually limit check frequency, monitor counts or data retention, so check those limits against your site list before you rely on them.
Which Site24x7 alternative is best for small businesses?
UptimeRobot is the simplest low-cost start for uptime and status pages. Better Stack adds incident handling for a small team, while New Relic suits a small team that also needs application insight. Pick the smallest tool that covers your must-have checks, then upgrade only when a limit bites.
Which alternative is closest to Site24x7 overall?
Datadog and Dynatrace come closest on breadth, covering infrastructure, applications, logs and synthetic checks in one platform. They cost more and need more setup than Site24x7 for many small teams, so breadth alone should not decide the pick.
Can I monitor servers and networks with these tools?
Yes, but not with every tool here. PRTG, Zabbix, Datadog, Dynatrace and Grafana Cloud cover servers and networks in depth. UptimeRobot and Pingdom focus on external website checks, so they suit a different job.
Do these tools offer status pages?
UptimeRobot, Pingdom and Better Stack include status pages, and Grafana Cloud can support public dashboards for a similar purpose. Check whether a custom domain, subscriber alerts and incident history are included on the plan you choose.
Sources
See where you really rank - block by block
ProMapRanker scans Google Maps across a grid of your service area. Simple monthly plans from $19, white-label on every plan.
Start freeKeep reading
 zoro.to alternatives
Best Zoro.to Alternatives in 2026
We compare the best zoro.to alternatives in 2026, listing only legal licensed anime streaming services, from Crunchyroll to free options for fans today.
Read → zip alternatives
Best Zip Alternatives in 2026
We compare the best zip alternatives for buy now, pay later in 2026, covering pay-in-4 plans, fees, spending limits, and credit reporting options today.
Read → yesware alternatives
Best Yesware Alternatives in 2026
Compare the best yesware alternatives for sales email tracking, templates, and sequences, with current pricing and honest tradeoffs for small sales teams.
Read →