 ProMapRanker
Prometheus Alternatives in 2026


Managed Prometheus-compatible metrics · Pricing starts at: $19 per month
Key takeaways
- Grafana Cloud and VictoriaMetrics Cloud keep PromQL working, which lowers migration cost for Prometheus users.
- Datadog, New Relic, and Dynatrace replace several tools at once, but they require learning a new query model.
- Paid pricing is usually metered by hosts, data volume, or active series, so a small test with real traffic matters.
- Compare retention, alerting, and OpenTelemetry support before you commit, since those decide long-term cost.
Quick comparison
| Pick | Great for | Pricing starts at | Free tier | |
|---|---|---|---|---|
| Grafana Cloud | Managed Prometheus-compatible metrics | $19 per month | Yes | Visit |
 VictoriaMetrics Cloud | High-volume Prometheus storage | See website | Yes | Visit |
 Datadog | Full-stack observability in one vendor | $15 per host per month | Yes | Visit |
 New Relic | Usage-based full-stack monitoring | Free | Yes | Visit |
 Dynatrace | Automated enterprise monitoring | See website | Free trial | Visit |
 Splunk Observability | Log and metrics analysis at scale | See website | Free trial | Visit |
 Honeycomb | Trace-first debugging | $150 per month | Yes | Visit |
 SigNoz Cloud | OpenTelemetry-native monitoring | $49 per month | Yes | Visit |
 Elastic Observability | Search-based logs, metrics, and APM | See website | Yes | Visit |
The best Prometheus alternatives
Prometheus is free and widely used for Kubernetes metrics, but teams often move on when they need long-term retention, managed scaling, or logs and traces in the same place. The tools below are alternatives to Prometheus, not Prometheus itself, and they differ mainly in query language and pricing meter.
Grafana Cloud is the easiest managed move for a Prometheus team. Its metrics backend, Mimir, accepts Prometheus data and runs PromQL, so many dashboards and alert rules carry over with less rework. Logs through Loki and traces through Tempo sit in the same account, which helps when an alert needs context beyond a metric graph.
The free tier covers small setups, and Pro starts at $19 per month plus usage for active series and log volume. That usage model rewards careful label design. If your series count grows without control, the bill grows with it, so test with production-like traffic first.
- Full PromQL support through Mimir
- Logs and traces included
- Free tier for small use
- Usage charges add up with series and log volume
- Pricing has several meters
VictoriaMetrics is a time-series database that speaks PromQL and can replace Prometheus storage while keeping much of the surrounding setup. It is known for handling large numbers of series efficiently, which matters when labels multiply across services and regions. A self-hosted open-source version exists for teams that want to run it themselves.
The managed cloud price depends on volume and region, so the vendor site is the right place to check your tier. For teams whose main pain is Prometheus storage and retention, rather than a full observability suite, VictoriaMetrics is a focused choice.
- PromQL-compatible
- Handles high cardinality well
- Self-hosted option exists
- Managed pricing varies by region and volume
- Smaller vendor ecosystem than Datadog
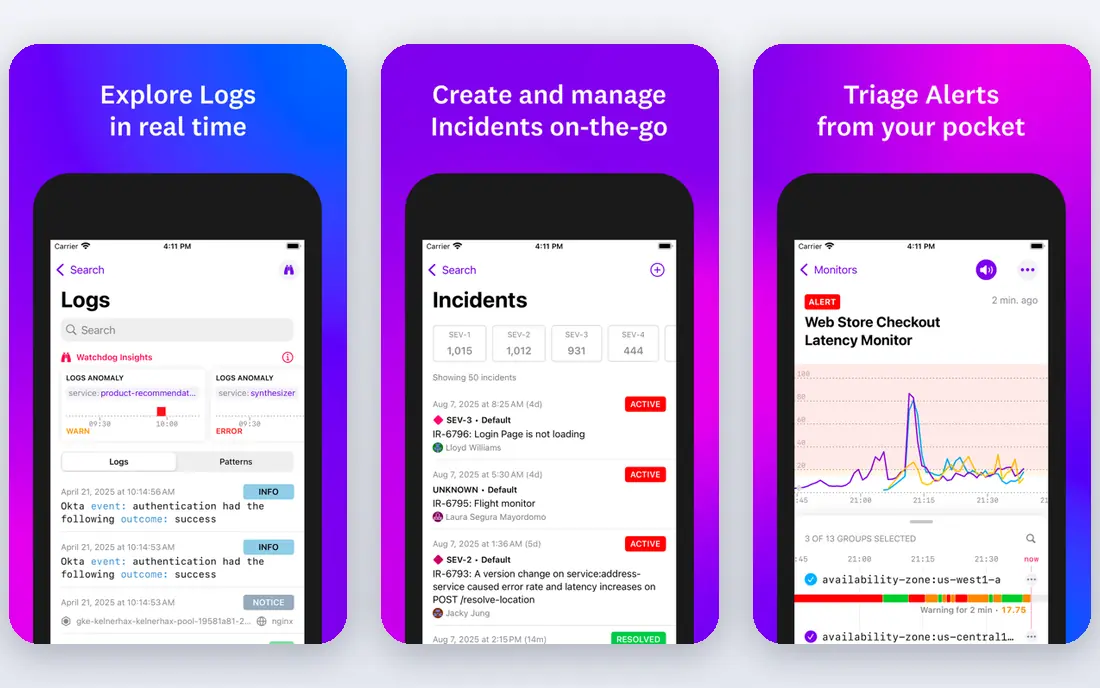
Datadog replaces several tools with one platform. Infrastructure monitoring starts at $15 per host per month on annual billing, with APM from $31 per host per month, and logs and other products priced separately. That breadth suits teams that want one vendor, one agent, and one bill for hosts, containers, applications, and logs.
Migration is the cost. Datadog uses its own query language, so Prometheus dashboards and alerts need rebuilding. Budget for that work, and for the way each added product changes the monthly total, before you treat the entry price as the full price.
- Broad integration catalog
- Infrastructure, APM, logs, and security in one place
- Strong dashboards
- Per-host and per-product pricing can grow fast
- No native PromQL
New Relic prices mainly by data ingested, with 100 GB free per month in recent plans, plus per-user seats on paid editions. That model suits teams with uneven host counts but steady data volume, since you are not billed per host for core monitoring. Infrastructure, APM, logs, and browser monitoring sit in one platform.
Prometheus users should expect translation work. New Relic can ingest Prometheus data, but its query language is not PromQL, so dashboards need rework. Test alerting and retention on the free tier before you move a production workload.
- Generous free data allowance
- Full-stack coverage
- No per-host lock on core pricing
- User seats add cost on paid tiers
- Query language differs from PromQL
Dynatrace aims to reduce manual setup through automatic discovery of services, hosts, and dependencies. Its Davis AI features link problems to likely causes, which helps large estates where a single alert can hide many related failures. It runs as SaaS or as a managed self-hosted deployment for regulated environments.
Pricing is the main hurdle for smaller teams. Rates are published as consumption units, with full-stack monitoring around $0.08 per hour for an 8 GB host in recent benchmarks, but the total depends on modules and volume. Get a scoped quote with your real host and data figures.
- Automatic discovery and topology
- AI-assisted root-cause analysis
- Managed or SaaS deployment
- Pricing is consumption-based and complex
- Enterprise focus can be heavy for small teams
Splunk Observability Cloud combines infrastructure monitoring, APM, logs, and real user monitoring for teams that already think in Splunk terms. Its search language is powerful for digging through logs, and it handles large volumes that would strain a self-hosted Prometheus setup. Enterprise security and retention controls are a further draw for regulated teams.
Cost is hard to judge from a headline price, since Splunk uses workload-based pricing and often requires a sales conversation. If logs are your main pain and you already use Splunk elsewhere, it is a natural step. If metrics alone are the issue, a Prometheus-compatible tool is simpler.
- Strong log search and analysis
- Metrics and traces in one suite
- Enterprise controls
- Pricing is workload-based and needs a quote
- Learning curve for SPL
Honeycomb takes a different approach from Prometheus. Instead of pre-aggregated metrics, it stores wide events and traces that you can slice by any field at query time. That helps when a bug affects only a small slice of users, since you do not need to guess the right metric in advance.
The free tier covers up to 20 million events, and Pro starts at $150 per month in recent pricing. It is not a drop-in Prometheus replacement, and teams that need simple host metrics may find it more than they need. For debugging complex distributed systems, it is a strong paid alternative.
- High-cardinality event debugging
- Fast querying
- Free tier to 20 million events
- Trace-first model differs from Prometheus metrics
- Pro price is high for small teams
SigNoz is built on OpenTelemetry and ClickHouse, with metrics, logs, and traces in one interface. Self-hosting is free, and SigNoz Cloud starts at $49 per month in recent pricing. Teams standardizing on OpenTelemetry will find its ingestion model natural, since it avoids a separate vendor agent for each signal.
Prometheus users should note the query gap. Dashboards can use a Prometheus-compatible view, but alert rules do not run native PromQL in the same way. If you rely heavily on existing alert rules, Grafana Cloud or VictoriaMetrics will be an easier move.
- Metrics, logs, and traces in one open-source-based platform
- OpenTelemetry native
- Self-hosted option
- Alerting PromQL support is limited
- Smaller ecosystem than Grafana or Datadog
Elastic Observability builds on Elasticsearch, with logs, metrics, APM, and uptime in one stack. Teams already running Elasticsearch for search or logging can add observability without a new data store. Cloud pricing is published by resource size, and a self-managed open-source route exists for teams that prefer to run it themselves.
The trade-off is operational weight. Elastic needs sizing, index care, and retention planning, even in the cloud. If you want a fully managed metrics service with minimal tuning, Grafana Cloud or New Relic will feel lighter.
- Search-powered logs and APM
- Self-managed option
- Flexible deployment
- Pricing depends on cloud resources
- Setup takes more care than a pure SaaS tool
How we picked these
We compared vendor pricing pages and September 2026 observability comparisons for paid and managed tools that can replace Prometheus for metrics, with logs or traces where offered. We kept tools with a live paid or managed tier, and we noted PromQL support honestly, since that decides migration cost. Prices are entry or published figures where available, and quote-based tools are marked as such.
How to compare paid Prometheus alternatives
Start with your query and alert debt
Count your dashboards, recording rules, and alert rules before you shortlist. A PromQL-compatible tool saves weeks of rework, while a full-suite tool may be worth it if you also replace logging and APM. List the rules you cannot lose, then test them in a trial.
Model the bill on real data
Per-host, per-GB, and per-series meters behave very differently as you scale. Run a trial with production-like labels and retention, then check the bill preview, not just the entry price. Watch label cardinality, log volume, and trace sampling, since those are the usual cost drivers.
Check retention and alerting early
Retention, alert routing, and on-call integrations decide whether a tool works in an incident, not just in a demo. Confirm how long metrics, logs, and traces are kept on your tier, and whether alerts can route to your existing paging tool. A cheap tier with short retention can cost more later.
Frequently asked questions
What is the best paid Prometheus alternative?
Grafana Cloud is the best paid Prometheus alternative for most Prometheus teams, since it keeps PromQL and adds managed logs and traces. Datadog and New Relic are better if you want to replace several tools at once. The right pick depends on whether migration cost or breadth matters more.
Where can I compare paid Prometheus alternatives?
Vendor pricing pages are the most reliable source, since meters differ by hosts, data, and series. Third-party comparisons from September 2026 list Datadog from $15 per host per month, Grafana Cloud Pro from $19 per month plus usage, and New Relic with 100 GB free per month. Always confirm the live price before you buy, since tiers change.
Is there a free Prometheus alternative?
VictoriaMetrics, SigNoz, and Grafana all offer free self-hosted versions, and Grafana Cloud, New Relic, and Elastic offer free tiers. Free tiers suit small setups, but production use with long retention usually needs a paid tier. Self-hosting is free in license terms, but it still costs hosting and staff time.
Does Datadog support PromQL?
Datadog can ingest Prometheus metrics, but it does not run PromQL natively. You will need to rebuild dashboards and alerts in Datadog query language. If keeping PromQL matters, choose Grafana Cloud or VictoriaMetrics instead.
Should I keep Prometheus and add a paid tool?
Many teams do. Prometheus can keep collecting short-term metrics, while a managed tool handles long-term storage, logs, and traces. That hybrid route lowers migration risk, but it also means running two systems during the transition. Set a clear cutover date so the hybrid phase does not become permanent.
Sources
- https://www.grafana.com
- https://www.victoriametrics.com
- https://www.datadoghq.com
- https://www.newrelic.com
- https://www.dynatrace.com
- https://www.splunk.com
- https://www.honeycomb.io
- https://www.signoz.io
- https://www.elastic.co
- https://last9.io/blog/best-observability-tools/
- https://www.siit.io/tools/alternatives/prometheus-alternatives
- https://kurums.com/best-observability-software-2026-comparison/?v=653f5ac96a69
See where you really rank - block by block
ProMapRanker scans Google Maps across a grid of your service area. Simple monthly plans from $19, white-label on every plan.
Start freeKeep reading
 zscaler alternatives
Best Zscaler Alternatives in 2026
Looking for zscaler alternatives? We compare 9 SASE and zero trust platforms on architecture, data protection, pricing, and fit for your network and team.
Read → zapier alternatives free
Best Zapier Alternatives Free in 2026
Nine automation tools for zapier alternatives free in 2026, all with genuinely free tiers, plus free plan limits, starting prices and upgrade paths explained.
Read → which platform is best for online reputation
Which Platform Is Best for Online Reputation in 2026
Wondering which platform is best for online reputation? We compare 8 review, listing, and response tools for small and multi-location businesses and agencies.
Read →