 ProMapRanker
Best Pie Chart Alternatives in 2026

Key takeaways
- A pie chart is a chart type, not a product, so this article compares tools that make pie charts well and offer clearer alternatives to them.
- Bar charts beat pie charts when readers must compare values, since length is easier to judge than slice angle or area.
- Waffle, treemap, and donut charts keep the part-to-whole idea while staying readable with more categories.
- Datawrapper and Flourish suit publishing and storytelling, while Tableau and Power BI suit dashboards and deeper analysis.
- Keep pie charts to a few categories with clear labels, and switch to a bar or treemap when differences are small or categories are many.
Quick comparison
| Pick | Great for | Pricing starts at | Free tier | |
|---|---|---|---|---|
 Datawrapper | Publication-ready charts | Free | Yes | Visit |
 Flourish | Animated interactive stories | Free | Yes | Visit |
 Tableau | Deep dashboard analysis | See website | Free trial | Visit |
 Microsoft Power BI | Microsoft 365 dashboards | Free | Yes | Visit |
 Google Looker Studio | Free Google data dashboards | Free | Yes | Visit |
 Plotly | Interactive web charts | Free | Yes | Visit |
 Infogram | Branded report graphics | Free | Yes | Visit |
 Canva | Charts inside designed graphics | Free | Yes | Visit |
 RAWGraphs | Unusual chart types | Free | Yes | Visit |
The best pie chart alternatives
These alternatives to pie chart thinking are charting and visualization tools that let you keep a pie chart when it works, and switch to a bar, donut, treemap, waffle, or stacked bar chart when it does not.
Datawrapper is built for charts that must read well in an article or report. You can paste a table, pick a bar, donut, pie, or stacked chart, and publish a clean graphic with clear labels. Newsrooms and analysts use it because the defaults are sensible and the output looks professional without design work.
The free plan supports public charts with Datawrapper branding, which suits testing and public posts. Private charts and custom branding need a paid plan, so budget for that if you publish internal reports. For public-facing charts, it is the simplest strong pick here.
- Clean readable charts
- Maps and tables included
- Easy embedding
- Free charts carry branding
- Paid plans start at a higher annual price
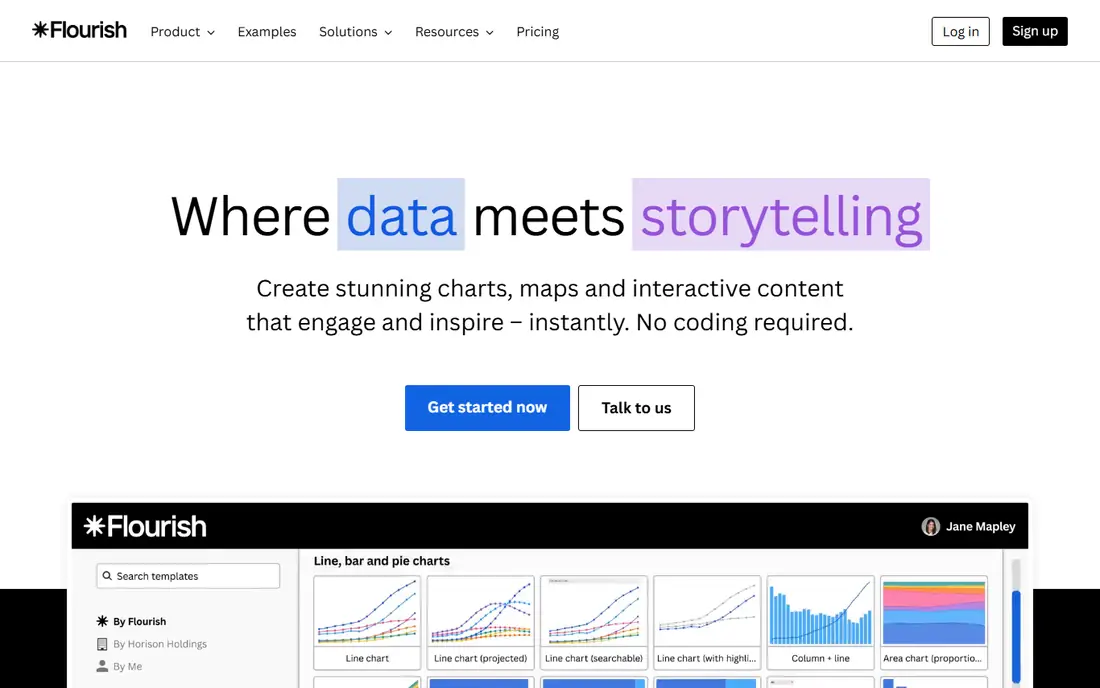
Flourish suits stories where a chart should move, filter, or invite clicks. It offers pie, donut, bar, treemap, and many less common types, with templates that handle animation and interaction for you. A waffle chart or a racing bar chart that would take code elsewhere can be built here in minutes.
Free projects are public, so private work needs a paid plan. Flourish is also a storytelling tool first, not a full business intelligence platform, so it suits published stories better than live operational dashboards.
- Animated and interactive charts
- Many chart types
- Easy sharing
- Free projects are public
- Advanced features need a paid plan
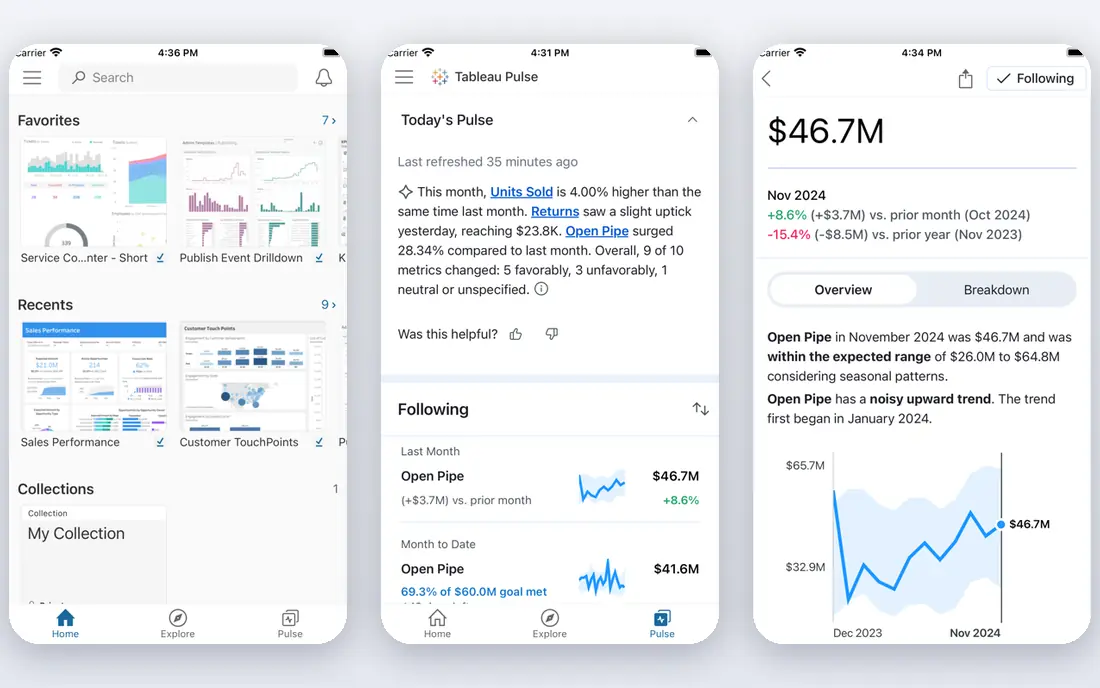
Tableau is the heavyweight for analysis. It connects to many data sources, lets readers filter and drill into dashboards, and supports pie, donut, bar, treemap, and many other chart types in one view. Teams that explore data daily will use its depth.
Cost and learning curve are the trade. Tableau suits organizations with analysts and a dashboard habit, not a reader who needs one chart for a blog post. If your work is a single graphic, Datawrapper or Flourish will be faster and cheaper.
- Deep analysis and filtering
- Strong dashboards
- Wide data connectors
- Higher cost and learning curve
- Overkill for a single chart
Microsoft Power BI suits teams already in Microsoft 365. You can build dashboards from Excel, SharePoint, and other Microsoft sources, use pie, donut, bar, and treemap visuals, and share reports with colleagues. The free desktop version covers a lot of personal analysis.
Sharing reports widely needs a paid plan, and data modeling takes learning for complex work. If your team lives in Excel and Teams, Power BI is the natural dashboard pick. If you only need a chart for a post, a lighter tool will be quicker.
- Free desktop use
- Strong Microsoft integration
- Shareable dashboards
- Sharing needs a paid plan
- Learning curve for data modeling
Google Looker Studio, formerly Data Studio, is the free dashboard option for Google data. It connects well to Sheets, Analytics, and other Google sources, and it lets you build pie, donut, bar, and stacked charts that viewers can open without a paid seat. For marketing reports, that free sharing is a major advantage.
Chart variety and advanced analysis are thinner than in Tableau or Power BI. If your data lives outside Google tools, check connector limits before committing. For Google-centered reporting, it is hard to beat on price.
- Free for creators and viewers
- Strong Google data links
- Easy sharing
- Fewer advanced chart types
- Limits on some data sources
Plotly suits people who want interactive charts on the web, with code behind them. Its chart library covers pie, donut, bar, treemap, sunburst, and many other types, and charts respond to hover, zoom, and selection. Python and R users can build charts in code and publish them as web graphics.
Code comfort helps. Non-coders can use the chart studio, but the best results come from the libraries. Hosted and team features also cost more than the free open-source libraries, so check the plan if you need private sharing.
- Interactive web charts
- Python and R support
- Many chart types
- Needs some code comfort for best results
- Hosted features cost more
Infogram is built for marketers and report writers who need a chart inside a branded graphic. It offers templates for pie, donut, bar, and other charts, plus infographics and reports that keep colors and fonts consistent. A team that publishes regular reports will like the template workflow.
It is not a deep analysis tool, so complex filtering and large datasets suit Tableau or Power BI better. The free tier also limits some features. For polished report graphics, though, Infogram is faster than a full BI platform.
- Branded infographics and reports
- Templates
- Easy embedding
- Free tier limits features
- Less suited to deep analysis
Canva suits readers who need a chart inside a slide, social post, or one-page graphic. You can add a pie, donut, or bar chart to a design, style it to match, and export it without leaving the design tool. For presentations, that all-in-one workflow saves time.
Data handling is basic compared with dedicated chart tools. Large datasets, live connections, and complex filtering are not Canva's strengths. Use it when the design matters as much as the data, and use a chart tool when the data itself is the work.
- Charts inside slides and social graphics
- Huge template library
- Easy to use
- Chart data handling is basic
- Not for heavy analysis
RAWGraphs is a free, open-source tool for chart types that mainstream tools skip, including waffle charts, bump charts, and other less common forms. You paste or upload a spreadsheet, pick a chart, and export a graphic. For a waffle chart as a pie alternative, it is one of the easiest free paths.
It does not host dashboards or refresh live data, so it suits one-off graphics better than ongoing reporting. Output may also need polish in a design tool for publication. For trying a new chart type quickly, it is an excellent free experiment.
- Free and open source
- Unusual chart types
- Works from a spreadsheet
- No hosted dashboards
- Output needs design polish elsewhere
How we picked these
We compared vendor pages, pricing pages, and recent visualization guides for tools that are live in October 2026. We kept only tools that offer pie charts or clear pie alternatives, such as bar, donut, treemap, waffle, and stacked bar charts, and that a non-specialist or analyst can use without building a custom app. We left out code-only libraries that need a full development setup, since most readers need a working chart tool, not a coding project.
How to pick a chart instead of a pie chart
The chart type matters more than the tool. A good tool with the wrong chart still confuses readers.
Use a bar chart to compare values
When readers must tell which category is larger, and by how much, a sorted bar chart wins. Length is easier to judge than angle or area, and labels stay readable even with many categories. Use a bar chart whenever comparison is the point.
Keep part-to-whole charts simple
Donut and waffle charts work for part-to-whole stories, but only with a few categories. A waffle chart with a 10 by 10 grid makes shares easy to count, while a pie with twelve thin slices does not. Limit categories, label shares directly, and group small slices into one other category.
Use a treemap for hierarchy and size
Treemaps show nested categories as rectangles sized by value, which suits market share, budgets, and portfolios with many parts. They reveal dominance at a glance, where a pie would collapse into unreadable slices. Check that readers can still read small rectangles before publishing.
Avoid stacked bars for precise shares
Stacked bars show totals and parts over time, but shares are harder to judge than in a bar chart because baselines shift. Use them when the total and its change over time matter most, and use a simple bar chart when precise comparison matters most.
Frequently asked questions
What are the best alternatives to pie chart visuals?
Bar charts are the best general alternative, since they make comparison easy. Donut and waffle charts keep the part-to-whole idea with better readability, while treemaps suit hierarchical data with many parts. Stacked bar charts suit totals over time. Pick the chart that matches the question readers must answer.
When should I still use a pie chart?
Use a pie chart only with two to five categories, clear labels, and shares that differ enough to see. It works when the point is that one part dominates the whole, not when readers must compare similar slices. If categories are many or values are close, switch to a bar chart.
Which tool is best for a simple pie chart alternative?
Datawrapper is the simplest pick for a clean published chart, while Flourish suits animated and interactive stories. Google Looker Studio is best for free dashboards on Google data, and RAWGraphs is best for a free waffle chart. Start with the tool that matches where the chart will be seen.
Do these tools offer pie charts too?
Yes, most tools here offer pie and donut charts alongside their alternatives. That matters, since you may need a pie chart for one story and a bar chart for the next. The point is not to ban pie charts, but to pick the chart type that fits each dataset.
Are pie chart alternatives free?
Many are free at a basic level, including Datawrapper, Flourish, Looker Studio, Plotly libraries, Infogram, Canva, and RAWGraphs. Paid plans add private charts, branding control, team features, and advanced sharing. Tableau and Power BI sharing also need paid plans, so check the cost of sharing, not just building.
Sources
See where you really rank - block by block
ProMapRanker scans Google Maps across a grid of your service area. Simple monthly plans from $19, white-label on every plan.
Start freeKeep reading
 zscaler alternatives
Best Zscaler Alternatives in 2026
Looking for zscaler alternatives? We compare 9 SASE and zero trust platforms on architecture, data protection, pricing, and fit for your network and team.
Read → zapier alternatives free
Best Zapier Alternatives Free in 2026
Nine automation tools for zapier alternatives free in 2026, all with genuinely free tiers, plus free plan limits, starting prices and upgrade paths explained.
Read → which platform is best for online reputation
Which Platform Is Best for Online Reputation in 2026
Wondering which platform is best for online reputation? We compare 8 review, listing, and response tools for small and multi-location businesses and agencies.
Read →