 ProMapRanker
Best Pandora FMS Alternatives in 2026

Key takeaways
- Zabbix is our pick for a free, open-source replacement, with enterprise monitoring at no licence cost.
- Nagios XI suits teams that want deep customisation and a long plugin history, with a paid interface on top of Nagios Core.
- Paessler PRTG suits small and mid-sized teams that want a quick, sensor-based setup with 100 free sensors.
- Datadog suits cloud-native teams that need infrastructure, logs and application monitoring in one platform.
- Checkmk, LibreNMS and Icinga suit teams that want open or flexible monitoring without a large enterprise contract.
Quick comparison
| Pick | Great for | Pricing starts at | Free tier | |
|---|---|---|---|---|
 Zabbix | Free open-source monitoring | Free | Yes | Visit |
 Nagios XI | Customisable monitoring | See website | Yes | Visit |
 Paessler PRTG | Quick sensor-based setup | Free | Yes | Visit |
 Datadog | Cloud-native observability | See website | Yes | Visit |
 Checkmk | Flexible infrastructure monitoring | Free | Yes | Visit |
 LibreNMS | Free auto-discovery | Free | Yes | Visit |
 Icinga | Open monitoring with history | Free | Yes | Visit |
 SolarWinds Network Performance Monitor | Enterprise network performance | See website | No | Visit |
The best Pandora FMS alternatives
Pandora FMS monitors networks, servers, applications and business processes from one console, with agents, remote checks and alerting. The alternatives below cover the same job at different scales, from free open-source systems to cloud observability platforms. We compared licence cost, discovery, alerting, dashboards, cloud support and ease of setup, and we kept only tools that are sold or maintained in October 2026.
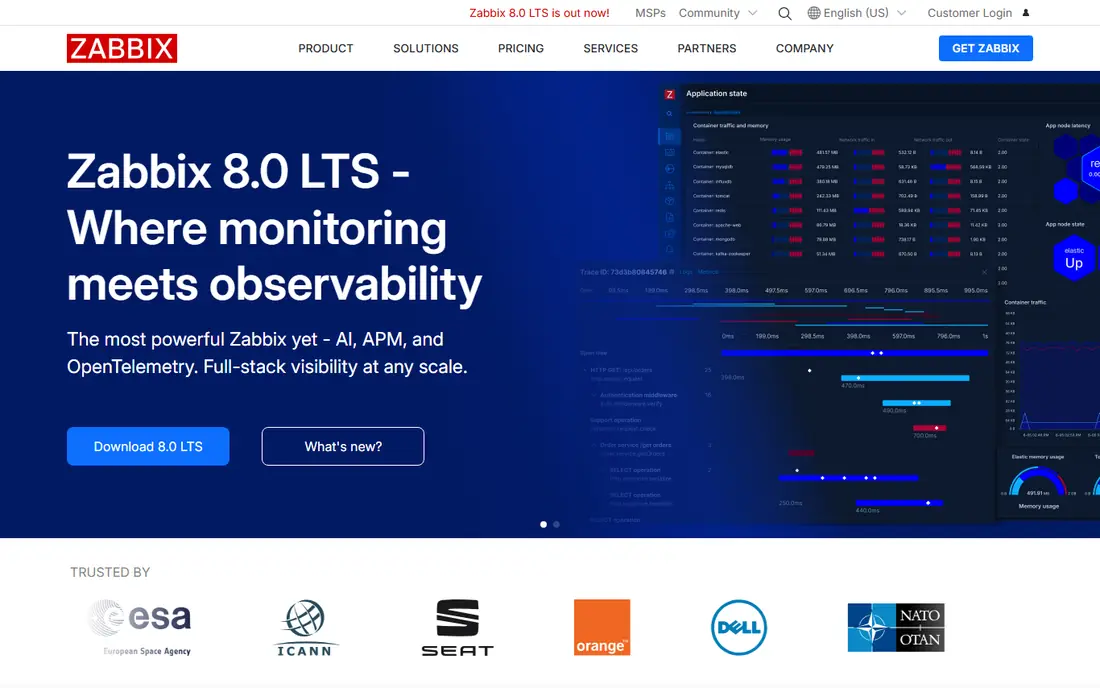
Zabbix is the most direct free replacement for Pandora FMS. It monitors networks, servers, cloud services, applications and databases, with auto-discovery, templates, triggers, alerting and dashboards built in. Because the software itself is free, a team can start with a small deployment and grow without licence costs, paying only for hardware, time and optional support.
The trade-off is effort. Zabbix setup, template tuning and alert design take expertise, and the interface is technical rather than guided. Teams without monitoring experience should budget for learning or support. If you want enterprise depth at no licence cost and you have the skills to run it, Zabbix is our pick.
- Free and open source with no licence cost
- Scales from small networks to enterprises
- Strong templates, triggers and dashboards
- Setup and tuning take time and expertise
- Interface feels technical
- Paid support is separate from the free software
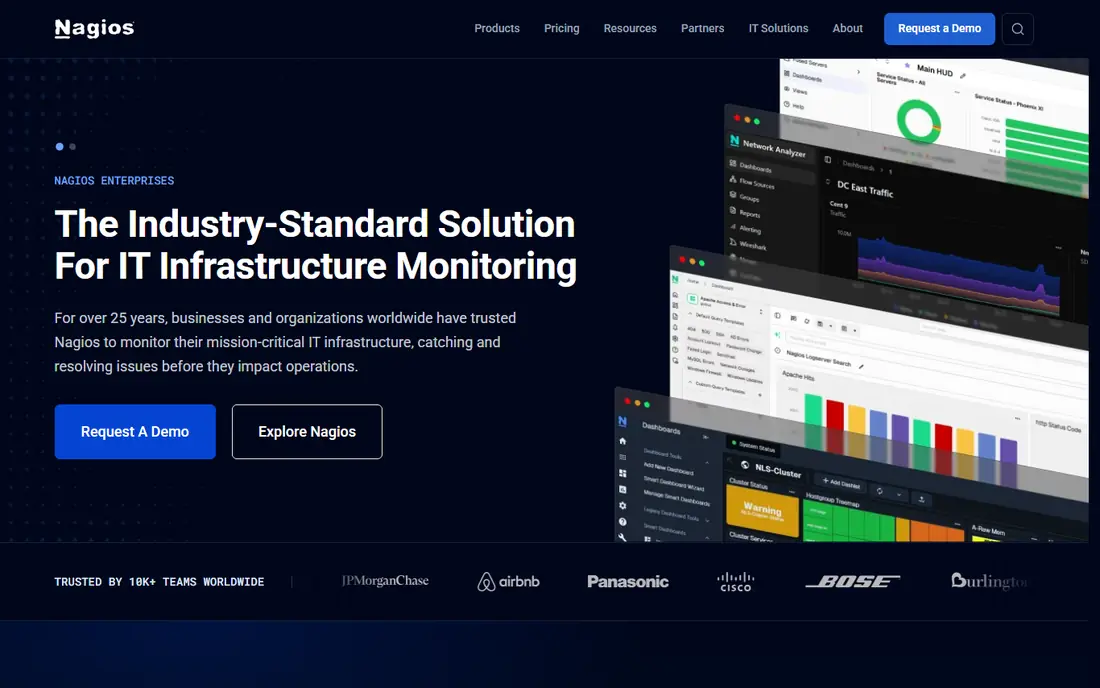
Nagios XI builds a commercial web interface, wizards and reporting on top of the long-running Nagios monitoring core. Its plugin ecosystem is vast, covering servers, networks, applications and custom checks, and its alerting and escalation rules suit teams with strict on-call needs. A free Nagios Core version exists for users who want the core without the commercial interface.
The limits are cost and age. Nagios XI is a paid subscription product, and guides note higher costs as environments grow, so check the vendor pricing page for your host and service count. The interface also feels older than Zabbix or Datadog. If you value plugin depth and custom checks above a modern look, Nagios XI remains a proven choice.
- Huge plugin ecosystem from Nagios history
- Highly customisable checks and alerts
- Paid interface on a proven core
- Paid subscription model with higher costs at scale in guides
- Interface feels older than newer platforms
- Setup needs care
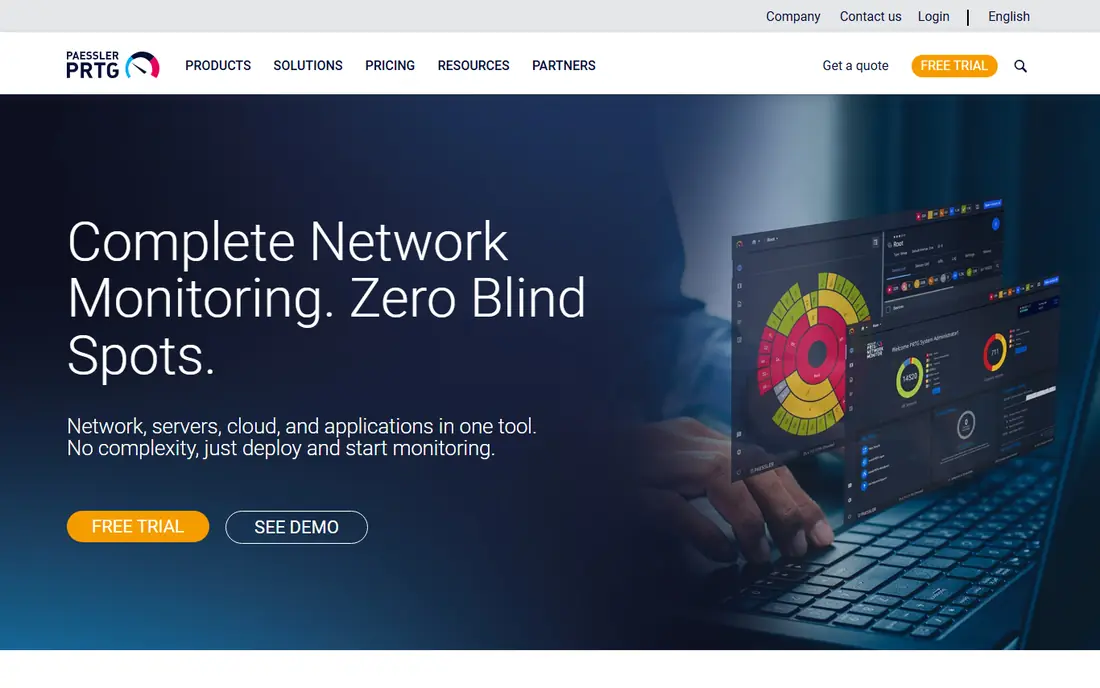
Paessler PRTG suits teams that want monitoring running today, not after a long project. It discovers devices, applies prebuilt sensors for common services, and shows health, traffic and performance on clear dashboards. The free tier covers 100 sensors, which suits a small office or a home lab, and alerts arrive by email and app.
Costs rise with sensor count. Guides list PRTG 500 from $2,149, PRTG 1000 from $3,899 and larger tiers higher, all on subscription, so plan sensor use carefully and avoid monitoring everything by default. For a small or mid-sized team that wants a guided setup, PRTG is the fastest path to useful monitoring.
- 100 sensors free for small networks
- Auto-discovery and prebuilt sensors
- Clear dashboards and alerts
- Paid tiers start at $2,149 for 500 sensors in guides, so costs rise with size
- Windows-focused history, with Linux support added later
- Sensor counting needs planning
Datadog is the pick for cloud-native teams that need more than network uptime. It combines infrastructure monitoring, log management, application performance traces, synthetic checks and security signals in one platform, with strong support for containers, Kubernetes and major clouds. Dashboards and alerts help teams trace a problem from a user report to a service to a host.
The catch is cost control. Datadog pricing is usage-based across hosts, logs and traces, and bills can grow quickly without retention and ingestion limits, so check the vendor pricing page and set budgets early. The free tier covers basic use only. For cloud and container estates, Datadog is the most complete platform here. For a simple on-prem network, Zabbix or PRTG will cost less.
- Infrastructure, logs, traces and application monitoring in one platform
- Strong cloud and container support
- Rich dashboards and alerting
- Pricing is usage-based and can grow fast
- Free tier is limited
- Best for cloud teams, less so for simple on-prem networks
Checkmk suits teams that want flexible monitoring without starting from scratch. It auto-discovers hosts and services, applies rule-based configuration, and covers servers, networks, cloud and applications, with dashboards, alerting and reporting. A free edition covers up to 25 hosts in recent guides, which suits small estates and testing.
Paid plans start at $150 per month in guides for about 100 hosts, rising with service counts, so larger estates need a quote. Rule-based configuration is powerful but takes learning, and the interface rewards admins who invest time in it. For a mid-sized hybrid estate that wants control without a large enterprise contract, Checkmk is a strong choice.
- Free edition for up to 25 hosts in guides
- Strong auto-discovery and rule-based configuration
- Good for hybrid infrastructure
- Paid plans start at $150 per month in guides for larger estates
- Learning curve for rule-based setup
- Interface takes time to master
LibreNMS is a free, open-source network monitoring system with strong auto-discovery. It finds switches, routers, servers and other devices, polls them for health and traffic, and draws clear graphs for bandwidth, CPU, memory and other metrics. Alerting covers thresholds and device states, and the system suits network teams that want visibility without licence costs.
The scope is narrower than Pandora FMS. LibreNMS is network-first, with less depth for application monitoring, business processes and synthetic checks, and setup needs Linux skills plus community support. If your main job is network visibility on a zero licence budget, LibreNMS is an excellent pick. If you need full-stack observability, pair it with Zabbix or Datadog.
- Free and open source
- Automatic discovery of network devices
- Good graphs for traffic and performance
- Network-focused, less depth for applications and business processes
- Setup needs Linux skills
- Support is community-based
Icinga grew from the Nagios tradition into a modern open-source monitoring stack. It offers flexible host and service checks, notifications, dashboards and a web interface, with a modular design that lets teams add graphing, reporting and business process views. Its Nagios-compatible roots mean many existing checks and plugins carry over.
The trade-off is assembly. A full Icinga setup involves several components, and configuration takes expertise, especially for large or custom estates. Commercial support is available separately from the free software. For teams that want open monitoring with a long history and full control, Icinga is a solid and respected choice.
- Free and open source with Nagios-compatible roots
- Flexible checks, notifications and dashboards
- Good for custom monitoring setups
- Setup and configuration take expertise
- Interface is modular, so full setup needs several parts
- Commercial support is separate
SolarWinds Network Performance Monitor
Great for: Enterprise network performance
SolarWinds Network Performance Monitor, often called NPM, suits large networks where performance detail matters. It monitors multi-vendor devices, tracks bandwidth, latency and faults, and presents maps and dashboards that help network teams find faults fast. Its alerting and reporting support enterprise operations and change tracking.
The limits are cost and scale. There is no free plan, only a trial, and pricing is quote-based for enterprise use, so small teams should look at PRTG or LibreNMS first. SolarWinds also carries a heavier deployment than a free open-source tool. For a large enterprise network that needs deep performance data, NPM is a proven and powerful choice.
- Deep network performance analytics
- Multi-vendor device support
- Strong maps, dashboards and alerting for large networks
- No free plan, only a trial
- Enterprise pricing on quote
- Best for large networks, heavier than small teams need
How we picked these
We compared official product pages, pricing pages and 2026 monitoring guides. We kept tools that are sold or maintained now, that cover a distinct need such as free open-source monitoring, custom checks, quick sensor setup, cloud observability, hybrid infrastructure, network discovery or enterprise network performance, and that offer a real alternative to Pandora FMS. We left out discontinued tools, single-purpose uptime checkers, and products with no clear vendor page. Prices are vendor or recent guide figures from October 2026, and we wrote See website where pricing is quote-based or varies by host and sensor count.
What to check before you switch
First, count what you monitor today: hosts, network devices, services, cloud resources and business processes. That count decides whether a free tier, a sensor-based price or a usage-based cloud bill fits. Second, test discovery on a real subnet, not a demo, and check that device types, interfaces and services appear correctly. Third, test alerting end to end, including who gets paged, how alerts escalate, and how to silence planned maintenance without losing real faults.
A simple migration checklist
- Export host, service and alert lists from Pandora FMS before changing anything.
- Run the new tool in parallel for two weeks and compare alerts.
- Tune thresholds on real data, since default thresholds often page too much or too little.
- Document on-call routing, escalation and maintenance windows in the new tool.
- Confirm dashboards answer the questions your team asks during an outage.
Frequently asked questions
What is the best Pandora FMS alternative?
Zabbix is the best overall pick for a free, open-source replacement with enterprise depth. Paessler PRTG is the best pick for a quick setup on a small network, while Datadog is the best pick for cloud-native observability. Your best choice depends on budget, skills and whether your estate is on-prem, cloud or hybrid.
Is there a free Pandora FMS alternative?
Yes. Zabbix, LibreNMS, Icinga and the Checkmk free edition are free and open source or free for small estates, and Paessler PRTG offers 100 sensors free. Free software still needs hardware, time and skills to run, so budget for hosting and maintenance even when the licence costs nothing.
Which alternative is best for network monitoring?
LibreNMS is the best free network pick, with auto-discovery and clear traffic graphs. SolarWinds NPM is the best enterprise network pick, with deep performance analytics for large multi-vendor networks. Paessler PRTG sits between them, with a guided setup and sensor-based pricing for small and mid-sized networks.
Can these tools monitor cloud and containers?
Yes, with different depth. Datadog is the strongest cloud and container pick, with infrastructure, logs and traces in one platform. Zabbix and Checkmk also monitor cloud resources and containers, while LibreNMS is network-focused. Check cloud integrations for your exact provider before committing.
Do I need agents for these monitoring tools?
It depends on the tool and the target. Zabbix and Pandora-style systems use agents for detailed host metrics, while network devices often use SNMP without an agent. Cloud and container monitoring may use a different agent or integration. Test agent setup on your real servers during a trial, since agent maintenance is a running cost.
How much does a Pandora FMS alternative cost?
It ranges from free for Zabbix, LibreNMS and Icinga software to sensor-based PRTG pricing from $2,149 for 500 sensors in guides, to quote-based enterprise pricing for Nagios XI and SolarWinds NPM, to usage-based Datadog billing. Always price your real host, sensor and log volume, not the headline free tier, before choosing.
Sources
See where you really rank - block by block
ProMapRanker scans Google Maps across a grid of your service area. Simple monthly plans from $19, white-label on every plan.
Start freeKeep reading
 zscaler alternatives
Best Zscaler Alternatives in 2026
Looking for zscaler alternatives? We compare 9 SASE and zero trust platforms on architecture, data protection, pricing, and fit for your network and team.
Read → zapier alternatives free
Best Zapier Alternatives Free in 2026
Nine automation tools for zapier alternatives free in 2026, all with genuinely free tiers, plus free plan limits, starting prices and upgrade paths explained.
Read → which platform is best for online reputation
Which Platform Is Best for Online Reputation in 2026
Wondering which platform is best for online reputation? We compare 8 review, listing, and response tools for small and multi-location businesses and agencies.
Read →