 ProMapRanker
Best OpenTelemetry Alternatives in 2026

Key takeaways
- OpenTelemetry is an open instrumentation standard, not a hosted platform, so alternatives here are platforms that store, query, and alert on telemetry, many with OTLP ingest.
- SigNoz and Grafana Cloud suit teams that want to keep OpenTelemetry instrumentation while choosing a different backend.
- Datadog, New Relic, and Dynatrace suit teams that want a full managed platform, but their bills grow with hosts, data, or users.
- Honeycomb suits trace-first debugging, while Sentry suits error tracking with performance data beside it.
- Pricing models differ sharply, so model hosts, data volume, retention, and query habits before choosing.
Quick comparison
| Pick | Great for | Pricing starts at | Free tier | |
|---|---|---|---|---|
 SigNoz | OpenTelemetry-native open source | $49 per month | Yes | Visit |
 Grafana Cloud | Prometheus and LGTM stack users | $19 per month | Yes | Visit |
 Datadog | Broad managed observability | $15 per host per month | Yes | Visit |
 New Relic | Usage-based full-stack platform | See website | Yes | Visit |
 Dynatrace | Automatic root-cause analysis | See website | No | Visit |
 Honeycomb | Trace-first debugging | $150 per month | Yes | Visit |
 Splunk Observability Cloud | Host-based APM and infrastructure | $15 per host per month | No | Visit |
 Elastic Observability | Search-based logs and APM | See website | Yes | Visit |
 Sentry | Error tracking with performance data | $26 per month | Yes | Visit |
 Uptrace | Low-cost open-source observability | See website | Yes | Visit |
The best OpenTelemetry alternatives
We compared observability platforms that collect traces, logs, and metrics, with support for OpenTelemetry ingest or a comparable agent. OpenTelemetry itself is not listed here as a product, since it is an open standard for instrumentation rather than a hosted backend.
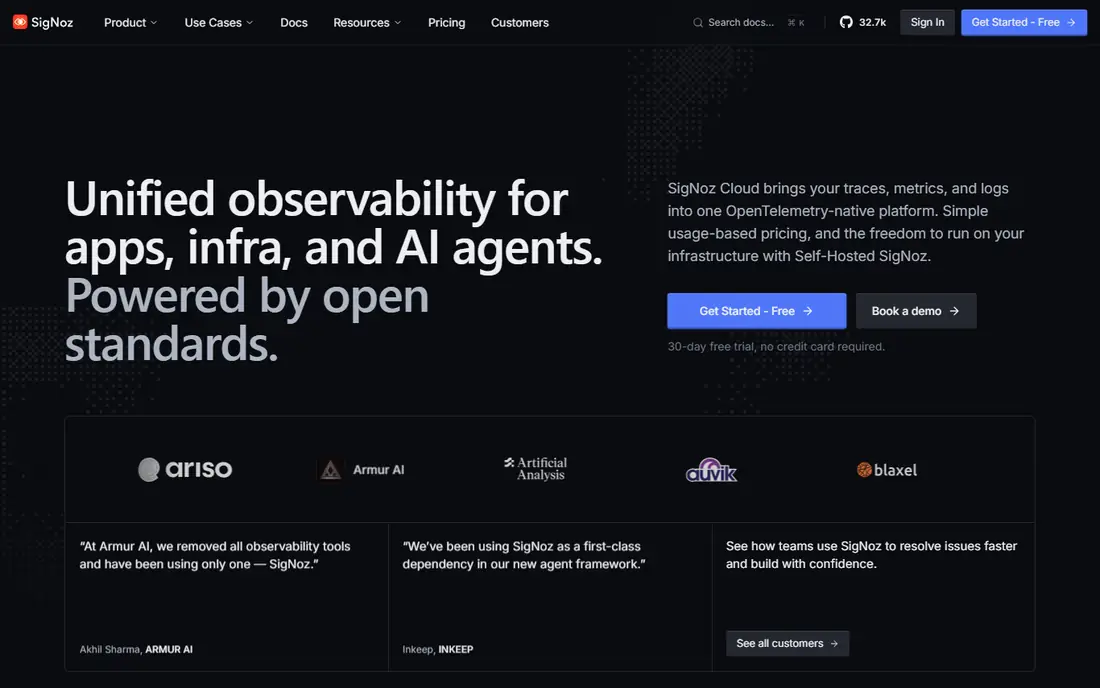
SigNoz is the most direct backend replacement for teams that already instrument with OpenTelemetry. Traces, logs, and metrics arrive through OTLP and sit in one interface, with a visual query builder, ClickHouse SQL, and PromQL options. The self-hosted edition suits teams that must keep telemetry data in their own infrastructure.
The cost is operational. Running ClickHouse, storage, and retention yourself takes engineering time, and the cloud plan is the simpler path for small teams. If you want to keep OpenTelemetry instrumentation and avoid vendor lock-in, SigNoz offers a clear middle path between DIY and a large managed platform.
- Built for OpenTelemetry data with traces, logs, and metrics in one interface
- Self-hosted Community Edition is free with no feature limits
- Cloud option avoids running ClickHouse yourself
- Self-hosting needs ClickHouse management and operational time
- Smaller integration catalog than Datadog or New Relic
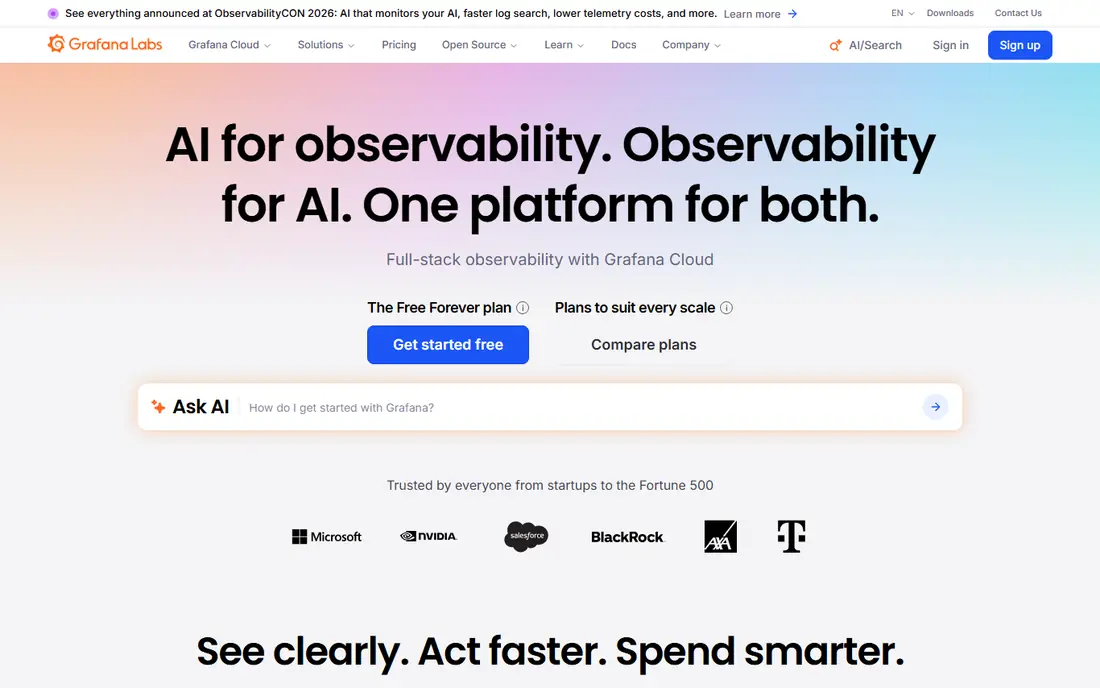
Grafana Cloud suits teams already comfortable with Prometheus and the Grafana ecosystem. Metrics, logs, and traces can be queried and visualized in Grafana dashboards, with alerting across signals. The free tier gives a practical starting point for a small service with modest data volume.
Billing is the main complexity. Platform fees, active metric series, log volume, and trace volume each contribute, so a team with high cardinality can see costs rise faster than expected. Set usage alerts early, and test with a realistic service before moving a full fleet.
- Managed Grafana, Prometheus metrics, Loki logs, and Tempo traces in one stack
- Strong dashboards and alerting
- Free tier covers small teams with limited logs and traces
- Pricing combines platform fees, active series, and data volume, so bills need modeling
- Assembling the full stack takes more learning than a single-vendor platform
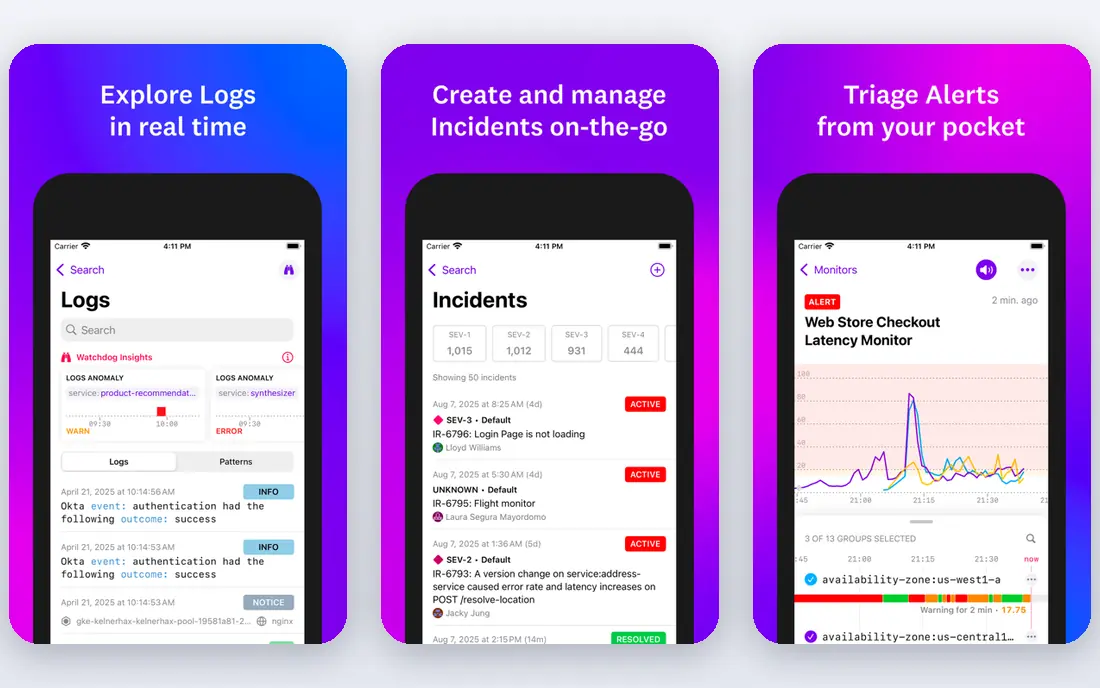
Datadog is the safest managed choice for teams that want one vendor for most observability needs. Infrastructure monitoring, APM, logs, real user monitoring, and synthetics sit in one platform, with many integrations for cloud services and databases. Correlation between signals helps during incidents, when a trace, a log line, and a metric must be read together.
The bill is the main risk. Hosts, APM, log ingest, indexing, and retention each add cost, and a team that sends everything without sampling or retention rules can face a large invoice. Model costs at several times current size, set retention rules, and use sampling for high-volume traces.
- Broad integration catalog covering infrastructure, APM, logs, synthetics, and security
- Strong correlation between metrics, traces, and logs
- Polished dashboards and alerting
- Costs stack across hosts, products, and log volume, so large fleets pay far more than the entry price
- Pricing has many moving parts
New Relic suits teams that want a managed platform priced mainly by data volume rather than by host count. OTLP data lands in the same billing category as agent data, which avoids one common pricing trap for OpenTelemetry-first teams. The free tier gives small teams room to start without a paid plan.
User seats add a second cost dimension. A team with many engineers but modest data volume should model seat costs alongside data costs, and check which features need a full-platform user. For data-heavy, small-team setups, New Relic often compares well with host-based rivals.
- Full-stack platform with APM, infrastructure, browser, mobile, synthetics, and logs
- OTLP ingest is supported as a preferred method
- Free tier includes 100 GB of data per month
- Data and user seats both affect the bill, so costs rise with team size and volume
- Pricing details need checking for the plan and region you choose
Dynatrace suits large enterprises that want automatic root-cause analysis with minimal manual setup. OneAgent discovers services and dependencies, Davis AI baselines behavior and flags anomalies, and Kubernetes observability covers containerized fleets. That automation saves engineering time in complex environments.
The trade is pricing and lock-in. Host-based units, log ingest, and retention each affect the bill, and the proprietary agent moves away from the OpenTelemetry-first goal. Enterprises that value automation over openness often accept that trade, while OpenTelemetry-first teams may prefer SigNoz or Grafana Cloud.
- Automatic topology discovery and causal analysis with Davis AI
- Strong Kubernetes and enterprise observability
- Managed deployment options for data residency
- Pricing uses host and data units that are harder to estimate than simple per-GB models
- Proprietary agent adds a different kind of lock-in than OpenTelemetry
Honeycomb suits teams that debug complex, high-cardinality problems, such as slow requests that only fail for a small slice of users. Wide events with many attributes let engineers slice traces by customer, feature flag, or region without pre-aggregating data. That approach fits modern distributed systems where averages hide the real problem.
Honeycomb is not a drop-in replacement for infrastructure monitoring. Teams often pair it with a metrics and logs platform, and event pricing needs modeling for high-volume services. For debugging, it is one of the strongest tools in this list, but budget it as a focused tool, not as the only platform.
- Trace-first debugging for high-cardinality events
- Fast queries across wide events with many attributes
- Free tier covers up to 20 million events per month
- Event-based pricing can rise with query and event volume
- Less suited as a general infrastructure monitoring replacement on its own
Splunk Observability Cloud suits teams that already run Splunk for logs and security, or that want a host-based APM platform built on OpenTelemetry. Infrastructure and APM pricing is clear per host, and most telemetry is included in that price. Real user monitoring and synthetics add coverage for user-facing services.
Logs are the catch. Log licensing sits on the Splunk platform, separate from Observability Cloud, so the total bill needs both parts. Teams that already pay for Splunk logs gain the most, while teams that need a simple all-in-one log price should compare Grafana Cloud and SigNoz first.
- Built on OpenTelemetry with infrastructure, APM, real user monitoring, and synthetics
- Host-based pricing includes most telemetry in the host price
- Suits teams already using Splunk
- Logs are licensed separately on the Splunk platform, which complicates total cost
- Custom metrics above allowance cost extra
Elastic Observability suits teams that think in search terms, with logs and APM data that need fast, flexible querying. The Elastic Stack covers logs, metrics, traces, and synthetics, with Kibana dashboards and alerting. Self-hosting suits teams that want control, while Elastic Cloud removes the operational burden.
Cloud pricing is resource-based, tied to deployment size rather than a simple per-host or per-GB rate. That model can be efficient for some workloads and confusing for others, so size a deployment with a realistic data volume before committing. Teams with heavy log search needs often find Elastic a natural fit.
- Search-based observability with logs, APM, infrastructure, and synthetics in one stack
- Self-hosted open-source option plus Elastic Cloud
- Strong log search and analysis
- Resource-based cloud pricing depends on deployment size, so costs need modeling
- Running the stack yourself takes operational effort
Sentry suits development teams whose main observability job is finding and fixing errors. Error tracking, release health, and performance data sit together, so a team can link a crash to a release and a slow transaction. OpenTelemetry support helps teams that already instrument with OTel.
Sentry is not a full infrastructure monitoring platform on its own. Teams that need broad infrastructure, log, and APM coverage should pair it with Grafana Cloud, SigNoz, or a managed platform. For error-first teams, Sentry gives fast, actionable data at a clear entry price.
- Developer-focused error tracking with release health and performance data
- Supports OpenTelemetry and Prometheus data sources
- Self-hosted option for teams that need it
- Full MELT observability needs more than error tracking alone
- Event-based pricing rises with error and transaction volume
Uptrace suits cost-conscious teams that want an open-source, OpenTelemetry-native backend without enterprise pricing. Traces, logs, and metrics sit in one interface, with a cloud option for teams that do not want to run the backend themselves. The low entry cost makes it easy to test on a small service.
The ecosystem is smaller than larger rivals, and support, integrations, and enterprise features are more modest. Teams that need a huge integration catalog or enterprise compliance features should check those requirements first. For a small team that wants open, affordable observability, Uptrace is a practical pick.
- Open-source observability with traces, logs, and metrics in one interface
- OpenTelemetry-native design
- Low-cost cloud option compared with enterprise platforms
- Smaller ecosystem and fewer integrations than Datadog or New Relic
- Self-hosting still needs operational time for storage and retention
How we picked these
We compared observability platforms with a current product, a documented way to collect traces, logs, or metrics, and either OTLP ingest or a comparable agent. We favored platforms that cover at least two telemetry signals and that publish a free tier, trial, or entry price. Where pricing combined several meters, we used the published entry figure or wrote See website rather than inventing a single total.
What to check before you switch
Start with instrumentation, not the dashboard. Keep OpenTelemetry instrumentation where possible, since it lets you change backends without rewriting code. Test OTLP ingest, sampling, and attribute handling on a small service first, and confirm that traces, logs, and metrics correlate in the new platform.
Next, model the bill on your real shape. Host-based pricing suits many hosts with modest data, data-based pricing suits few hosts with large data, and event-based pricing suits low event counts with high cardinality. Include retention, query costs, user seats, and any required plan fee, and set a spending alert before the first large ingest.
Finally, test incident workflows, not just dashboards. Run a simulated incident, check alert routing, trace-to-log correlation, and retention for the data you need after the fact. A platform that looks good in a demo but hides key data after a few days will fail when an incident needs older evidence.
Frequently asked questions
Is OpenTelemetry a monitoring tool I can replace directly?
No. OpenTelemetry is an open standard and set of tools for generating traces, metrics, and logs, not a hosted backend. Alternatives in this guide are backends and platforms that store, query, and alert on that telemetry. Many of them accept OTLP data, so you can keep OpenTelemetry instrumentation and change the backend.
Can I keep OpenTelemetry instrumentation when switching platforms?
Yes, in many cases. SigNoz, Grafana Cloud, New Relic, Splunk Observability Cloud, and Uptrace support OTLP ingest, which lets you send OpenTelemetry data to a new backend. Test attribute handling, sampling, and correlation on a small service before a full migration.
Which option is cheapest for a small team?
SigNoz self-hosted, Grafana Cloud free tier, and Uptrace often have the lowest cash cost for small teams, while New Relic free tier covers 100 GB per month. The cheapest option depends on hosts, data volume, and whether you count engineering time for self-hosting. Model all three before choosing.
How do host-based and data-based pricing differ?
Host-based pricing charges per host or per unit of host capacity, regardless of data volume within limits, while data-based pricing charges per gigabyte, event, or sample ingested. Host pricing suits many-host, low-data fleets, while data pricing suits few-host, high-data services. Check retention and query fees in both models.
Do I need traces, logs, and metrics together?
Yes, for most production systems. Metrics show trends, logs show details, and traces show request paths across services. A platform that covers only one signal leaves gaps during incidents, when you need to move from a metric spike to a trace and then to the relevant log lines.
Can I self-host an observability platform?
Yes. SigNoz, Grafana open-source stack, Elastic, Sentry, and Uptrace offer self-hosted options, while Datadog, New Relic, Dynatrace, and Honeycomb are mainly managed services. Self-hosting gives data control but needs operational time for storage, retention, upgrades, and incident access.
Sources
- https://signoz.io
- https://grafana.com
- https://www.datadog.com
- https://newrelic.com
- https://www.dynatrace.com
- https://www.honeycomb.io
- https://www.splunk.com
- https://www.elastic.co
- https://sentry.io
- https://uptrace.dev
- https://www.apica.io/blog/how-to-choose-the-best-observability-tools/
- https://last9.io/blog/best-observability-tools/
See where you really rank - block by block
ProMapRanker scans Google Maps across a grid of your service area. Simple monthly plans from $19, white-label on every plan.
Start freeKeep reading
 zyte alternatives
Best Zyte Alternatives in 2026
These zyte alternatives cover managed scraping APIs, proxy networks and no code tools for lawful collection from your own or consented sources only in 2026.
Read → zerto alternatives
Best Zerto Alternatives in 2026
Compare the best zerto alternatives for disaster recovery and replication, with recovery targets, cloud options and honest trade-offs for teams in 2026.
Read → zerofox alternatives
Best ZeroFox Alternatives in 2026
We compared 9 zerofox alternatives for brand protection, phishing takedowns, dark web monitoring, and social impersonation, with clear coverage notes.
Read →