 ProMapRanker
Best OpenNMS Alternatives in 2026

Key takeaways
- Zabbix, LibreNMS and Icinga are the strongest free open source replacements for large network monitoring.
- PRTG and Checkmk suit teams that want faster setup and clearer paid support paths.
- Nagios XI suits teams that already know Nagios and want deep customization.
- SolarWinds and ManageEngine OpManager suit larger firms that want broad commercial toolsets.
- Use these tools only on networks you own or are authorised to administer and test.
Quick comparison
| Pick | Great for | Pricing starts at | Free tier | |
|---|---|---|---|---|
 Zabbix | Large open source monitoring | Free | Yes | Visit |
 PRTG Network Monitor | Easy setup for smaller teams | Free | Yes | Visit |
 Nagios XI | Custom Nagios monitoring | See website | Free trial | Visit |
 Checkmk | Hybrid infrastructure monitoring | Free | Yes | Visit |
 LibreNMS | Auto-discovery for networks | Free | Yes | Visit |
 Icinga | Modern open source monitoring | Free | Yes | Visit |
 SolarWinds Network Performance Monitor | Enterprise network monitoring | See website | Free trial | Visit |
 ManageEngine OpManager | All-round commercial monitoring | See website | Free trial | Visit |
The best opennms alternatives
OpenNMS monitors large networks with discovery, polling and alerting, but its scale and setup are not right for every team. The tools below cover the same job, from free open source platforms to commercial suites. Use them only for lawful, authorised administration and testing of networks you own or manage. We compared official feature pages, pricing pages and public reviews.
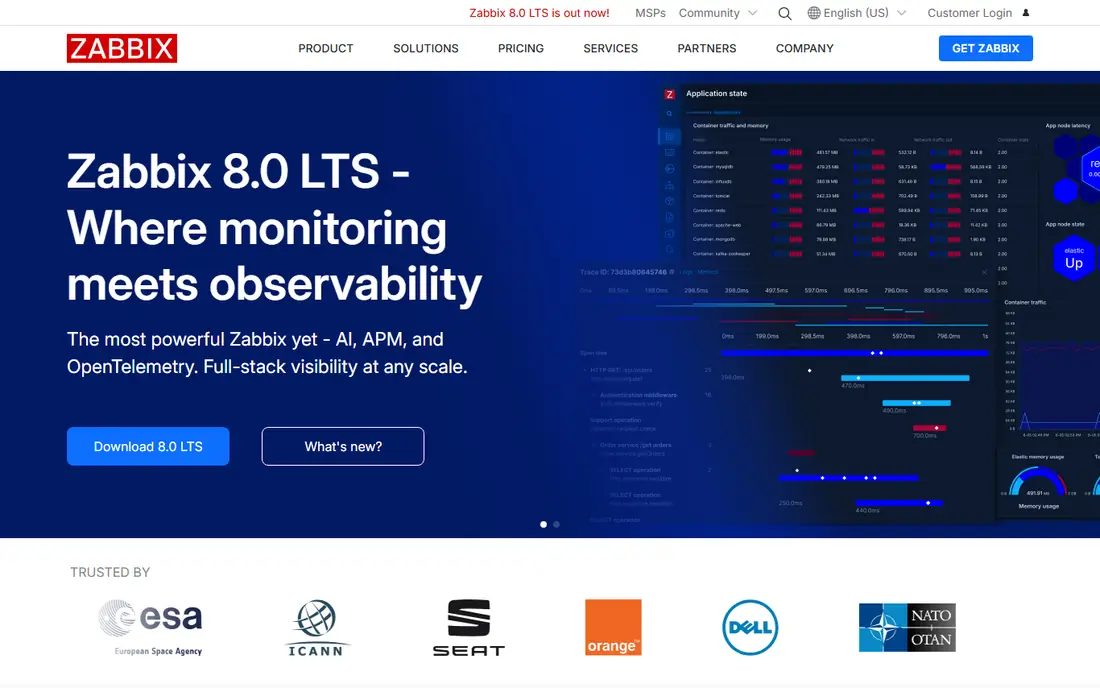
Zabbix is the most direct open source rival to OpenNMS for large estates. Templates cover routers, switches, servers and common services, so you can start monitoring many device types without building every check by hand. Alerting, graphing and API access support serious operations work.
New teams should expect a learning curve. Getting templates, triggers and dashboards tuned for your network takes real effort, and the interface is functional rather than friendly. For teams with Linux and networking skills, that effort buys a powerful free platform.
- Scales to large networks
- Templates for common devices
- Strong alerting and graphing
- Setup and tuning take time
- Interface takes learning for new admins
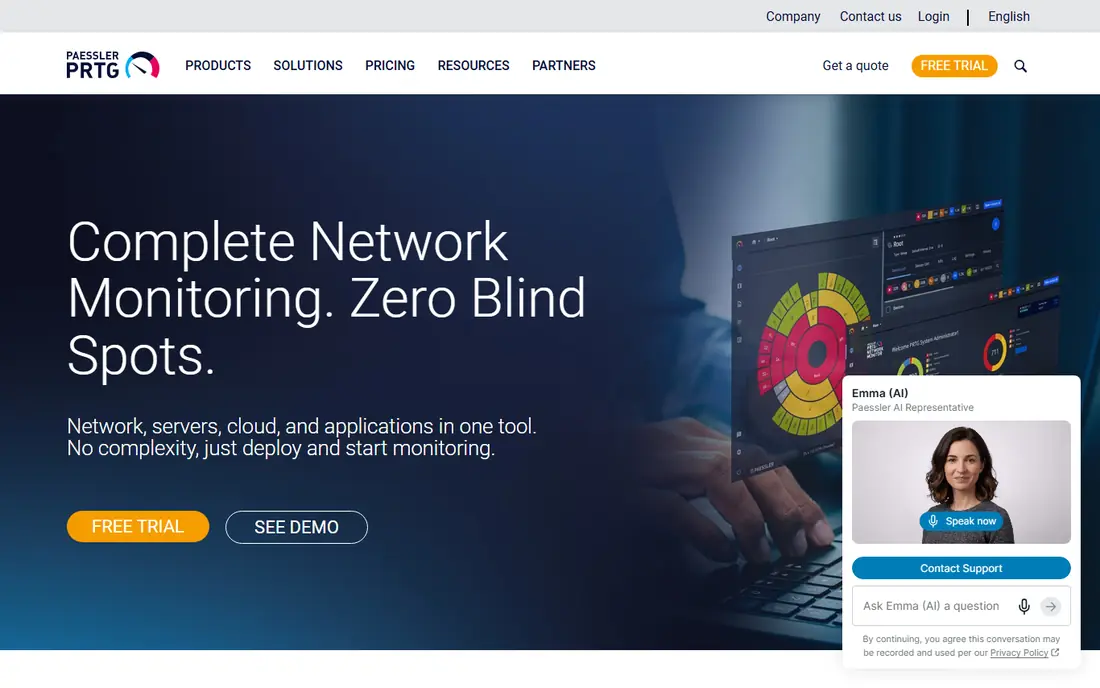
PRTG is the pick when you want monitoring live this week. Auto-discovery finds devices, sensors cover common metrics, and dashboards and alerts are ready without deep configuration. The free tier, covering up to 100 sensors, suits a small office or lab.
Scale is where the model changes. Each metric counts as a sensor, so a large network needs a paid tier that can cost far more than a free open source tool. Small and mid-size teams get the best balance of ease and cost here.
- Fast setup with auto-discovery
- Sensor-based model is easy to grasp
- Free tier for up to 100 sensors
- Sensor licensing can grow costly at scale
- Windows-first history still shapes some workflows
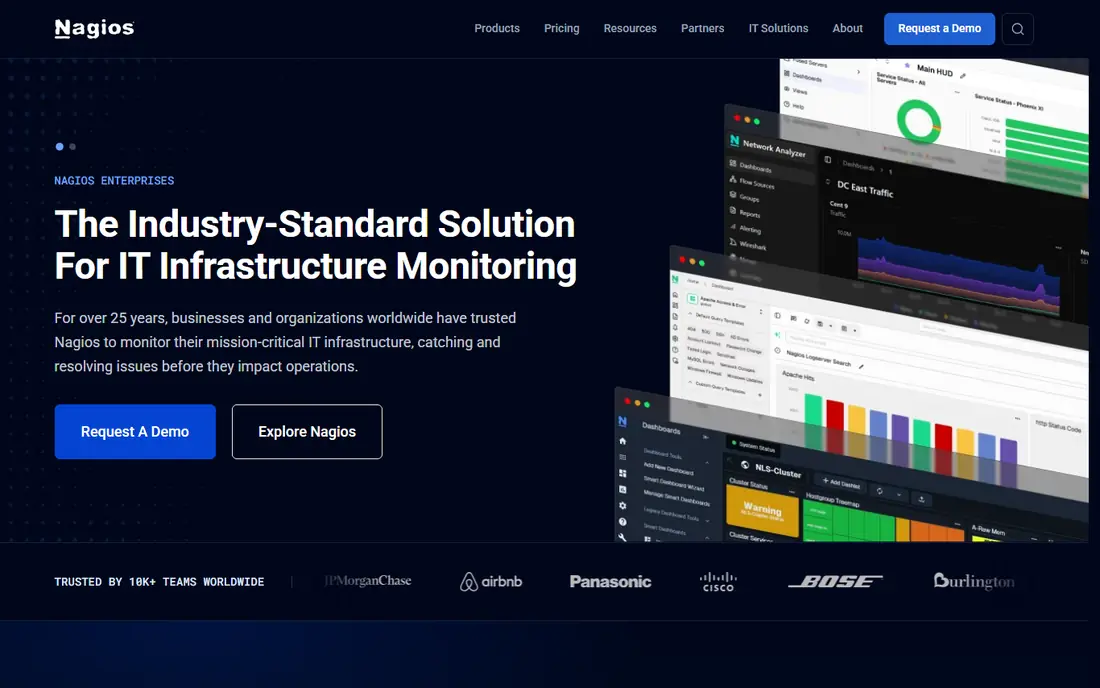
Nagios XI builds on the long-running Nagios Core tradition, adding a web interface, wizards and reporting to the classic plugin model. Thousands of community plugins cover unusual devices and services, which helps in mixed estates with older hardware. Custom checks let you monitor almost anything that returns a status.
The trade-off is age. Configuration and interface patterns feel older than Zabbix or Checkmk, and new admins may need time to learn Nagios concepts. Teams that already know Nagios will feel at home; newcomers may prefer a more modern setup.
- Huge plugin ecosystem
- Highly custom checks and alerts
- Long track record in operations teams
- Configuration can feel dated
- Commercial pricing is quote-based in many cases
Checkmk covers servers, networks, cloud services and containers from one platform, with a free Raw Edition for teams that want to self-support. Auto-discovery and rule-based configuration help you monitor many hosts without hand-writing every check. Paid editions add support, reporting and extra features.
Pricing for paid editions is based on monitored services, so you should size your estate before budgeting. The interface also packs in many options, which can overwhelm a first-time admin. Once configured, though, Checkmk is efficient and dependable.
- Raw Edition is free with unlimited hosts
- Strong auto-discovery
- Paid editions add support and features
- Paid pricing is service-based and needs careful sizing
- Interface has many options to learn
LibreNMS excels at finding and mapping networks. It discovers devices, interfaces and topology using common protocols, then graphs traffic and health over time. Network engineers who live in switches and routers often prefer its network-first view to server-first tools.
It is less of an all-round server and application monitor than Zabbix or Checkmk. Teams that also need deep server, database and cloud checks may pair it with another tool. For pure network visibility on a free platform, it is hard to beat.
- Strong network auto-discovery
- Topology maps from discovery protocols
- Free and open source
- More network-focused than server-focused
- Setup needs Linux skills
Icinga grew from Nagios roots but rebuilt the experience for modern infrastructure. You get flexible checks, alerting, dashboards and integrations, with configuration that suits automation and version control. It fits teams that like open source control without the oldest Nagios patterns.
Setup still demands technical skill. Databases, configuration and web setup need attention, and commercial support options are narrower than for SolarWinds or ManageEngine. Skilled open source teams will value the control; smaller teams may prefer PRTG.
- Modern take on Nagios-style monitoring
- Flexible configuration
- Strong alerting and dashboards
- Setup needs care with configuration files and databases
- Smaller commercial ecosystem than some rivals
SolarWinds Network Performance Monitor targets larger firms that need deep network visibility with commercial support. Maps, traffic analysis, alerting and reporting cover complex estates, and the wider SolarWinds suite can add server, database and security monitoring beside it. Enterprises with dedicated network teams get a complete commercial toolset.
Cost and weight are the honest limits. Pricing is quote-based and the platform is more than a small team needs, both in price and in administration. It earns its place for larger estates where support and breadth justify the spend.
- Broad device and traffic visibility
- Network maps and alerting
- Large commercial support ecosystem
- Quote-based pricing
- Full platform can be costly and heavy for small teams
ManageEngine OpManager covers networks, servers, virtual machines and storage from one console, with workflows for common fault and performance tasks. That breadth suits mid-size IT teams that want one commercial tool rather than several open source pieces. A free trial lets you test it against your real device count.
Pricing scales with devices, so count your estate before you budget. The console also holds many modules, which takes time to learn. Teams that want a single supported platform for network and server monitoring will find it a practical choice.
- Network, server and virtual monitoring together
- Workflows and alerting
- Free trial to test scale
- Pricing depends on device count
- Interface packs in many modules to learn
How we picked these
We compared official feature pages, pricing pages and public reviews for network monitoring tools that discover devices, poll health and traffic, alert on faults and graph trends over time. We kept tools that are live in October 2026 and suit networks of different sizes, from small offices to large enterprises. We framed every tool for lawful, authorised administration and testing only.
How to choose a monitoring tool
Start by counting what you actually monitor: devices, interfaces, servers and services. That count decides whether a free open source tool, a free tier with sensor limits, or a paid commercial license makes sense. A tool that fits 50 devices may fail at 500, and a tool built for 500 may be wasteful at 50.
Test discovery on your real network
Run discovery in a lab or a limited authorised segment first, and check what it finds, what it misses, and how noisy alerts are in the first week. Tune thresholds before you roll out widely, or alert fatigue will teach your team to ignore the system. Good monitoring is quiet until it matters.
Plan for data, backups and access control
Decide how long you keep metrics, who can see dashboards and alerts, and how you back up the monitoring server itself. Restrict access to authorised admins, use read-only accounts where possible, and never use monitoring access to probe networks you do not own or manage.
Start with alerts that respect on-call time
A monitoring tool that pages your team for every minor blip will soon be ignored, so tune alert thresholds during the first two weeks and separate warning alerts from urgent pages. Review the noisiest alerts weekly, fix the underlying cause where you can, and silence known maintenance windows in advance. Calm, trusted alerting is what makes a monitoring platform useful over months rather than just impressive on day one.
Frequently asked questions
Which OpenNMS alternative is best for a small network?
PRTG suits small networks thanks to fast setup and a free tier for up to 100 sensors. LibreNMS and Zabbix also work well for free, but they need more setup skill.
Is Zabbix really free?
Yes, Zabbix itself is free open source software. You still pay for the server it runs on, and you may pay for commercial support if you want it, but there is no software license fee for the core platform.
Do I need permission to monitor a network?
Yes, only monitor networks you own or are authorised to administer and test. Unauthorised scanning or monitoring of other networks can break the law and your acceptable-use rules, even when the tool itself is legal.
What is the difference between sensor-based and host-based pricing?
Sensor-based pricing, as in PRTG, charges per metric checked, while host-based or service-based pricing charges per device or monitored service. Count your metrics and devices before comparing prices, since the cheaper model depends on your estate.
Can these tools monitor cloud and virtual infrastructure too?
Most can, with Checkmk, Zabbix, SolarWinds and OpManager covering cloud, virtual and container resources alongside physical networks. Check the vendor docs for your specific cloud platform before you commit.
Sources
See where you really rank - block by block
ProMapRanker scans Google Maps across a grid of your service area. Simple monthly plans from $19, white-label on every plan.
Start freeKeep reading
 zyte alternatives
Best Zyte Alternatives in 2026
These zyte alternatives cover managed scraping APIs, proxy networks and no code tools for lawful collection from your own or consented sources only in 2026.
Read → zerto alternatives
Best Zerto Alternatives in 2026
Compare the best zerto alternatives for disaster recovery and replication, with recovery targets, cloud options and honest trade-offs for teams in 2026.
Read → zerofox alternatives
Best ZeroFox Alternatives in 2026
We compared 9 zerofox alternatives for brand protection, phishing takedowns, dark web monitoring, and social impersonation, with clear coverage notes.
Read →