 ProMapRanker
Best New Relic Alternatives in 2026


Teams that want one vendor for metrics, logs and traces · Pricing starts at: $15 per host per month
Key takeaways
- Datadog is the broadest replacement, with infrastructure, APM, logs and security in one platform.
- Grafana Cloud and SigNoz suit teams that already use open standards and want clearer usage pricing.
- Honeycomb fits trace-first debugging, while Sentry fits error tracking tied to code releases.
- Dynatrace and Splunk suit large enterprises, but their pricing needs a careful budget check.
- Start with data volume, not features, because logs and traces drive most observability bills.
Quick comparison
| Pick | Great for | Pricing starts at | Free tier | |
|---|---|---|---|---|
| Datadog | Teams that want one vendor for metrics, logs and traces | $15 per host per month | Free trial | Visit |
 Dynatrace | Large teams that want automatic discovery and root cause analysis | $29 per host per month | Free trial | Visit |
 Grafana Cloud | Teams already using Prometheus and Grafana dashboards | $19 per month | Yes | Visit |
 Honeycomb | Debugging complex distributed systems by trace | $150 per month | Yes | Visit |
 Sentry | Developers who need errors tied to releases | See website | Yes | Visit |
 Elastic Observability | Teams that already search logs in Elasticsearch | See website | Free trial | Visit |
 Splunk Observability | Enterprises with large log and metric estates | See website | Free trial | Visit |
 AppDynamics | Teams that link performance to business transactions | See website | Free trial | Visit |
 SigNoz | Open source teams that want Datadog-style views without host pricing | $49 per month | Yes | Visit |
The best new relic alternatives
New Relic itself is not listed here, because this article covers alternatives to it. Each tool below covers application performance, infrastructure or logs, and we note where a tool is narrow by design.
Datadog starts with Infrastructure Monitoring at $15 per host per month on annual billing, with APM listed higher, at $31 per host per month in recent pricing summaries. That breadth is the main reason teams choose it: one agent and one interface can cover servers, containers, applications, logs and user experience. Integrations for cloud services, databases and common tools are extensive.
The catch is the bill. Each product has its own meter, for hosts, ingested logs, indexed events, custom metrics and retention, so a busy service can grow costs in several places at once. Teams should set usage caps, sample traces early and review the bill after the first month. For a team that wants a single platform and can manage usage, Datadog is our pick for most people.
- Very broad integration range
- Strong dashboards and alerts
- APM, logs, security and synthetic checks in one place
- Modular pricing can rise fast
- Learning the billing model takes time
Dynatrace
Great for: Large teams that want automatic discovery and root cause analysis
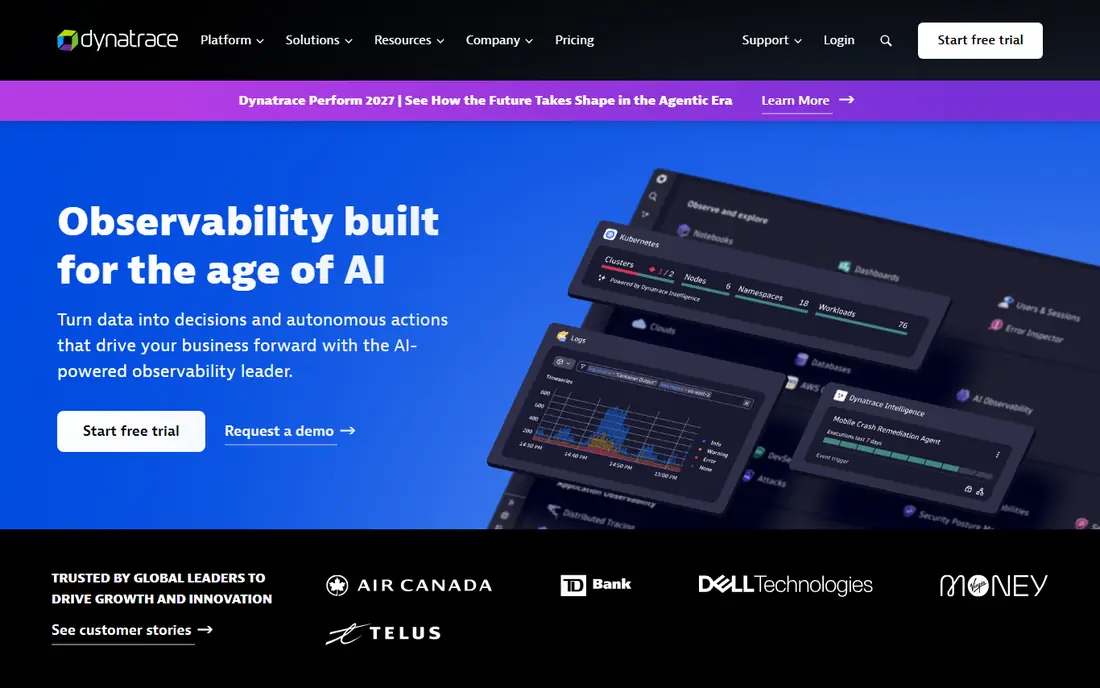
Dynatrace uses a platform subscription that draws down against a rate card, with Infrastructure Monitoring listed at $29 per host per month and a lower Foundation tier for basic host health. Once the agent is installed, it maps hosts, processes, services and dependencies without much manual setup, and it groups related alerts into problems with a likely cause.
That automation helps large estates where manual dashboards would lag behind change. The trade-off is commitment: Dynatrace is built around an annual platform commitment rather than a simple monthly plan, and log ingest and retention are separate meters. Small teams may find the entry cost high, while enterprises often value the guided analysis enough to pay it.
- Automatic topology and dependency mapping
- Strong AI-assisted problem detection
- Infrastructure and full-stack options
- Annual commitment model
- Pricing is harder to compare at a glance
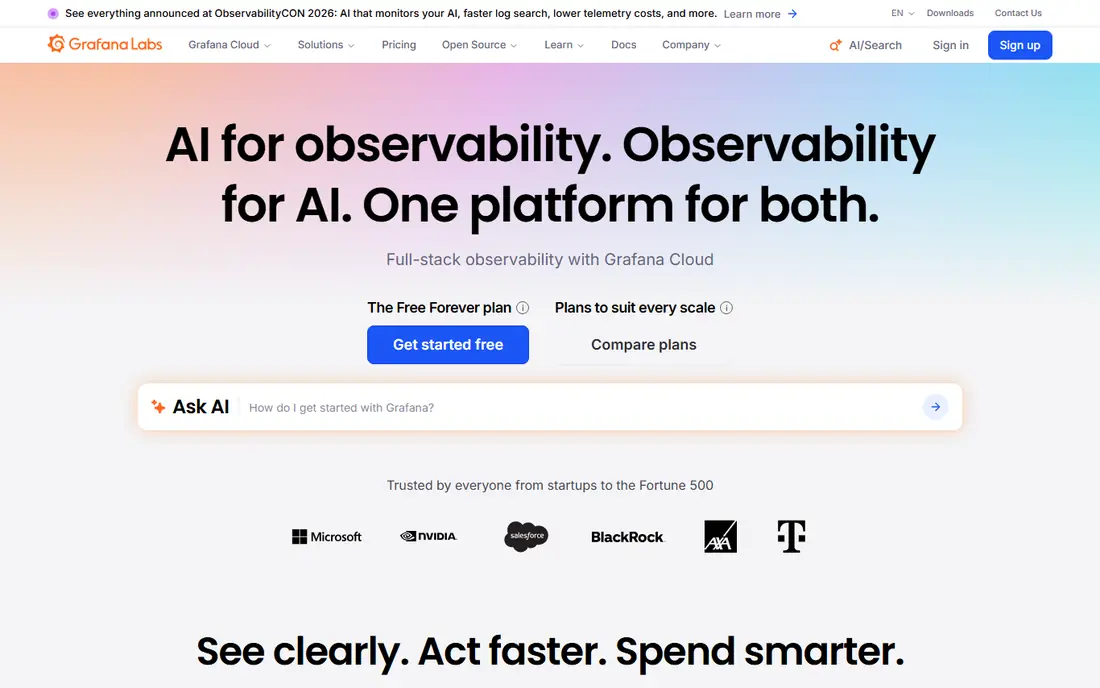
Grafana Cloud gives a free tier with 10,000 active series, 50 GB each for logs, traces and profiles, and 14-day retention, plus a Pro plan from $19 per month plus usage. Teams that already run Grafana or Prometheus can keep their dashboards and move the storage and querying to a managed service. The LGTM stack covers visualization, metrics, logs and traces in one account.
The limit is that Pro is usage-based, so active series, log volume and retention decide the real bill. That is still clearer than some host-based models, because the meters map to data you send. For open source teams that want managed scale without a rewrite, Grafana Cloud is a strong, low-risk move.
- Free tier with metrics, logs and traces
- Open standards support
- Familiar dashboards
- Usage above the free tier adds up
- Some enterprise features need a large commitment
Honeycomb treats traces and wide events as the main unit, which suits teams debugging requests that cross many services. You can slice by user, build, region or any field you send, without pre-aggregating the data away. The free tier covers up to 20 million events per month, and Pro starts at $150 per month with higher event and metrics allowances.
Honeycomb is less of a general infrastructure monitor than Datadog or Dynatrace. It shines when the question is why a specific request was slow or failed, not when you need a full server fleet view. Teams should plan sampling with Refinery or another tool, because unsampled high-volume traces can burn the event allowance quickly.
- Fast querying across high-cardinality fields
- Free tier up to 20 million events per month
- OpenTelemetry support
- Event-based pricing needs sampling discipline
- Fewer infrastructure features than Datadog
Sentry focuses on what developers check first after a deploy: errors, crashes and slow transactions, grouped by issue and linked to a release and a code location. That focus makes triage fast, and it covers web, mobile and backend languages widely. Teams can add performance monitoring and session replay on higher plans.
Sentry does not replace server, network or log monitoring on its own. It pairs well with Grafana, Datadog or a log tool for the infrastructure side. If your main gap is noisy error reports and slow deploys, Sentry is a focused and affordable start, with a free tier for small projects.
- Clear error grouping with stack traces and release data
- Performance tracing for web and mobile
- Broad language support
- Not a full infrastructure platform
- High event volume can raise cost
Elastic Observability builds on Elasticsearch, so teams that already store logs there can add APM, infrastructure metrics, synthetic checks and uptime in the same search model. Kibana dashboards and alerting cover the usual views, and Elastic Cloud removes the need to run clusters yourself. Self-managed deployment remains an option for teams with strict data rules.
The trade-off is operational weight for self-managed setups. Index design, retention and cluster sizing affect both speed and cost, and a poorly tuned cluster can be slow. Hosted Elastic Cloud simplifies that, but the bill follows data volume and compute. For search-heavy teams, the familiar query model is a real advantage.
- Search across logs, metrics, traces and uptime
- Flexible deployment options
- Strong query language
- Running it yourself needs tuning
- Hosted pricing depends on data and resources
Splunk Observability Cloud covers infrastructure monitoring, APM, logs, real user monitoring and synthetics, and it pairs with Splunk Enterprise and Splunk Cloud for security work. Large teams value the search depth and the ability to correlate an application problem with logs and security events in one place. Retention and streaming options suit regulated work.
The main drawback for smaller buyers is price transparency. Many plans are quoted, so a team must talk to sales to budget properly, and ingested volume still drives cost. Splunk also rewards teams that learn its query language. For a large enterprise already on Splunk, staying in that family often beats adding a second platform.
- Deep log search and correlation
- Broad enterprise integrations
- Strong security and observability pairing
- Pricing is quote-based for many plans
- Setup and query skill matter
AppDynamics, part of Cisco, traces business transactions from user actions through application code, databases and infrastructure. That view helps teams answer which transactions slowed, which customers were affected and where the delay sat. Dashboards link performance to business outcomes rather than server graphs alone.
AppDynamics is aimed at enterprises, so pricing and packaging are less self-serve than smaller tools. Teams that want a quick free start may prefer Grafana Cloud or SigNoz first. For a large company that already uses Cisco tools and needs transaction-level reporting, AppDynamics is a credible New Relic replacement.
- Business transaction tracing
- Application and infrastructure views
- Cisco support and integrations
- Enterprise pricing and packaging
- Narrower open source feel than Grafana or SigNoz
SigNoz
Great for: Open source teams that want Datadog-style views without host pricing
SigNoz is open source observability software that you can self-host for free or run on SigNoz Cloud, where the Teams plan starts at $49 per month including that amount of usage. Logs and traces are priced per GB ingested, and metrics per million samples, with no per-host fee. That model is easy to reason about for a team that already sends OpenTelemetry data.
The catch is maturity in some enterprise areas, such as access controls and audit features, which are still growing on the cloud plans. Self-hosting also puts scaling, backups and retention on your team. For a cost-conscious team that values open standards and a single query view, SigNoz is the best open option in this list.
- Open source core built on OpenTelemetry and ClickHouse
- Logs, traces and metrics in one UI
- Cloud from $49 per month
- Smaller enterprise feature set
- Self-hosting needs care for scaling and retention
How we picked these
We compared official pricing pages, feature pages and documentation for tools that cover APM, infrastructure or logs, and we excluded tools that only do uptime checks or only do error alerts. We used published starting prices where a vendor lists them and marked quote-based products as See website. New Relic itself was excluded, since this article lists alternatives to it.
What to check before you switch
Start by measuring what you send today: log volume per day, trace volume, metric series and retention needs. Those numbers decide the bill on almost every platform here, and a feature comparison without them can mislead. Run a trial with one service first, not the whole estate, and compare dashboard load times and alert noise.
Next, check agent and OpenTelemetry support for your languages and frameworks. A tool that needs a custom agent for every service will slow adoption, while OpenTelemetry support makes a later move easier. Test alerts, dashboards and on-call integrations during the trial, because a pretty dashboard that pages the wrong team is not a win.
Finally, plan the migration in stages. Keep New Relic running while the new tool proves itself, move one team at a time, and set a date to turn off old ingestion. That overlap costs a little extra for a short period, but it avoids a blind spot during the switch.
Frequently asked questions
What are the best alternatives to new relic?
Datadog is the broadest match, Grafana Cloud and SigNoz suit open standards teams, Honeycomb suits trace debugging, and Dynatrace and Splunk suit large enterprises. The best choice depends on data volume, team size and whether you need infrastructure, APM or logs most.
Is there a free new relic alternative?
Yes. Grafana Cloud has a free tier, Honeycomb has a free tier up to 20 million events per month, Sentry has a free tier, and SigNoz can be self-hosted for free apart from your own hosting costs. Free tiers limit volume and retention, so they suit small projects and trials first.
Which new relic alternative is cheapest for a small team?
SigNoz Cloud and Grafana Cloud usually cost least for small volumes, because they charge by usage rather than by host or by full platform user. Honeycomb is also low cost at small scale, while Datadog and Dynatrace can cost more once hosts and logs grow.
Do these tools support OpenTelemetry?
Yes, in most cases. Grafana Cloud, Honeycomb, SigNoz, Datadog, Elastic and Splunk all support OpenTelemetry ingestion, though the depth of support varies by signal. Check your language SDKs and whether traces, metrics and logs all flow through the same pipeline.
Can I self-host a new relic alternative?
Yes. SigNoz and Grafana are open source and can be self-hosted, and Elastic can be self-managed. Datadog, Honeycomb, Dynatrace and Splunk Observability Cloud are mainly hosted services, so self-hosting is not the main path for those tools.
Sources
See where you really rank - block by block
ProMapRanker scans Google Maps across a grid of your service area. Simple monthly plans from $19, white-label on every plan.
Start freeKeep reading
 zscaler alternatives
Best Zscaler Alternatives in 2026
Looking for zscaler alternatives? We compare 9 SASE and zero trust platforms on architecture, data protection, pricing, and fit for your network and team.
Read → zapier alternatives free
Best Zapier Alternatives Free in 2026
Nine automation tools for zapier alternatives free in 2026, all with genuinely free tiers, plus free plan limits, starting prices and upgrade paths explained.
Read → which platform is best for online reputation
Which Platform Is Best for Online Reputation in 2026
Wondering which platform is best for online reputation? We compare 8 review, listing, and response tools for small and multi-location businesses and agencies.
Read →