 ProMapRanker
Best Netdata Alternatives in 2026

Key takeaways
- Prometheus and Zabbix give you full control with no licence fee, if you have time to run them.
- Grafana Cloud and New Relic offer generous free tiers for small teams that want managed dashboards fast.
- Datadog and Dynatrace cover the widest observability ground, but their usage-based bills need active control.
- PRTG and Checkmk suit teams that want sensor or host-based monitoring with clear on-premises deployment.
Quick comparison
| Pick | Great for | Pricing starts at | Free tier | |
|---|---|---|---|---|
 Datadog | Full-stack observability | $15 per host per month | Yes | Visit |
 Grafana Cloud | Managed dashboards and alerts | Free | Yes | Visit |
 Prometheus | Open source metrics | Free | Yes | Visit |
 Zabbix | Large-scale infrastructure monitoring | Free | Yes | Visit |
 New Relic | Managed observability with a free tier | Free | Yes | Visit |
 PRTG Network Monitor | Sensor-based network monitoring | See website | Yes | Visit |
 Checkmk | Auto-discovery infrastructure monitoring | See website | Yes | Visit |
 Nagios XI | Classic host and service checks | See website | Free trial | Visit |
 Dynatrace | Enterprise application observability | See website | Free trial | Visit |
The best Netdata alternatives
Netdata is known for fast setup and per-second metrics on a single host. The tools below trade that simplicity for wider coverage, longer retention, or deeper application insight. We compared official pricing, free tiers, and deployment options.
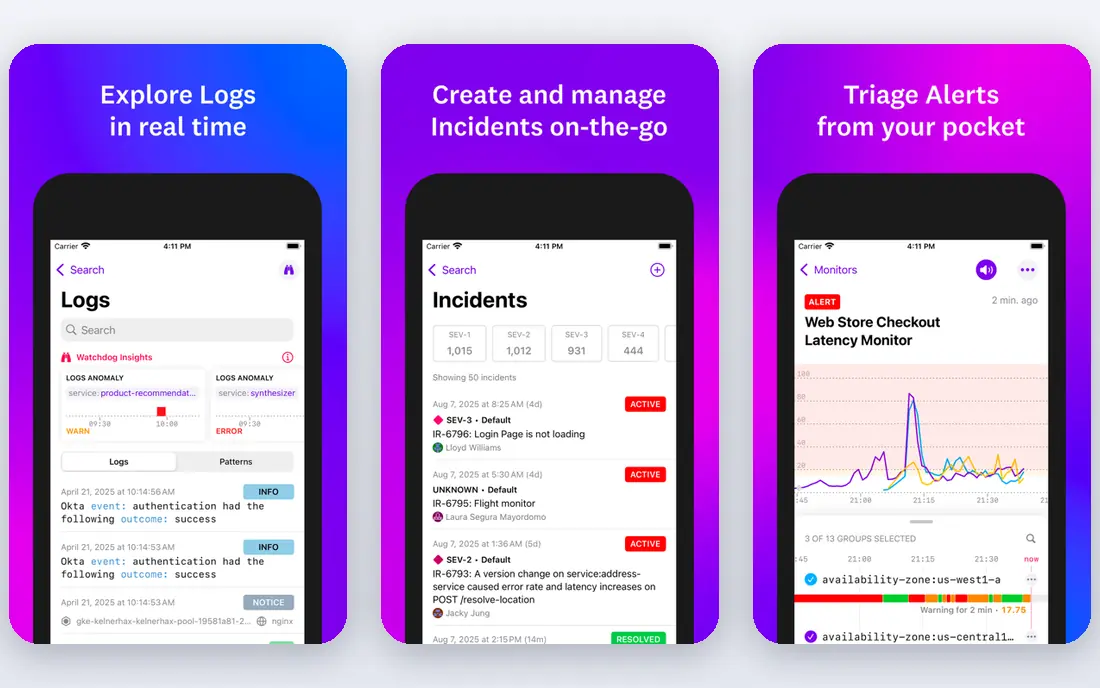
Datadog is the most complete managed option on this list. Infrastructure metrics, application traces, logs, and synthetic checks sit in one product, and the integration catalogue covers most cloud and on-premises tools a team already uses. For a growing team that wants one vendor, that breadth is hard to match. The risk is cost control. Each product, host, and log volume adds to the bill, so you should set usage alerts and retention rules from day one. Model the bill at a larger size than today, because a setup that looks cheap for five hosts can change quickly at fifty.
- Broad integrations
- Strong correlation of metrics, logs, and traces
- Polished dashboards
- Bills grow with hosts, logs, and products
- Pricing has many moving parts
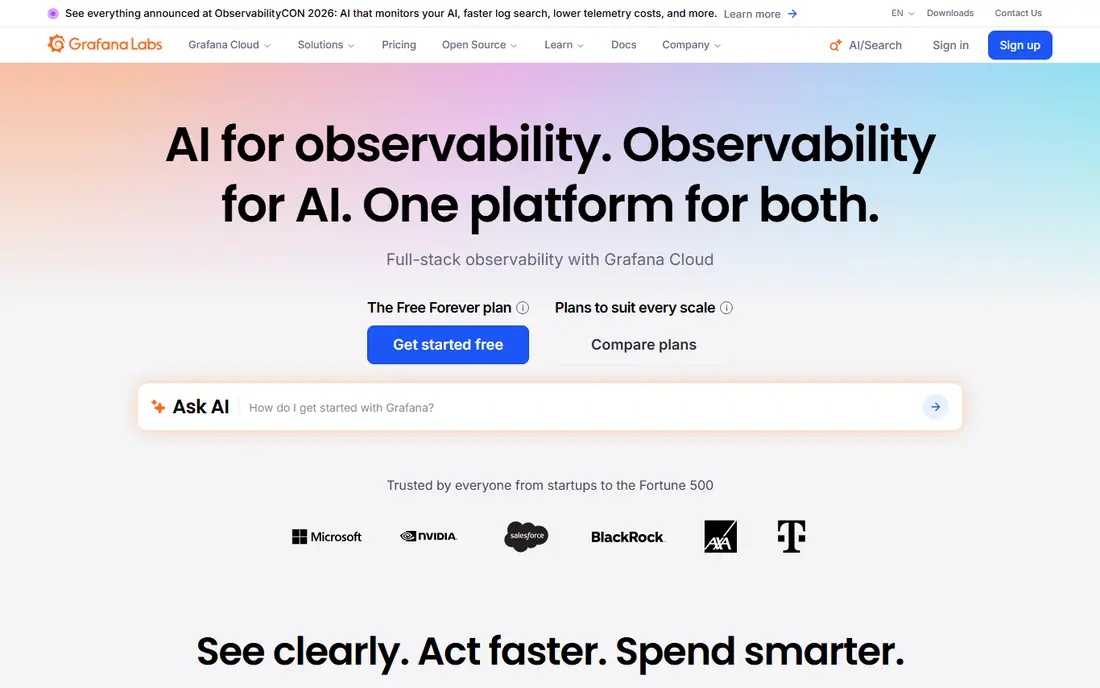
Grafana Cloud gives small teams a managed start without building a full monitoring stack. The free tier covers metrics, logs, and traces for a small number of users, and paid plans start with a platform fee plus usage. Dashboards are flexible, and alert rules can draw on several data sources at once. The trade-off is that Grafana is a visualisation and alerting layer first. You still need to choose and feed it data sources, and a messy dashboard set can confuse on-call staff. With a clear set of golden signals per service, Grafana Cloud is a strong Netdata replacement for teams that want control over how data looks.
- Flexible dashboards
- Free tier with metrics, logs, and traces
- Works with Prometheus and other sources
- Usage-based costs above the free tier
- Dashboard design takes time to do well
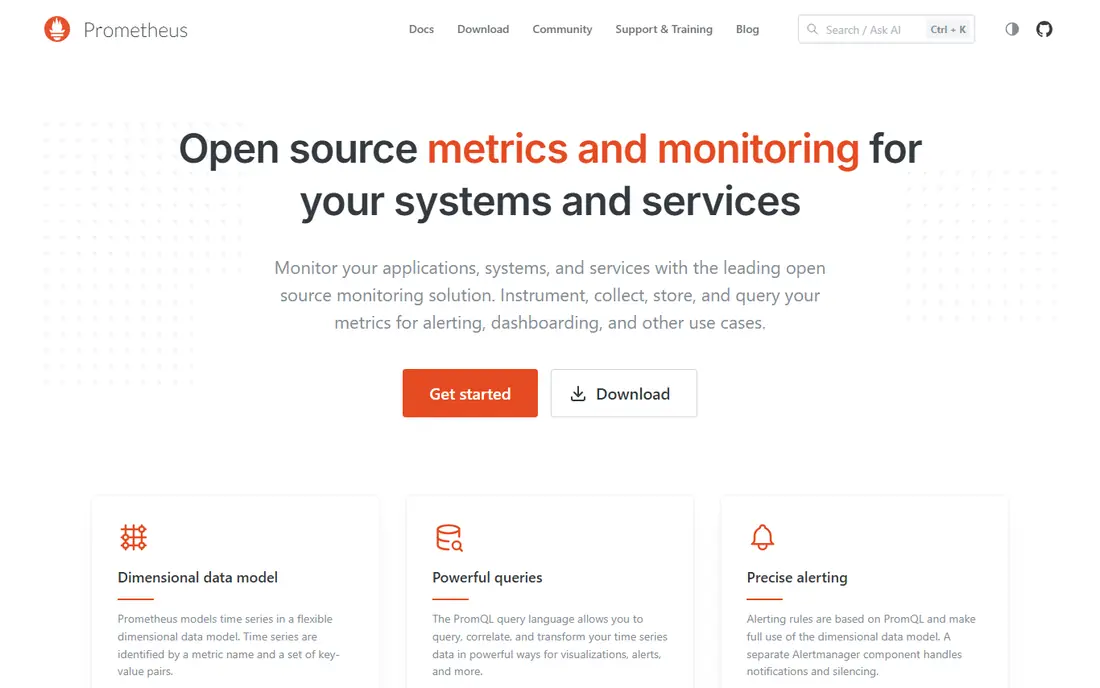
Prometheus is the open source standard for metrics in cloud-native teams. It scrapes targets, stores time series, and answers queries in PromQL, and it pairs naturally with Grafana for dashboards. For Kubernetes estates, service discovery and exporter coverage make it a natural fit. Prometheus alone is not a complete monitoring product. Long-term retention, high availability, and alert routing usually need extra components such as Alertmanager and a remote storage option. Teams with platform skills get a flexible, low-licence-cost stack. Teams without that time may prefer a managed option.
- No licence fee
- Strong Kubernetes support
- Powerful query language
- Long-term storage and alerting need extra parts
- Setup takes platform skill
Zabbix suits teams that monitor a large estate of servers, virtual machines, and network devices. It discovers hosts, applies templates, and raises alerts from agents or agentless checks, all without a per-host licence fee. That model keeps costs predictable as the estate grows. The interface and template work are the honest limits. Zabbix dashboards are functional rather than polished, and getting templates right for a new device type takes care. If your team values scale and licence control over visual polish, Zabbix remains a dependable pick.
- No licence fee
- Auto-discovery
- Scales to many hosts and network devices
- Interface feels dated next to modern SaaS tools
- Tuning templates takes time
New Relic is a good managed step up from Netdata for teams that want application insight as well as host metrics. The free tier includes 100 GB of data per month and one full user, which covers small teams and side projects. Agents install quickly, and dashboards link infrastructure data to application traces. Watch the user model on paid plans. Adding full users costs more than adding data alone, so plan who needs full access and who can use a basic view. For small teams, the free tier alone may cover daily monitoring for a long time.
- Usable free tier with 100 GB per month
- Full-stack metrics, traces, and logs
- Quick agent setup
- Paid user pricing rises with team size
- Data over the free allowance is billed
PRTG is built around sensors, where each sensor checks one thing, such as CPU load, disk space, or a switch port. That model makes it easy to see exactly what you monitor and what it costs. The free tier covers 100 sensors, which suits a small office or a home lab. Sensor counting is also the limit. A single server can use many sensors, so a medium estate can reach paid tiers quickly. Map your sensors before you buy, and keep the dashboard focused on checks that lead to action, rather than adding sensors for every available metric.
- Free tier with 100 sensors
- Clear sensor model
- Strong Windows and network coverage
- Pricing is sensor-based, so large estates cost more
- Cloud option is newer than on-premises use
Checkmk discovers hosts and services automatically, then applies rules to decide what to monitor and alert on. That approach suits teams with changing estates, where manual setup for each new host would fall behind. The product covers servers, networks, and cloud resources in one view. Pricing for larger editions is quote-based, so small teams should start with the free edition and confirm what they need before talking to sales. The rule system is powerful, but it takes a little time to learn. Once set, it reduces the manual work of keeping monitoring up to date.
- Strong auto-discovery
- Clear host and service views
- On-premises and cloud options
- Quote-based pricing for larger editions
- Initial rule setup rewards patience
Nagios XI is the commercial form of a long-running monitoring tradition. It checks hosts and services, raises alerts in clear states, and draws on a large plugin ecosystem for devices and applications. Teams that already know Nagios concepts can move quickly. Newer teams may find the setup and interface less friendly than Grafana Cloud or New Relic. Nagios rewards careful configuration, and large estates need planning for performance and redundancy. It remains a solid choice where classic checks and plugin coverage matter most.
- Long history in host and service monitoring
- Large plugin ecosystem
- Clear alert states
- Interface and setup feel older than modern tools
- Scaling needs planning
Dynatrace suits large organisations that need application performance insight tied to infrastructure and user experience. Its agent discovers services automatically, maps dependencies, and highlights likely root causes when something fails. For complex Java, .NET, and cloud estates, that depth saves investigation time. Small teams may find Dynatrace more than they need. Pricing is enterprise-grade and the product has many features that a five-host estate will not use. If your main need is host metrics and simple alerts, start with a lighter tool on this list and move up only when application tracing becomes the bottleneck.
- Deep application and infrastructure insight
- Automated discovery and root-cause analysis
- Broad enterprise coverage
- Enterprise pricing
- Feature depth can overwhelm small teams
How we picked these
We compared official pricing pages, free tier details, and product documentation for monitoring tools that work in October 2026. We kept tools that cover host or infrastructure metrics, alerting, and dashboards, and we included both open source and managed options. We left out status page tools and on-call-only tools, because they do not replace host monitoring on their own.
How to choose without overbuying
Start with the signals that wake you up at night. For most small teams, that list is short: host CPU and memory, disk space, service health, and a key application check. Pick a tool that covers those signals well, and add deeper tracing only when you can name a problem it would have solved. Next, decide who operates the tool. Open source options save licence fees but cost engineering time for setup, upgrades, and retention. Managed options cost more in cash but start faster and handle upgrades for you. Be honest about that trade, because an unmaintained monitoring stack fails quietly. Finally, test alerting before you rely on it. Send a test alert to the on-call channel, confirm it arrives, and check that silencing and acknowledgement work as expected. A dashboard that looks good but never alerts is not monitoring, it is decoration.
Frequently asked questions
Which Netdata alternative is closest in setup speed?
Grafana Cloud and New Relic are closest for managed setup, because agents and free tiers get you running quickly. Prometheus and Zabbix are closer in control, but they take longer to install and tune. If setup speed is the top priority, start with a managed free tier.
Is Prometheus a full replacement for Netdata?
Prometheus replaces the metrics part well, especially with Grafana for dashboards, but you need extra parts for long-term storage and alert routing. Netdata gives a ready dashboard per host out of the box, while Prometheus gives a more flexible stack that you assemble. Both can work, but the effort differs.
Do I need Datadog or Dynatrace for a small server estate?
Usually no. For a handful of servers, Grafana Cloud, New Relic, PRTG, or an open source tool covers host metrics and alerts at lower cost. Move to Datadog or Dynatrace when application tracing, large estates, or complex dependencies become your main problem.
Can I monitor for free?
Yes, with limits. Prometheus, Zabbix, and Grafana Cloud offer free use, and New Relic offers a free data allowance. Free tiers suit small estates, but check retention, user limits, and data caps before you depend on them for production alerts.
How do I avoid a surprise monitoring bill?
Set usage alerts, limit log retention, and review host and data counts each month. Usage-based tools bill by hosts, data volume, or users, so a new service or a verbose log source can change the bill fast. Review the bill after the first full month, not after a year.
Sources
See where you really rank - block by block
ProMapRanker scans Google Maps across a grid of your service area. Simple monthly plans from $19, white-label on every plan.
Start freeKeep reading
 zoro.to alternatives
Best Zoro.to Alternatives in 2026
We compare the best zoro.to alternatives in 2026, listing only legal licensed anime streaming services, from Crunchyroll to free options for fans today.
Read → zip alternatives
Best Zip Alternatives in 2026
We compare the best zip alternatives for buy now, pay later in 2026, covering pay-in-4 plans, fees, spending limits, and credit reporting options today.
Read → yesware alternatives
Best Yesware Alternatives in 2026
Compare the best yesware alternatives for sales email tracking, templates, and sequences, with current pricing and honest tradeoffs for small sales teams.
Read →