 ProMapRanker
Best LogicMonitor Alternatives in 2026

Key takeaways
- Datadog and Dynatrace suit cloud and application heavy teams, while Zabbix, PRTG and Checkmk suit network and infrastructure focused teams.
- Open source tools cut licence costs but add setup and maintenance work, so count staff time as well as the price.
- Pricing models differ widely, from per host to per sensor to quote only, so compare the bill at your real device and host count.
- A trial with your actual servers, network devices and cloud accounts tells you more than a feature list.
Quick comparison
| Pick | Great for | Pricing starts at | Free tier | |
|---|---|---|---|---|
 Datadog | Cloud and full stack monitoring | $15 per month | Yes | Visit |
 Dynatrace | AI assisted root cause analysis | See website | Free trial | Visit |
 Zabbix | Open source infrastructure monitoring | Free | Yes | Visit |
 Paessler PRTG | Sensor based network monitoring | See website | Free trial | Visit |
 ManageEngine OpManager | Budget network monitoring | See website | Free trial | Visit |
 SolarWinds Observability | SolarWinds ecosystem teams | See website | Free trial | Visit |
 New Relic | Application performance monitoring | Free | Yes | Visit |
 Grafana Cloud | Flexible dashboards and visualisation | See website | Yes | Visit |
 Checkmk | Scalable open source monitoring | See website | Free trial | Visit |
The best logicmonitor alternatives
We compared official pricing and feature pages, plus public documentation, for tools that monitor servers, networks, cloud services and applications in one place. Our pick for most teams is Datadog, because it covers infrastructure, logs and application traces together, with a free tier for getting started.
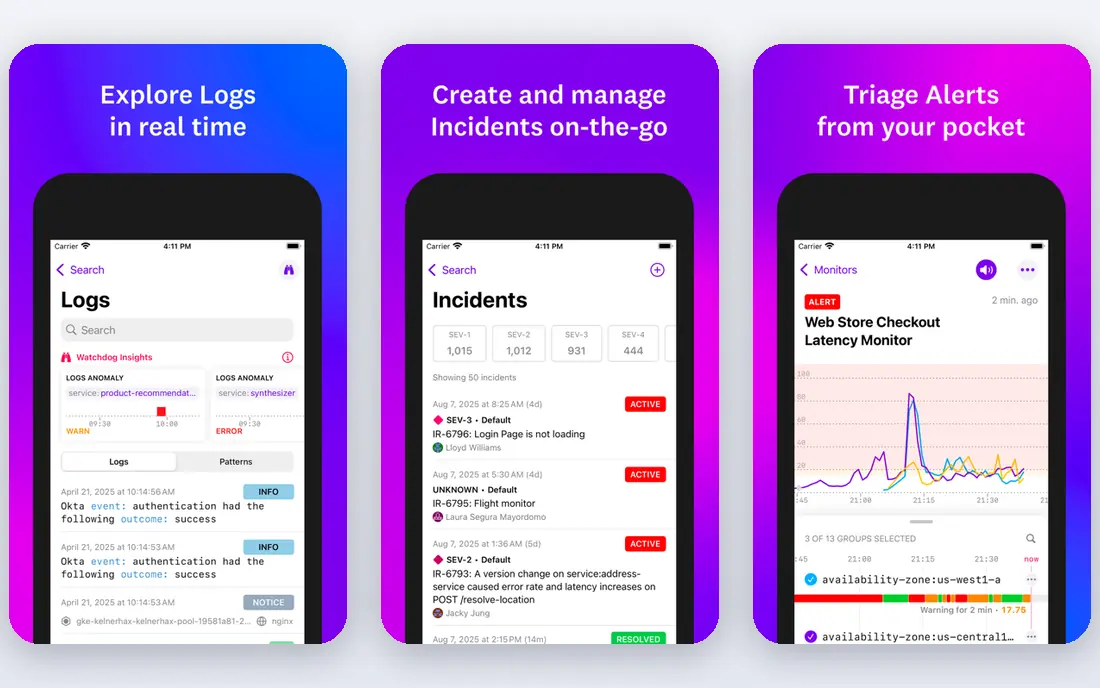
Datadog suits teams running cloud workloads, containers and modern applications. You install agents on hosts, connect cloud accounts, and see infrastructure metrics, application traces and logs side by side. That shared view helps a team move from a slow page to the service, host or database query behind it without switching tools.
The main risk is cost control. Each product area is billed separately, so a team that turns on everything can face a larger bill than expected. Start with infrastructure monitoring, set usage alerts, and add logs or application monitoring only where they solve a real problem. For cloud native teams, the breadth still makes Datadog a strong first choice.
- Broad integrations across cloud and applications
- Metrics, logs and traces in one platform
- Strong alerting and dashboards
- Costs can rise quickly as hosts, logs and custom metrics grow
- Setup takes time for large estates
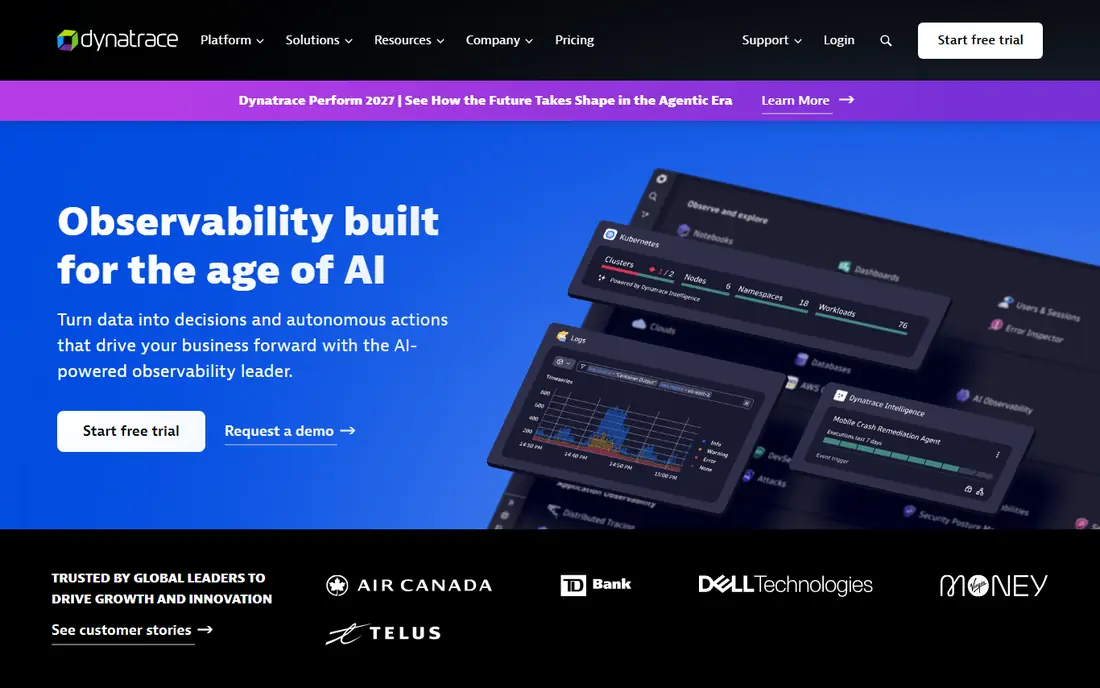
Dynatrace aims to cut the manual work of mapping a complex estate. Its agent discovers services, hosts and dependencies automatically, then groups related alerts into a single problem with a likely root cause. For teams drowning in separate alerts, that grouping alone can save hours during an incident.
The trade-off is price and complexity. Dynatrace is built for mid sized and large organisations, and smaller teams may find the entry cost hard to justify. A trial on a real production-like workload is worth it, because the value shows only when the automatic mapping matches your actual architecture. If it does, Dynatrace is one of the strongest options here.
- Automatic discovery of services and dependencies
- AI based problem detection
- Full stack coverage
- Enterprise pricing can be high for small teams
- Learning curve for advanced features
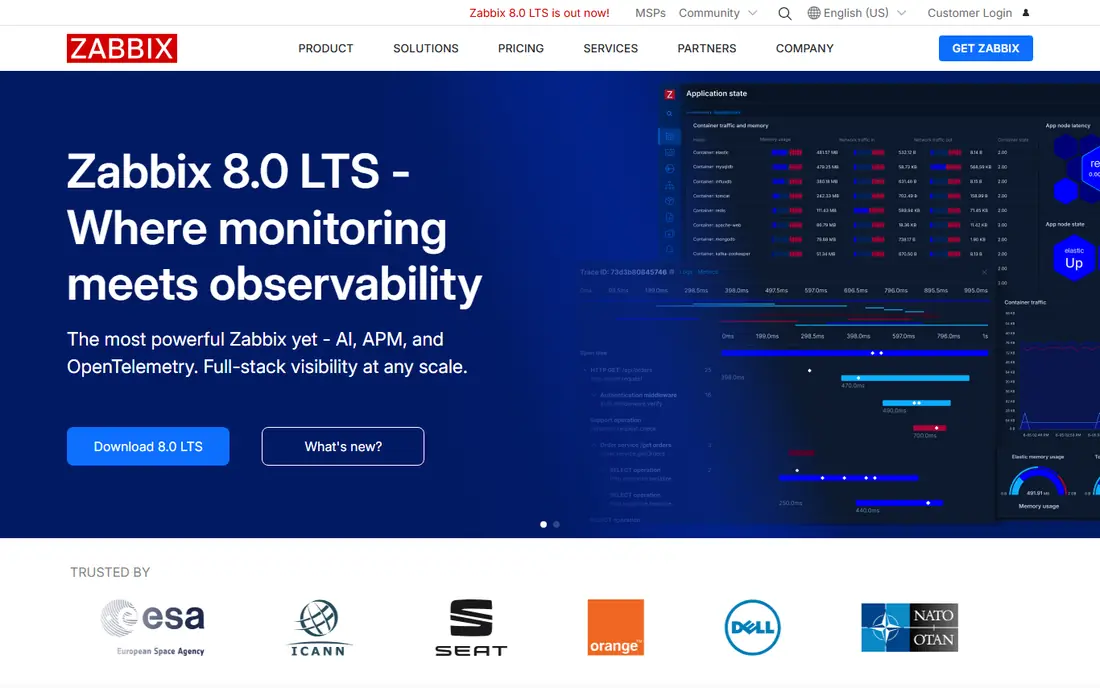
Zabbix is a self hosted monitoring platform with no licence fee for the core software. You define hosts, items, triggers and templates, and it collects metrics from servers, network devices, cloud services and applications. Teams with strong Linux and networking skills can shape it closely to their estate without per host licence costs.
That freedom comes with work. You host, update, back up and tune Zabbix yourself, and the interface takes longer to learn than a SaaS dashboard. Paid support is available from the vendor for teams that want help. For budget conscious teams with in house skills, Zabbix remains a solid, proven choice.
- Free open source core
- Very flexible templates and triggers
- Large community and long track record
- Setup and upkeep need skilled staff
- Interface feels dated next to SaaS tools
PRTG monitors networks, servers and devices through sensors, each one checking a single value such as CPU load, bandwidth or disk space. That model is easy to explain to a new admin, and the built in maps give a quick view of site health. Small and mid sized IT teams often get running fast.
Costs need attention. Every sensor counts, so a detailed estate can use more sensors than expected, and the core server requires Windows. PRTG also feels less cloud native than Datadog or Dynatrace. For teams focused on office networks, servers and switches, it is a practical and well supported option.
- Sensor model is easy to grasp
- Good network device coverage
- Maps and dashboards included
- Sensor based pricing can grow with device count
- Core server runs on Windows
OpManager from ManageEngine covers network devices, servers, virtual machines and bandwidth in one console, with alarms, maps and reports. It suits IT teams that need broad coverage without enterprise pricing, and it integrates with other ManageEngine tools for helpdesk and asset work.
The modular approach is both a strength and a weakness. You can add only what you need, but a full setup may involve several products and licences. The interface also packs a lot onto each screen, so new users need time to learn it. For budget conscious network teams, OpManager offers a lot of function for the price.
- Strong network and server monitoring at a lower entry point
- Modular add ons
- Good for Windows and Linux estates
- Interface can feel busy
- Advanced features spread across add on products
SolarWinds Observability brings network, infrastructure and application monitoring into a SaaS view, with self hosted SolarWinds Platform products available for teams that prefer that route. Organisations already using SolarWinds network tools can extend coverage without retraining the whole team.
Pricing is quote based, so you cannot compare a starting price from the website alone. Some buyers also weigh the widely reported SolarWinds supply chain incident when choosing a vendor, and should review current security documentation and attestations before committing. For existing SolarWinds estates, the continuity often outweighs those concerns.
- Familiar path for existing SolarWinds users
- Network, server and application views
- SaaS and self hosted options
- Quote based pricing makes comparison harder
- Past security history still concerns some buyers
New Relic is best known for application performance monitoring, but it also covers infrastructure, logs and browser performance. The free tier suits small applications and side projects, and the platform is easy to start with a single agent install. Developers tend to like its code level traces and error tracking.
It is weaker as a pure network monitor. If your main need is switches, routers and bandwidth, PRTG, OpManager or Zabbix fit better. For application led teams that need to find slow transactions and failing services quickly, New Relic is a strong, accessible choice, provided you watch data ingest and user counts.
- Generous free tier for small applications
- Strong application and infrastructure views
- Clear pricing tiers
- Costs rise with data ingest and full users
- Less network device depth than PRTG or OpManager
Grafana Cloud hosts Grafana dashboards plus metrics, logs and traces, so you can visualise data from Prometheus, cloud services and other sources in one place. Teams that already use Grafana or Prometheus get a familiar path to a managed service without hosting everything themselves.
Grafana Cloud is a platform to build on, not a turnkey monitor that discovers your whole estate on day one. You still need agents, exporters or integrations to feed it data, and usage based pricing needs monitoring. For teams that value dashboard freedom and open standards, it is a flexible and well liked option.
- Excellent dashboards and alerting
- Open source Grafana roots
- Works with Prometheus and many data sources
- Building a full monitoring stack takes assembly
- Hosted pricing depends on usage
Checkmk monitors servers, networks, cloud and applications, with automatic discovery that keeps host and service lists current as estates change. The open source Raw Edition suits skilled teams that want no licence cost, while paid editions add features, support and a more polished interface.
New users face a learning curve, and the sheer number of options can overwhelm a small team at first. Once set up, Checkmk scales well and its plugin ecosystem covers many devices and applications. It is a strong pick for teams that want open source flexibility with a supported upgrade path.
- Strong auto discovery and scalability
- Open source edition available
- Large plugin ecosystem
- Configuration can be complex for beginners
- Enterprise features are paid
How we picked these
We compared official pricing pages, feature documentation and public product descriptions for tools that cover infrastructure, network, cloud or application monitoring and are live in October 2026. We kept tools with a clear monitoring focus, a current product page, and a trial or free tier where available. Where pricing was quote based or varied by edition, we wrote See website rather than a guessed figure.
What to check before you buy
Start with a list of what you actually monitor: servers, network devices, cloud accounts, containers and key applications. Then check that each shortlisted tool covers those items natively, not only through a generic agent. Count hosts, devices and sensors, because per host and per sensor pricing gives very different totals.
Run a trial on a slice of your real estate, not a demo. Test alert noise during a normal week, dashboard load times, and how fast you can trace an incident from alert to cause. Check data retention, access controls and where data is hosted, especially for regulated work. Finally, confirm support hours and response times, since monitoring tools matter most during an outage.
Frequently asked questions
What are the top logicmonitor alternatives for small teams?
Zabbix, Checkmk and PRTG suit small teams that focus on infrastructure and networks, while Grafana Cloud and New Relic suit small application teams. Small teams should favour a free tier or trial and a pricing model that stays predictable as devices are added.
What are alternatives to logicmonitor for cloud monitoring?
Datadog, Dynatrace, New Relic and Grafana Cloud are the strongest cloud focused choices in this list. They connect to major cloud providers, cover containers and serverless workloads, and combine metrics with logs and traces for faster troubleshooting.
Is there a free alternative to LogicMonitor?
Yes. Zabbix is free as open source software, Checkmk has an open source edition, and Datadog, New Relic and Grafana Cloud offer free tiers. Free here means no licence fee or a limited free plan, not unlimited enterprise features, so check limits before you rely on it.
Which alternative is best for network monitoring?
PRTG, ManageEngine OpManager, Zabbix and Checkmk are the strongest network focused picks. They cover switches, routers, bandwidth and device health in depth. Datadog and Dynatrace cover networks too, but their main strength is cloud and application work.
How hard is it to migrate from LogicMonitor?
Migration effort depends on how many custom dashboards, alerts and integrations you have built. Most tools in this list support common agents and APIs, but dashboards and alert rules usually need rebuilding. Export your host list, alert rules and dashboard definitions first, then rebuild them in a trial before you switch over.
Sources
See where you really rank - block by block
ProMapRanker scans Google Maps across a grid of your service area. Simple monthly plans from $19, white-label on every plan.
Start freeKeep reading
 zscaler alternatives
Best Zscaler Alternatives in 2026
Looking for zscaler alternatives? We compare 9 SASE and zero trust platforms on architecture, data protection, pricing, and fit for your network and team.
Read → zapier alternatives free
Best Zapier Alternatives Free in 2026
Nine automation tools for zapier alternatives free in 2026, all with genuinely free tiers, plus free plan limits, starting prices and upgrade paths explained.
Read → which platform is best for online reputation
Which Platform Is Best for Online Reputation in 2026
Wondering which platform is best for online reputation? We compare 8 review, listing, and response tools for small and multi-location businesses and agencies.
Read →