 ProMapRanker
Best LGTM Stack Alternatives in 2026


All-in-one hosted observability · Pricing starts at: $15 per host per month
Key takeaways
- Datadog and New Relic offer the broadest hosted coverage, while SigNoz and VictoriaMetrics keep costs closer to data volume.
- OpenTelemetry support is now common, so check how easily you can move dashboards and alerts before you commit.
- Per-host pricing suits steady fleets, while per-gigabyte pricing suits teams with spiky log volume.
- Free tiers are useful for testing, but retention limits and seat costs matter more in production.
Quick comparison
| Pick | Great for | Pricing starts at | Free tier | |
|---|---|---|---|---|
| Datadog | All-in-one hosted observability | $15 per host per month | Yes | Visit |
 New Relic | Small teams with high data volume | Free | Yes | Visit |
 Dynatrace | Large, complex environments | See website | Free trial | Visit |
 Splunk Observability Cloud | Real-time analytics at enterprise scale | $15 per host per month | Free trial | Visit |
 Elastic Observability | Log-heavy teams with search needs | See website | Yes | Visit |
 SigNoz | Open source observability on a budget | $49 per month | Yes | Visit |
 Honeycomb | High-cardinality debugging | Free | Yes | Visit |
 Coralogix | Log-heavy teams that want archive control | See website | Yes | Visit |
 VictoriaMetrics | High-volume metrics storage | Free | Yes | Visit |
The best LGTM stack alternatives
The LGTM stack pairs logs, metrics and traces in an open source style workflow. These alternatives cover the same signals, with different trade-offs in hosting, pricing and depth. We compared official feature pages, pricing pages, app store listings where relevant, privacy policies and public reviews.
Datadog is the closest hosted answer when you want one vendor for infrastructure, application performance, logs and synthetics. Its dashboards make it easy to move from a slow request to the host, log lines and trace behind it. That breadth is also why many teams pick it first, even when the bill needs careful planning.
The catch is the meter. Infrastructure, APM and logs are priced on different units, so a growing fleet can surprise you. Set usage alerts and retention rules early, and test with the free tier for up to five hosts before you scale. If your team wants minimal setup and can fund the platform, Datadog is a strong default.
- Broad product coverage
- Strong correlation across metrics, traces and logs
- Many integrations
- Costs stack up across products
- Pricing model takes time to model
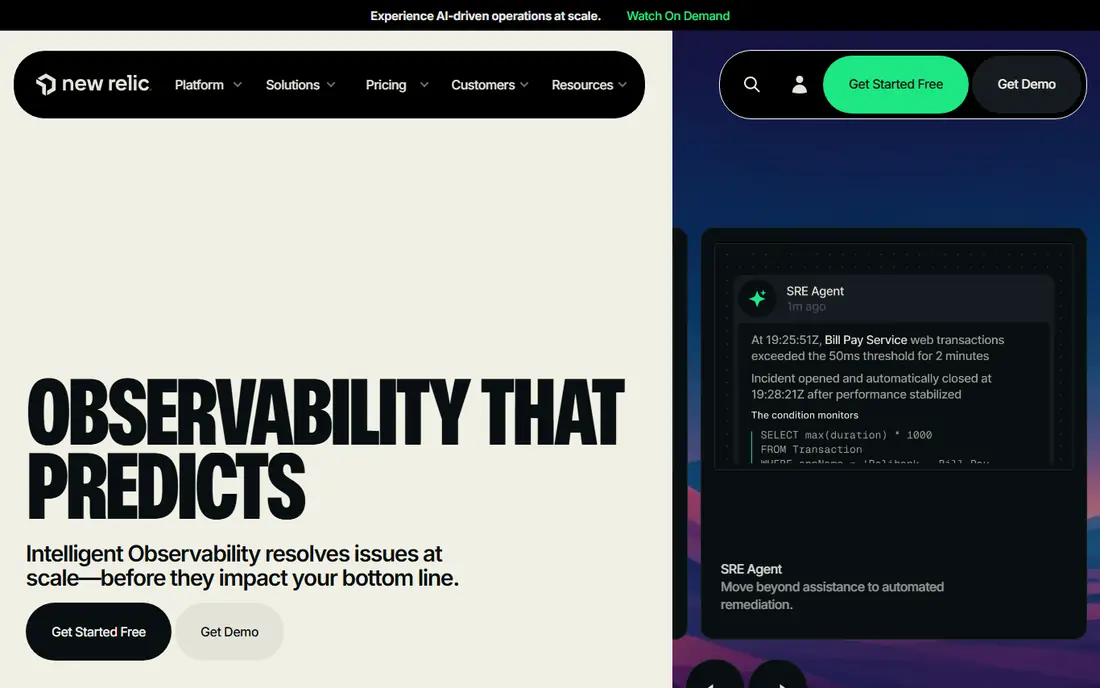
New Relic starts from a different angle, with a free tier that includes 100 GB of data ingest per month and one free full platform user. That makes it friendly for small teams that send a lot of telemetry but have few people who need full access. Basic users can view data without a paid seat, which helps wider teams stay informed.
Watch the seat plan as you grow. Standard pricing starts low for the first full platform user, then rises for additional users, and Pro seats cost far more. If most of your team only needs to view dashboards, New Relic can stay cheap. If many engineers need full access, compare the total seat cost before you choose.
- 100 GB of free data ingest per month
- Unlimited basic users
- Broad APM coverage
- Full platform seats get expensive on higher tiers
- Data overage adds up

Dynatrace suits organisations where the hard part is mapping a large, changing system, not just collecting data. Its agent and AI analysis work to connect services, hosts and cloud resources, then point to likely causes when something degrades. For teams with many services and strict governance needs, that automation saves real triage time.
Smaller teams may find the platform more than they need, and pricing requires a sales conversation for a firm total. Start with a trial on a bounded set of services, and check how its consumption model treats your host sizes. When scale and automatic mapping matter most, Dynatrace earns its place on the shortlist.
- Automatic dependency mapping
- Strong root-cause analysis
- Broad enterprise coverage
- Quote-based pricing can be opaque
- Setup can feel heavy for small teams
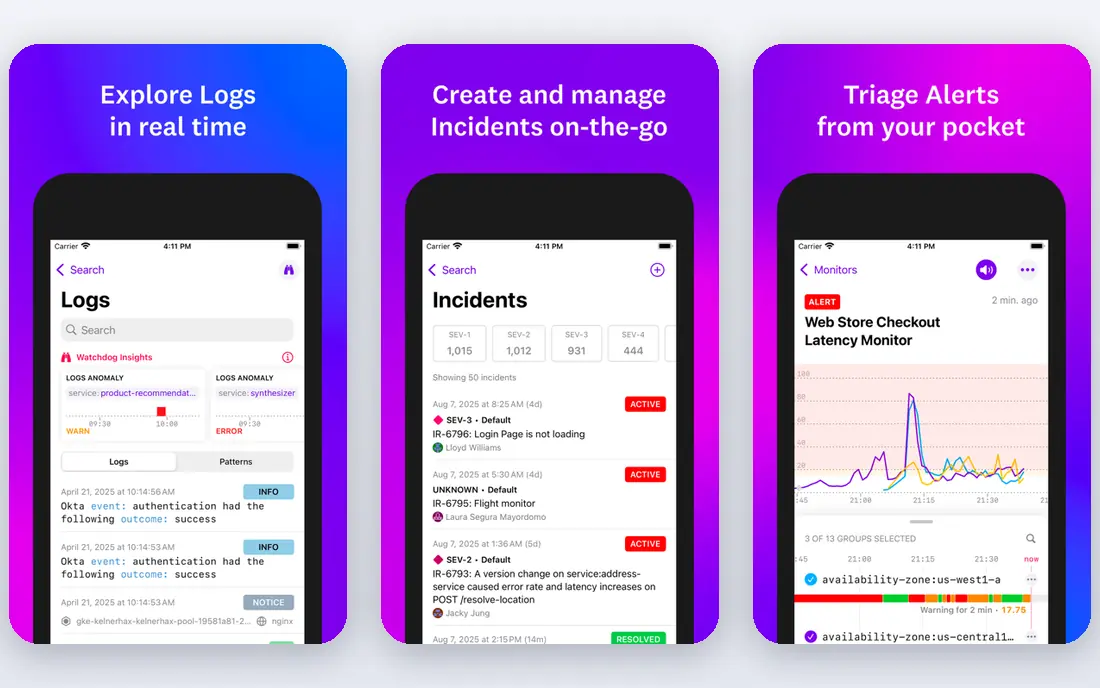
Splunk brings a long history in log analytics to observability, with streaming analysis that suits teams watching live systems. Infrastructure monitoring starts at the published per-host rate noted above, with broader observability bundles priced higher. Teams already using Splunk for security or logs often find the shared query skills and data model helpful.
The trade-off is complexity. Its query language is powerful, but new users need time to learn it, and the full platform can feel large for a small fleet. If your organisation already invests in Splunk, or you need real-time analysis at scale, this is a natural fit. Otherwise, trial it against a simpler hosted option.
- Streaming analytics
- Strong log search
- Deep enterprise and security integrations
- Learning curve for its query language
- Enterprise pricing rises with breadth
Elastic Observability builds on Elasticsearch, so teams that already search logs in Elastic will feel at home. It covers logs, metrics, traces and APM, and you can run it yourself, use a hosted service, or use a serverless option. That choice matters, because log-heavy workloads often care as much about retention and query speed as about collection.
Running your own cluster is the main risk. Scaling, upgrades and storage tuning become your job, and ingest plus retention choices drive the bill. If you have Elastic skills in house, the control is a plus. If not, start with the hosted option and test retention costs on real log volume.
- Strong search and log analytics
- Flexible deployment options
- Open source roots
- Self-managed clusters need operational care
- Costs vary with ingest and retention
SigNoz is the open source shaped option many teams reach for when they want a Datadog style product without per-host billing. It is built around OpenTelemetry, so instrumentation stays portable, and the cloud plan starts at the monthly figure above with usage included. Logs and traces are priced by volume, which is easier to forecast than a stack of product meters.
Self-hosting is free in software terms, but you take on ClickHouse operations, upgrades and on-call work. That suits engineering teams with platform capacity, and less so teams that want a fully managed service. For a low entry price and open standards, SigNoz is hard to beat in this list.
- OpenTelemetry native
- Single view for metrics, logs and traces
- No per-host fee on cloud
- Self-hosting means operating ClickHouse
- Some enterprise features are paid
Honeycomb takes a different path from most platforms here, focusing on wide events that let you ask detailed questions about production behaviour. Its free tier covers a large monthly event allowance, and paid plans are priced per million events. That model rewards teams that debug complex distributed systems by slicing data many ways, rather than watching a fixed set of dashboards.
It is not the best pick if you mainly need host monitoring, uptime checks and broad infrastructure alerts. Pair it with a metrics tool in that case, or choose a broader platform. For teams that live in traces and need to find why a small slice of requests behaves badly, Honeycomb is a specialist worth trying.
- Strong for exploring wide, detailed event data
- Fast querying for debugging
- Generous free tier
- Less of a general infrastructure monitor
- Event-based pricing needs care at scale
Coralogix prices by data type rather than by host or user, and it stores archive data in your own cloud storage. That design appeals to teams with high log volume who want to keep long-term data without paying a platform premium for cold storage. It also includes unlimited users, which removes seat planning from the cost question.
The pricing still needs a careful read, because logs, traces and metrics have different rates and tier choices affect search speed. Trial it with a representative log sample and check retention and archive query behaviour. If archive control and user count matter to you, Coralogix stands out from per-seat rivals.
- No per-user fees
- Archive stored in customer-owned storage
- Strong log and trace handling
- Pricing varies by data type and tier
- Query language takes learning
VictoriaMetrics focuses on metrics, and it does that job with storage efficiency that helps at high volume. It accepts Prometheus style data, so teams already using Prometheus can keep familiar queries while gaining a backend built for scale. The open source version is free to self-host, with a managed cloud option for teams that prefer not to run it.
Be clear about scope. VictoriaMetrics alone does not replace a full logs and traces stack, so you may pair it with a log tool and a tracing tool. That split suits platform teams that like best-of-breed parts. If you want one vendor for every signal, pick a broader platform from this list instead.
- Efficient metrics storage
- Open source core
- Prometheus compatible querying
- Not a full logs and traces platform on its own
- Setup needs engineering time
How we picked these
We compared official feature pages, pricing pages, app store listings where relevant, privacy policies and public reviews. We kept only tools that exist and work in October 2026 and that cover metrics, logs or traces in a way a team replacing an LGTM style stack would actually use. We left out tools that only cover one narrow signal, and we checked that each vendor homepage listed here belongs to the named product.
What to check before you switch
Start with your signals, not the vendor pitch. List which metrics, logs and traces you must keep, how long you must retain them, and who needs to query them during an incident. That list decides whether a broad platform, a specialist, or a mix of tools fits best.
Match pricing to your growth pattern
Per-host pricing is simple when host count is stable. Per-gigabyte and per-event pricing is simpler when data volume moves more than host count. Model both at twice your current size, and include retention, because a cheap ingest rate with short retention can force a costly upgrade later.
Keep instrumentation portable
OpenTelemetry support reduces switching cost, but dashboards, alerts and query languages still differ. Export a sample of dashboards and alerts before you sign, and test the trial with real production shaped data, not only demo data. A short trial with your own services tells you more than a long feature list.
Plan the migration in stages
Move one service or one signal first, run old and new tools side by side, and compare alert quality. Keep the old stack until the new alerts have caught a real incident. That staged move avoids a weekend cutover where a missing dashboard only shows up during an outage.
Frequently asked questions
What is the LGTM stack?
The LGTM name refers to a common open source observability combination covering logs, metrics, traces and visualisation. Teams use it to collect telemetry, query it, and build dashboards and alerts. The alternatives here cover the same signals as hosted platforms, open source tools, or a mix.
Which LGTM stack alternative is cheapest for a small team?
New Relic, Honeycomb and SigNoz offer the most useful free or low entry tiers for small teams, but the cheapest choice depends on your data volume and seat count. A team with few users and high data volume often does well on a per-gigabyte model. A team with many viewers often does better where users are free or cheap.
Can I self-host an alternative?
Yes. SigNoz, Elastic and VictoriaMetrics all offer self-hosted options, and that route removes per-host or per-user fees in software terms. You still pay for servers, storage and the engineering time to run upgrades, backups and on-call cover. Managed cloud versions trade that work for a monthly bill.
Do these tools support OpenTelemetry?
Most tools in this list accept OpenTelemetry data, and several are built around it. Check the vendor docs for your languages and frameworks before you commit, because support for traces, metrics and logs can differ by signal. Keeping OpenTelemetry instrumentation makes a future move easier.
Should I pick one platform or several specialists?
One platform is simpler to run and easier to correlate during incidents, while specialists can be stronger in one signal. Small teams usually benefit from one platform. Larger platform teams with clear ownership for metrics, logs and traces can get better value from a mix, as long as alert routing stays in one place.
How do I avoid a surprise observability bill?
Set ingest limits, retention policies and cardinality controls on day one, and turn on billing alerts. Review the top log sources and metric series each month, because a new service or a verbose log line is often the cause of a spike. A short monthly review costs far less than an unexpected invoice.
Sources
- https://www.datadoghq.com/pricing
- https://newrelic.com/pricing
- https://www.dynatrace.com/pricing
- https://www.splunk.com/en_us/products/observability-cloud.html
- https://www.elastic.co/pricing
- https://signoz.io/pricing
- https://www.honeycomb.io/pricing
- https://coralogix.com/pricing
- https://victoriametrics.com/pricing
See where you really rank - block by block
ProMapRanker scans Google Maps across a grid of your service area. Simple monthly plans from $19, white-label on every plan.
Start freeKeep reading
 zyte alternatives
Best Zyte Alternatives in 2026
These zyte alternatives cover managed scraping APIs, proxy networks and no code tools for lawful collection from your own or consented sources only in 2026.
Read → zerto alternatives
Best Zerto Alternatives in 2026
Compare the best zerto alternatives for disaster recovery and replication, with recovery targets, cloud options and honest trade-offs for teams in 2026.
Read → zerofox alternatives
Best ZeroFox Alternatives in 2026
We compared 9 zerofox alternatives for brand protection, phishing takedowns, dark web monitoring, and social impersonation, with clear coverage notes.
Read →