 ProMapRanker
Best Klipfolio Alternatives in 2026

Key takeaways
- Klipfolio suits teams that want formula-level control, but many teams prefer pre-built metrics and faster setup.
- Free tools cover Google data well, while paid tools add more connectors, alerts, and client sharing.
- Pricing units differ, so compare per user, per dashboard, and flat monthly plans side by side.
- A dashboard only helps if someone looks at it, so favour the tool your team will actually open.
Quick comparison
| Pick | Great for | Pricing starts at | Free tier | |
|---|---|---|---|---|
 Databox | Marketing KPI scorecards | Free | Yes | Visit |
 Geckoboard | Live TV dashboards | $79 per month | Free trial | Visit |
 Tableau | Deep visual analysis | $15 per user per month | Free trial | Visit |
 Microsoft Power BI | Microsoft 365 teams | $14 per user per month | Yes | Visit |
 Looker Studio | Free Google reporting | Free | Yes | Visit |
 Metabase | Database questions | $100 per month | Yes | Visit |
 Zoho Analytics | Budget business intelligence | $24 per month | Yes | Visit |
 AgencyAnalytics | Agency client reporting | $20 per client per month | Free trial | Visit |
 DashThis | Fast marketing reports | See website | Free trial | Visit |
The best Klipfolio alternatives
Klipfolio is known for custom dashboards built from formulas and individual widgets. These alternatives trade some of that control for speed, simpler pricing, or deeper analysis, and we compared them on connectors, sharing, and cost.
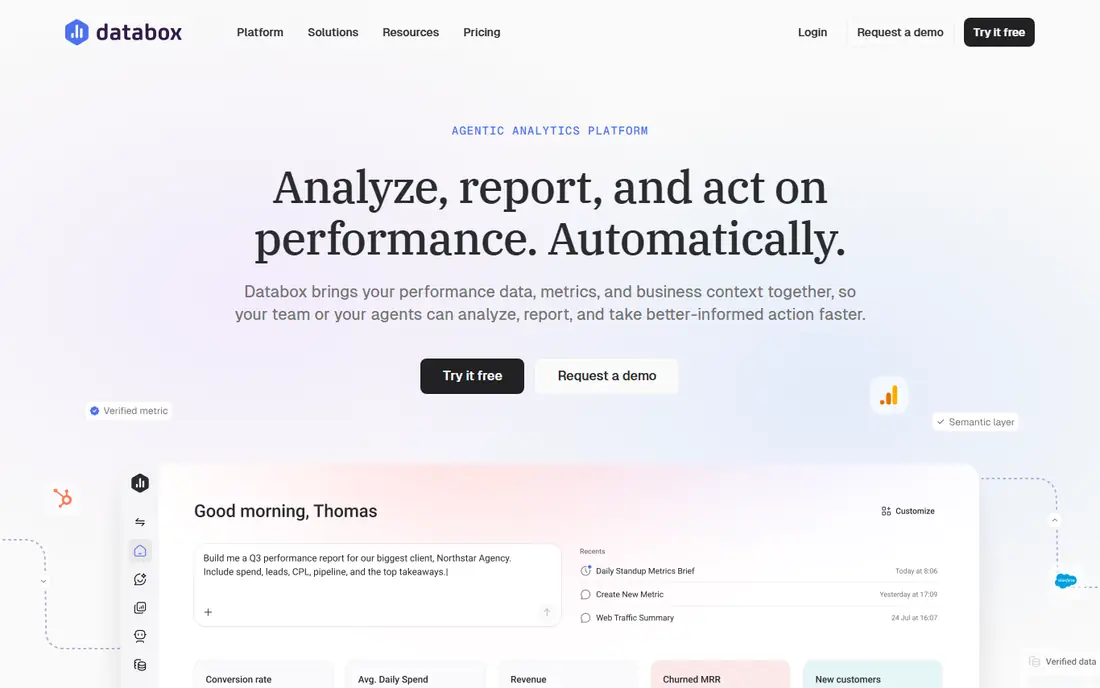
Databox is the easiest move if you want dashboards without building every metric by hand. Its library of pre-built metrics covers common marketing, sales, and finance tools, and its scorecards make a weekly number easy to read at a glance. The free plan is enough to test the idea with one dashboard.
The limit appears when you want unusual calculations or deep data modelling. Databox is built for clarity, not for analyst-level formulas. If your team just needs to see KPIs and trends, that clarity is a strength. If you live in formulas, you may miss Klipfolio.
- Many pre-built metrics and integrations
- Clear scorecards and goals
- Free plan for a first dashboard
- Custom calculations are less flexible than Klipfolio
- Higher plans rise quickly with sources and users
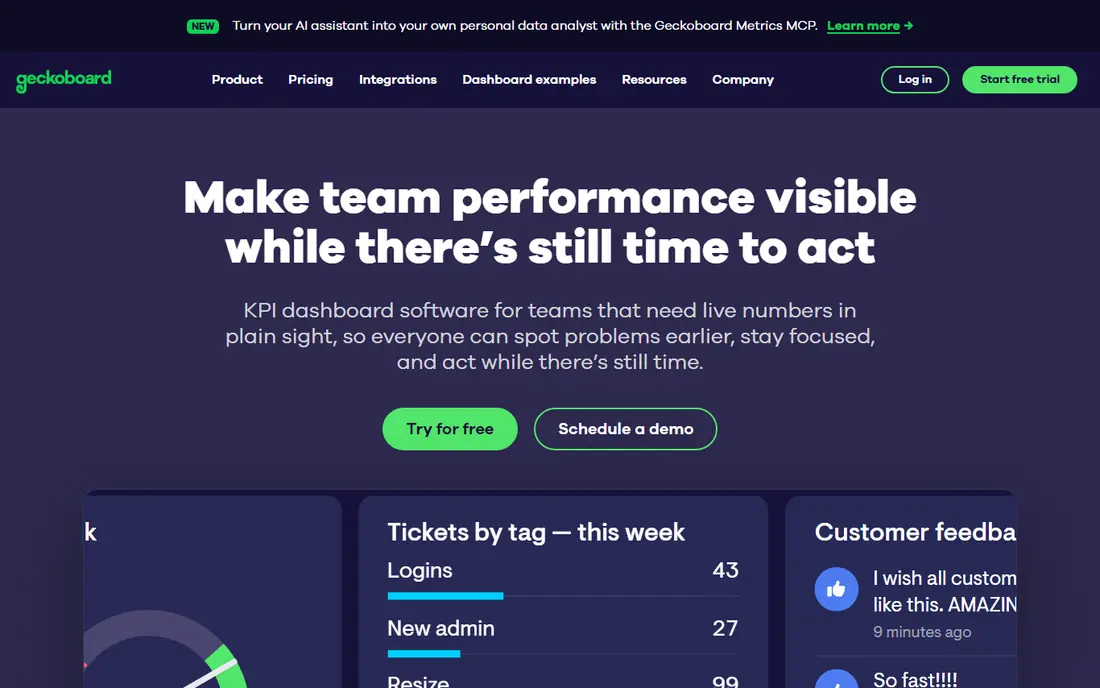
Geckoboard answers a different question from most BI tools: what should the whole room see right now? Its dashboards are built for TVs and shared screens, with large numbers, status colours, and live updates. Sales and support teams often use it to keep targets visible without opening a report.
That focus means it is not an analysis tool. You will not dig into a dataset or build complex models here. Buy Geckoboard when visibility is the goal, and pair it with a deeper tool if you also need investigation.
- Designed for office screens and live KPIs
- Simple setup
- Clear, readable displays for shared spaces
- Less suited to deep exploration or ad-hoc analysis
- No free plan, only a trial
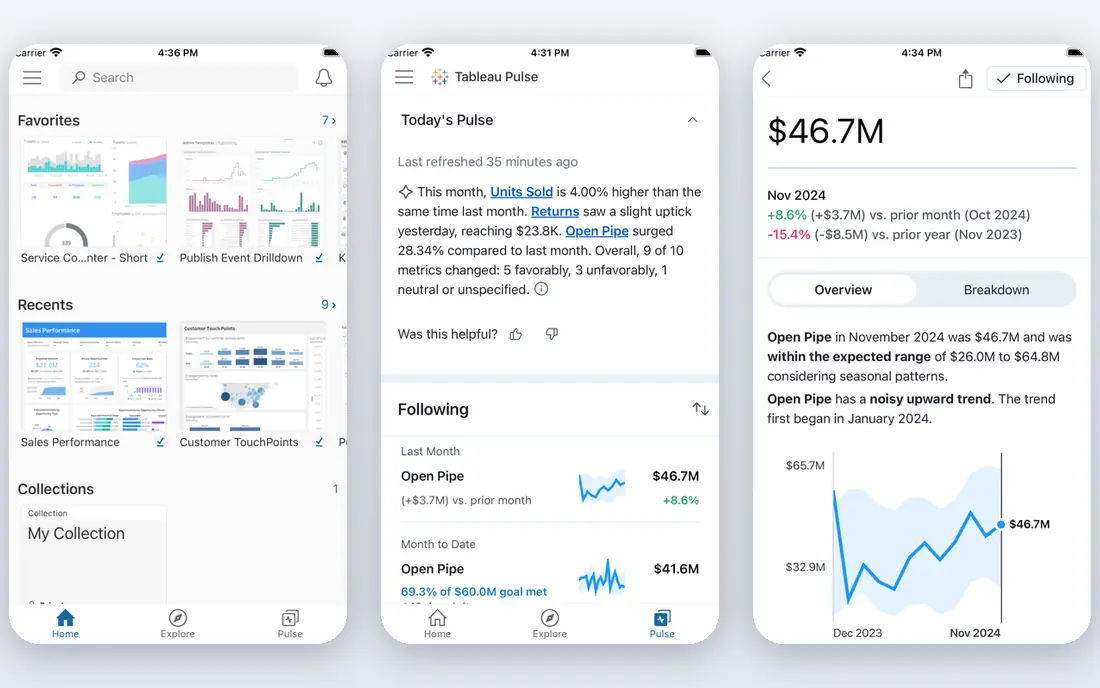
Tableau is the analyst pick on this list. It lets you drag, filter, and explore data in ways a simple KPI tool cannot match, and it handles large, messy datasets well. For a team with real analysis work, that depth is worth the price and the learning time.
For a small business that only wants a weekly scorecard, Tableau is too much. The entry plan is affordable, but the full value needs time, training, and data preparation. Choose it when exploration matters, not just display.
- Strong visual exploration and filtering
- Large connector range
- Well suited to analysts
- Cost and learning curve rise with use
- Overkill for a simple KPI board
Power BI is the natural choice if your team already lives in Microsoft 365. It connects well to Excel, SharePoint, and other Microsoft tools, and its modelling features go far beyond a simple dashboard. The free desktop app also lets an analyst build reports before paying for sharing.
The pricing catch is sharing. In many setups, both creators and viewers need a paid licence, which changes the total cost for a large team. Check who needs to view, not just who builds, before you compare it with a flat monthly tool.
- Strong Excel and Microsoft 365 integration
- Powerful modelling with DAX
- Free desktop tool for building reports
- Sharing needs paid licences for viewers in many cases
- Best value only inside a Microsoft setup
Looker Studio is hard to beat on price, because the core product is free. If your data lives in Google Analytics, Google Ads, and Sheets, you can build and share useful reports in an afternoon. It is a strong pick for small teams, freelancers, and agencies with Google-centred clients.
The limit is connectors. For Salesforce, HubSpot, or other non-Google sources, you may need a paid connector, which adds cost and complexity. Still, as a free starting point, Looker Studio is the tool we would try first.
- Free for most reporting
- Strong Google Analytics, Ads, and Sheets connectors
- Easy sharing by link
- Non-Google connectors often need paid third-party tools
- Less governance than enterprise BI
Metabase suits teams whose truth lives in a database, not in a dozen SaaS apps. Non-technical users can ask questions with a visual builder, while analysts can write SQL when they need precision. The open source version also gives a free self-hosted route for teams with technical help.
It is less polished for marketing dashboards than Databox or DashThis, and its cloud plans start at a higher price. Choose Metabase when your own database is the main source, and you want the team to ask questions without waiting for an analyst.
- Open source self-hosted option
- Question builder for non-SQL users plus SQL for analysts
- Good for internal data
- Cloud pricing starts higher than simple KPI tools
- Marketing connectors are thinner than Databox
Zoho Analytics gives a lot of BI for a modest price. It covers dashboards, reports, and data blending, and it fits naturally if you already use Zoho CRM, Books, or other Zoho apps. The free plan, with limits on users and rows, is enough to test it properly.
The trade-off is polish. It can feel busier than Databox or Geckoboard, and some advanced features need a higher plan. For a budget-conscious team that wants real BI rather than just scorecards, it is strong value.
- Low entry price with a free plan
- Wide connector range including Zoho apps
- AI assistant on higher plans
- Interface feels busier than simpler KPI tools
- Advanced features sit on higher tiers
AgencyAnalytics is built for the agency version of the Klipfolio job: one dashboard per client, with your branding, sent on a schedule. It combines marketing data with SEO rank tracking, which Klipfolio users often add separately. Per-client pricing also makes it easy to pass costs through or bundle them into retainers.
It is not an internal BI tool for a single company. If you only need dashboards for your own team, a flat monthly tool will be cheaper. For agencies, though, the client workflow is the reason to choose it.
- Built for agencies with client dashboards and white labelling
- Includes SEO rank tracking
- Simple per-client pricing
- Priced per client, so costs grow with your roster
- Less suited to internal-only BI
DashThis focuses on speed. Pick a template, connect your marketing sources, and you have a client report in minutes rather than hours. That suits freelancers and small agencies that send the same style of report each month and do not want to build every widget by hand.
The limit is depth. You will not get Klipfolio-level formulas or deep database work here. If your reports are mostly marketing KPIs, DashThis saves time. If you need custom calculations, look at Metabase or Power BI instead.
- Quick setup with marketing templates
- Scheduled client reports
- Simple sharing by link or PDF
- Less custom modelling than Klipfolio
- Pricing varies by dashboard count
How we picked these
We compared official pricing pages, connector lists, and product documentation for dashboard tools that are live today. We kept tools that cover Klipfolio's core job: turning data from several sources into a readable, shareable dashboard. Where pricing varies by billing period or dashboard count, we used the vendor's published entry figure or wrote See website.
What to check before you switch
List your sources first, then check each tool's connector for them. A tool that looks cheap can become costly if you need a paid connector for every source. Next, check who builds, who views, and how many dashboards you need, because those three factors drive the real price.
Also test refresh speed and mobile viewing. A dashboard that updates once a day may be fine for a monthly report, but not for a live sales board. Finally, rebuild one real dashboard in your top two choices. That test shows setup time, formula limits, and sharing friction better than any feature list.
Frequently asked questions
Is Looker Studio really free?
Yes, the core product is free, including sharing. Paid costs can appear if you need third-party connectors for non-Google sources, or if you move to Looker Studio Pro for team features.
Which Klipfolio alternative is best for agencies?
AgencyAnalytics and DashThis are built for client reporting, with white labelling and scheduled reports. Databox also works for agencies, but its pricing rises with sources and users.
Do I need Power BI or Tableau for simple KPIs?
No. For simple KPIs, Databox, Geckoboard, or Looker Studio will be faster and cheaper. Power BI and Tableau earn their cost when you need modelling, exploration, or large datasets.
How do I compare per-user and flat pricing?
Work out the total for your team size and dashboard count over a year. A flat $79 plan can beat a $14 per-user plan once you have more than six viewers, and the reverse is true for a tiny team.
Can I self-host a dashboard tool?
Yes. Metabase offers an open source self-hosted version, which suits teams with technical support. Cloud plans are simpler if you do not want to maintain servers.
Sources
See where you really rank - block by block
ProMapRanker scans Google Maps across a grid of your service area. Simple monthly plans from $19, white-label on every plan.
Start freeKeep reading
 zyte alternatives
Best Zyte Alternatives in 2026
These zyte alternatives cover managed scraping APIs, proxy networks and no code tools for lawful collection from your own or consented sources only in 2026.
Read → zerto alternatives
Best Zerto Alternatives in 2026
Compare the best zerto alternatives for disaster recovery and replication, with recovery targets, cloud options and honest trade-offs for teams in 2026.
Read → zerofox alternatives
Best ZeroFox Alternatives in 2026
We compared 9 zerofox alternatives for brand protection, phishing takedowns, dark web monitoring, and social impersonation, with clear coverage notes.
Read →