 ProMapRanker
Jaeger Alternatives in 2026: 9 Tools Compared

Key takeaways
- Grafana Tempo, Zipkin, and OpenObserve suit teams that want self-hosted tracing without a large cloud bill.
- SigNoz suits teams that want an open source, Datadog-shaped product with traces, logs, and metrics in one place.
- Datadog, New Relic, Honeycomb, Dynatrace, and Splunk suit teams that want managed APM with alerting and analysis.
- Jaeger itself is open source and CNCF-hosted, so the closest replacements are other tracing backends, not generic log tools.
- Cost depends on data volume and retention, so compare per-gigabyte and per-host pricing at your real traffic level.
Quick comparison
| Pick | Great for | Pricing starts at | Free tier | |
|---|---|---|---|---|
 Grafana Tempo | Grafana-stack tracing backend | Free | Yes | Visit |
 Zipkin | Simple lightweight tracing | Free | Yes | Visit |
 SigNoz | Open source full observability | $49 per month | Free trial | Visit |
 OpenObserve | Low-cost unified observability | Free | Yes | Visit |
 Datadog APM | Enterprise managed APM | See website | Free trial | Visit |
 New Relic | Full-stack APM with free tier | Free | Yes | Visit |
 Honeycomb | High-cardinality event analysis | $130 per month | Yes | Visit |
 Dynatrace | Enterprise APM with automation | See website | Free trial | Visit |
 Splunk APM | Enterprise tracing and logs | See website | Free trial | Visit |
The best jaeger alternatives
Jaeger is an open source, CNCF distributed tracing tool for following requests across microservices. The tools below offer comparable tracing, from lightweight open source backends to full managed APM platforms. Teams should decide first whether they want to self-host a tracing backend or pay for a managed platform with alerting and analysis.
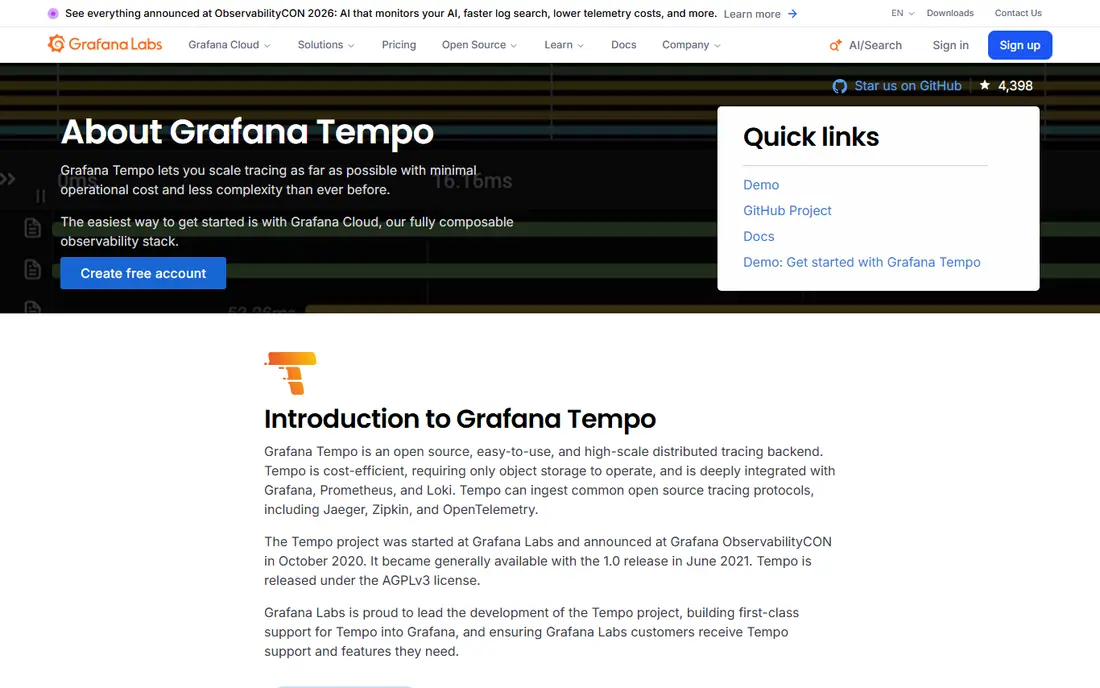
Grafana Tempo is a popular Jaeger replacement for teams already using Grafana. It stores traces in object storage such as S3 or GCS, without a separate index database, which can lower storage cost and operational work. Trace ID lookup is fast, and correlation with logs and metrics in Grafana helps teams follow a request across signals.
The trade-off is search style. Tempo is not a full indexed search engine, so finding traces by broad attributes works best with metrics and logs alongside it. It fits Grafana teams that want a low-cost backend, and it is less ideal for teams that need deep indexed trace search on its own.
- Stores traces in object storage with no index database
- Integrates with Grafana, Loki, and Prometheus
- Open source
- Trace search is ID-led, so broad queries need metrics or logs correlation
- Operating object storage still needs care
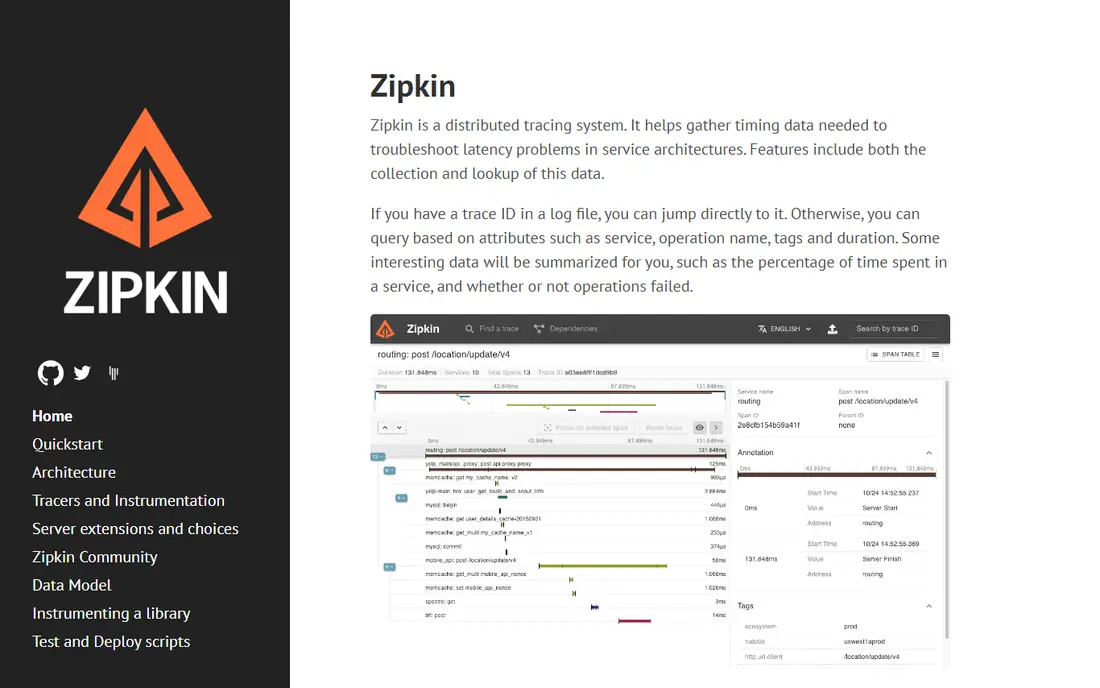
Zipkin is a lightweight, open source distributed tracing system with a simple UI for viewing traces and service dependencies. It accepts Zipkin and OpenTelemetry data through collectors, and stores traces in common backends. Teams with an existing Zipkin setup, or with a simple microservice estate, find it easy to run.
For new setups, Jaeger generally offers better OpenTelemetry support and a more active community. Zipkin is best when simplicity matters more than advanced analysis, or when a team already runs Zipkin and wants to keep its current workflow.
- Simple setup and UI
- Long track record
- Stores traces in Elasticsearch, Cassandra, or MySQL
- Smaller feature set than Jaeger for new setups
- Less active development for advanced APM features
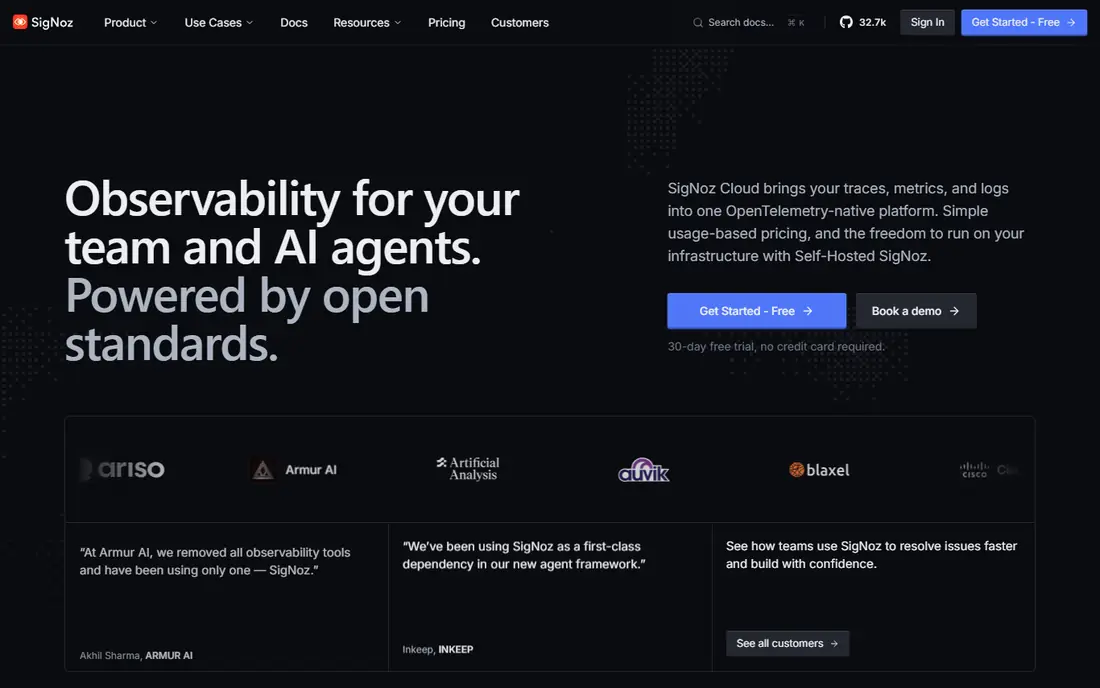
SigNoz is an OpenTelemetry-native observability platform that covers APM, logs, metrics, exceptions, and dashboards in one product. Self-hosting is free apart from infrastructure, while SigNoz Cloud starts with a $49 monthly plan that includes $49 of usage, then charges $0.30 per gigabyte for logs and traces. That per-gigabyte model is easy to compare with other cloud tools.
The catch is operations. Self-hosted SigNoz runs on ClickHouse, so teams must operate that database well. Some enterprise features, such as full RBAC and audit logs, have been cloud-only or in beta. SigNoz fits teams that want a Datadog-shaped product without vendor lock-in.
- Traces, logs, metrics, and alerts in one UI
- OpenTelemetry-native
- Self-hosted option with ClickHouse underneath
- Self-hosting inherits ClickHouse operations
- Some enterprise features are cloud-only or in beta
OpenObserve unifies logs, metrics, and distributed traces in one open source system, with a focus on low storage cost. Teams that want one UI for all three signals, without assembling separate tools, find it appealing. The cloud option suits teams that do not want to run storage infrastructure themselves.
As a newer platform, OpenObserve has a smaller integration ecosystem than Grafana or Datadog. Teams with unusual data sources should check connectors before migrating. It is strongest for cost-sensitive teams that want unified observability and can accept a newer product.
- Logs, metrics, and traces in one system
- Low-cost storage model
- Self-hosted and cloud options
- Smaller ecosystem than Datadog or Grafana
- Newer product with faster release change
Datadog APM gives teams distributed tracing plus profiling, service maps, logs, metrics, and synthetics in one managed platform. Auto-instrumentation and deep integrations help large teams onboard many services quickly. Alerting, dashboards, and anomaly detection turn traces into operational action, not just debugging views.
Cost is the main caution. Datadog charges by host and data volume, so a busy microservice estate can produce a large bill. Teams should model hosts, ingested data, and retention before committing, and use sampling to control trace volume.
- Deep APM, profiling, and service maps
- Huge integration catalog
- Strong alerting and dashboards
- Usage-based pricing can grow quickly
- Host and data costs need careful modeling
New Relic offers full-stack observability with APM, infrastructure monitoring, logs, and browser and mobile data. The free tier includes 100 GB of data, which helps small teams and prototypes start without a bill. OpenTelemetry support makes it easier to send traces from modern services without proprietary agents alone.
After the free tier, usage pricing at $0.30 per gigabyte for extra data needs the same careful modeling as Datadog. New Relic fits teams that want a managed platform with a genuine free start, and that can control data volume with sampling and retention settings.
- Free tier with 100 GB of data
- Full-stack APM, logs, and infrastructure in one platform
- OpenTelemetry support
- Costs rise after the free tier at $0.30 per gigabyte
- Feature depth varies by plan
Honeycomb treats observability as event analysis, letting teams query traces by many attributes, such as user, build, or feature flag. That high-cardinality approach helps debug complex production issues that a simple trace list cannot explain. BubbleUp highlights which attributes differ between slow and normal requests, which speeds root-cause work.
Honeycomb is less of a general infrastructure monitor than Datadog or New Relic, so teams may pair it with another tool for host metrics. It fits engineering teams that debug distributed systems daily and want deep event analysis over broad monitoring coverage.
- High-cardinality event queries
- BubbleUp and analysis tools for debugging
- OpenTelemetry-native
- Pro pricing starts at $130 per month
- Less of a general infrastructure monitor than Datadog
Dynatrace provides enterprise APM with automatic service discovery, distributed tracing, and AI-assisted root-cause analysis. It maps dependencies across cloud, containers, and on-premises systems, then links performance problems to likely causes. Automation features help large teams manage many services without manual instrumentation for every app.
Enterprise pricing and setup reflect that scale. Dynatrace uses pay-as-you-go rates, starting around $0.08 per hour in some listings, so large estates need careful modeling. It fits large companies that want automation and deep enterprise support, not small teams that need a simple tracing backend.
- Automatic discovery and AI-assisted root cause
- Broad enterprise integrations
- Strong automation features
- Enterprise pricing and setup
- Pay-as-you-go rates need modeling for large estates
Splunk APM, part of the wider Splunk observability and security platform, offers distributed tracing with service maps, anomaly detection, and log correlation. Teams already using Splunk for logs or security gain from one data platform and shared search skills. Enterprise scale and compliance features suit regulated industries.
The platform is enterprise-grade in price and complexity. Onboarding data, tuning retention, and training teams take time, and small teams will find it heavy. Splunk APM fits companies that already invest in Splunk, or that need tracing, logs, and security analysis in one enterprise system.
- Tracing plus strong log and security ecosystem
- Service maps and anomaly detection
- Enterprise scale
- Enterprise pricing and complexity
- Setup and data onboarding take time
How we picked these
We compared official feature pages, pricing pages, public documentation, and public reviews for distributed tracing and observability tools. We kept only tools that operate in October 2026 and that offer real tracing, whether as a backend or as part of an APM platform. We excluded the named product itself and generic log-only tools with no trace support.
What to check before you choose
First, decide between self-hosting and managed APM. Self-hosted backends such as Tempo, Zipkin, SigNoz, and OpenObserve cost less in software fees but need operational time. Managed platforms cost more but add alerting, analysis, and support that small teams may lack.
Second, test with real trace volume and sampling. A backend that handles a test app well can struggle with high-cardinality data or long retention. Send production-like traffic, set sampling rules, and check query speed before migrating a full estate.
Finally, model cost at your retention target. Per-gigabyte, per-host, and per-hour pricing all behave differently as traffic grows. Compare the same retention period, the same sampling rate, and the same data volume across vendors, or the price comparison will mislead.
Frequently asked questions
What is the closest open source alternative to Jaeger?
Grafana Tempo is the closest for many teams, especially those already using Grafana. Zipkin is the simplest open source option, while SigNoz and OpenObserve add logs and metrics alongside traces.
Can I self-host a Jaeger alternative for free?
Yes. Tempo, Zipkin, SigNoz, and OpenObserve all offer free self-hosted options, with infrastructure costs only. Managed cloud versions charge for usage, storage, or seats, so check the vendor pricing page for current rates.
Which tool is best for a large enterprise?
Datadog, Dynatrace, New Relic, and Splunk are the enterprise picks here, with managed APM, alerting, and support. The right one depends on existing tools, data volume, and whether logs and security must share the same platform.
How does Honeycomb differ from Datadog?
Honeycomb focuses on high-cardinality event analysis for debugging distributed systems. Datadog covers a wider range, including infrastructure, logs, synthetics, and security, with tracing as one part of a larger platform.
Do I need OpenTelemetry to use these tools?
No, but it helps. Most tools here accept OpenTelemetry data, and using it makes switching backends easier. Proprietary agents still work for some platforms, but OpenTelemetry reduces lock-in and keeps instrumentation portable.
Sources
See where you really rank - block by block
ProMapRanker scans Google Maps across a grid of your service area. Simple monthly plans from $19, white-label on every plan.
Start freeKeep reading
 zyte alternatives
Best Zyte Alternatives in 2026
These zyte alternatives cover managed scraping APIs, proxy networks and no code tools for lawful collection from your own or consented sources only in 2026.
Read → zerto alternatives
Best Zerto Alternatives in 2026
Compare the best zerto alternatives for disaster recovery and replication, with recovery targets, cloud options and honest trade-offs for teams in 2026.
Read → zerofox alternatives
Best ZeroFox Alternatives in 2026
We compared 9 zerofox alternatives for brand protection, phishing takedowns, dark web monitoring, and social impersonation, with clear coverage notes.
Read →