 ProMapRanker
Best Google Data Studio Alternatives in 2026


Microsoft 365 teams · Pricing starts at: See website
Key takeaways
- Google Data Studio is now Looker Studio, so searches for the old name point to the same Google product.
- Power BI is our top pick for teams already on Microsoft 365, thanks to Excel and Teams integration.
- Tableau suits analysts who want deep visual exploration and can justify the higher price.
- Metabase offers the best free start for teams with their own database and some SQL skills.
- Databox, AgencyAnalytics, Klipfolio and Whatagraph suit agencies and marketing teams that report to clients.
Quick comparison
| Pick | Great for | Pricing starts at | Free tier | |
|---|---|---|---|---|
| Microsoft Power BI | Microsoft 365 teams | See website | Yes | Visit |
 Tableau | Deep visual analysis | See website | Free trial | Visit |
 Metabase | Free open source dashboards | Free | Yes | Visit |
 Databox | KPI tracking for small teams | Free | Yes | Visit |
 Zoho Analytics | Small businesses on Zoho apps | See website | Free trial | Visit |
 AgencyAnalytics | Agency client reporting | See website | Free trial | Visit |
 Klipfolio | Flexible KPI dashboards | See website | Free trial | Visit |
 Whatagraph | High volume agency reporting | See website | Free trial | Visit |
The best google data studio alternatives
Google Data Studio is now Looker Studio, Google's free dashboard tool for Google sources such as Analytics, Sheets and BigQuery. People look for an alternative when they need better data preparation, more connectors, client reporting, or analysis beyond Google sources. The eight tools below cover those gaps in different ways.
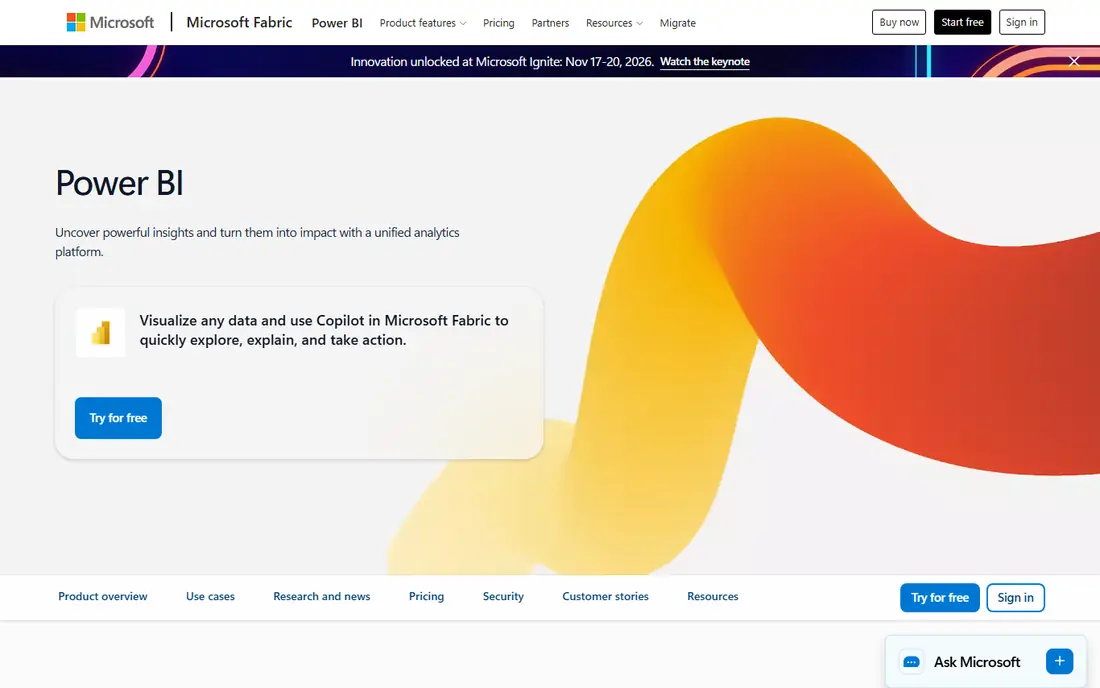
Power BI is the natural alternative for teams that live in Microsoft 365. Reports built in the free desktop app can draw on Excel, SharePoint, Teams data and Azure sources, with a modelling layer that goes well beyond simple charting. For companies already paying for Microsoft licences, the extra cost is often lower than it first appears.
The catch is sharing. Publishing and sharing reports broadly inside and outside an organisation generally requires a paid licence per user, so viewer costs add up. For Microsoft centred teams that need serious analysis, Power BI is still the strongest all round pick on this list.
- Strong Excel, Teams and Azure integration
- Powerful data modelling
- Free desktop app for building reports
- Sharing outside an organisation generally needs a paid licence
- Learning curve for advanced modelling
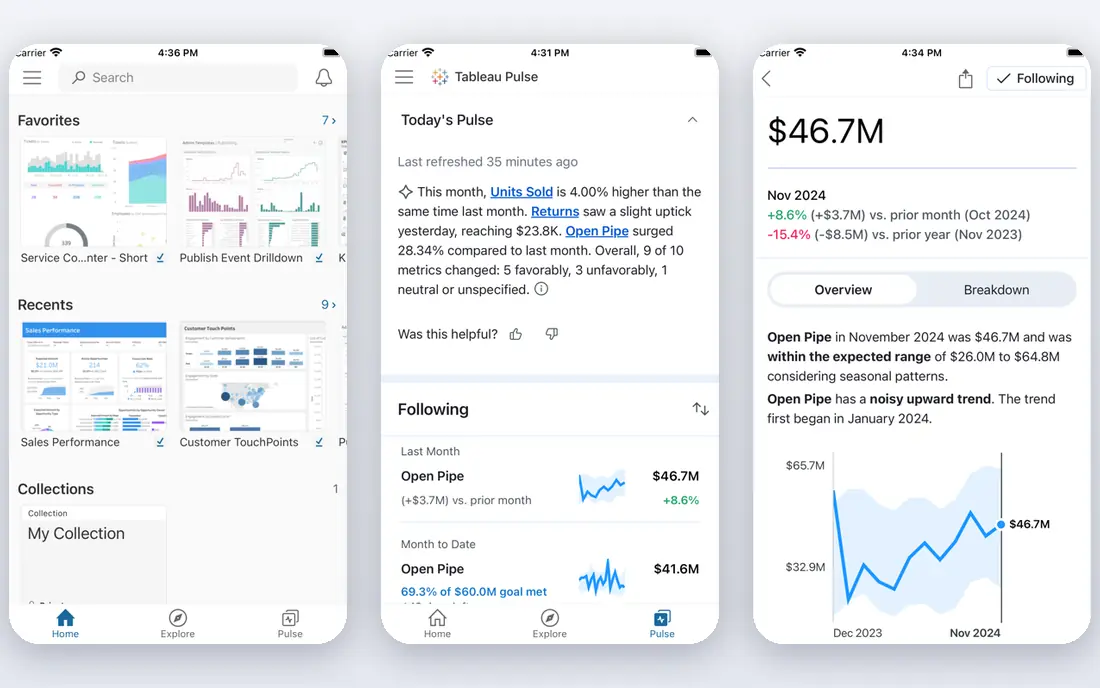
Tableau, from Salesforce, is built for analysts who want to explore data visually rather than just report fixed numbers. Drag and drop analysis, calculations and story dashboards let a team ask follow up questions without rebuilding a report each time. It handles large datasets well and connects to many databases and cloud sources.
The trade-off is cost and complexity. Tableau licences are priced per user by role, and a full deployment needs governance and training. Small teams that only need simple marketing dashboards will find it more than they need. Analyst led teams that live in data will get the value back.
- Excellent visual exploration and large data handling
- Wide connector range
- Strong community and learning resources
- Higher total cost than free tools
- Setup and governance take real effort
Metabase is the best free start for teams with their own database. The open source version can be self hosted at no licence cost, and the question builder lets non technical users create charts without writing SQL. Paid cloud plans add hosting, support and extra features.
Self hosting is the honest catch: someone on the team needs to install, update and back up the system. For startups and internal teams with a database and a technical member, Metabase delivers real dashboards for very little money. For marketing teams with no database, a connector based tool below will fit better.
- Free self hosted option
- Simple question builder for non technical users
- Connects to many databases
- Advanced analysis is more limited than Power BI or Tableau
- Self hosting needs technical upkeep
Databox is built for KPI tracking: connect marketing, sales and product tools, pick metrics, and show them on dashboards, TV screens and mobile scorecards. The free plan covers a small number of data sources, and paid plans add more sources, users and history. Agencies and small businesses use it to keep key numbers visible every day.
The limit is analysis depth. Databox reports what happened clearly, but it is not a full business intelligence platform for modelling and exploration. For teams that want a visible, always on KPI wall without building reports from scratch, it is a fast and friendly choice.
- Free plan available
- Many marketing and sales connectors
- Mobile dashboards and scorecards
- Deeper analysis needs higher plans
- Dashboard customisation is lighter than Tableau
Zoho Analytics is a business intelligence tool aimed at small and mid size businesses, especially those already using Zoho CRM, Books or other Zoho apps. Dashboards, reports and AI assisted insights are included, with a wide range of chart types and scheduled email reports. Pricing is lower than enterprise BI tools, with a free trial available.
The catch is ecosystem fit. Teams outside the Zoho world can still connect many sources, but the smoothest experience comes with Zoho apps. For a small business that wants capable reporting without an enterprise budget, Zoho Analytics is a strong value pick.
- Strong value for small businesses
- Good Zoho app integration
- AI assisted insights and dashboards
- Connector range is narrower than Power BI
- Advanced enterprise features are lighter
AgencyAnalytics is built for one job: reporting to clients. Agencies can create a dashboard per client, pull in SEO rankings, ads, social and analytics data, and share white label reports or client logins. That workflow saves hours compared with building a Looker Studio report per client by hand.
Pricing is per client, so an agency with many small clients should model the total before switching. Internal teams that do not report to clients will find tools like Databox or Metabase a better fit. For agencies, the client workflow alone often justifies the cost.
- Built for agency client dashboards
- SEO, ads and social connectors
- White label reports and client logins
- Priced per client, so costs grow with the client list
- Less suited to internal analysis teams
Klipfolio, now known as Klips, is a dashboard platform for operations and KPI reporting. Teams can combine data from many sources into custom dashboards, with formulas for calculated metrics and TV display options for offices. Some plans allow unlimited viewers, which helps when many staff need to see numbers but few need to build reports.
The learning curve is real for custom formulas and data modelling, and pricing has changed over the years, so teams should check the current pricing page rather than older reviews. For operations teams that want flexible, visible dashboards, Klipfolio remains a capable choice.
- Flexible dashboard builder
- Many connectors
- Unlimited viewer users on some plans
- Learning curve for custom data formulas
- Pricing has changed over time, so check the current page
Whatagraph is an agency reporting platform for marketing teams that manage many clients and campaigns. Templates for paid media, social and analytics reporting speed up setup, and automated delivery sends reports to clients on schedule. The platform is built to handle high volumes of sources and reports.
The drawback is price and focus. Entry pricing is higher than Databox or AgencyAnalytics starter plans, and small internal teams will not need the agency workflow. For a growing agency drowning in monthly client reports, Whatagraph can pay for itself in saved hours.
- Strong agency reporting templates
- Many marketing connectors
- Automated report delivery to clients
- Higher entry price than Databox
- Aimed at agencies, not small internal teams
How we picked these
We compared official feature pages, pricing pages and vendor documentation, plus public reviews from marketing, agency and analyst teams. We kept only tools that are live in October 2026 and that offer dashboarding or reporting as a core job. We left out pure data pipeline tools with no visualisation, and we did not list Looker Studio itself, since this article covers alternatives to it.
Choosing the right dashboard tool
Start with your data sources, not the chart gallery. List every source you report on, from Google Analytics and ad platforms to your CRM and database, and check that the tool connects to each one without a paid add-on. Next, count builders versus viewers: a tool that charges per viewer gets expensive fast when a whole company needs to see dashboards.
Then test with a real report. Rebuild one monthly report you already produce, and time how long it takes, including data cleaning. A tool that looks simple but needs manual exports every week will cost more in staff time than a pricier tool that refreshes automatically. Finally, check export and sharing: can clients or managers receive a PDF, a link, or a scheduled email without logging into a new system?
A note on the name change
Google renamed Data Studio to Looker Studio some years ago, and the product is now known under that name. If you search for Google Data Studio help or templates, look for Looker Studio results, since that is the current name for the same Google tool.
Frequently asked questions
What are the best google data studio alternatives?
Power BI leads for Microsoft teams, Tableau leads for deep analysis, and Metabase leads for a free open source start. Databox, AgencyAnalytics, Klipfolio and Whatagraph suit marketing teams and agencies that report KPIs or client results.
Is Google Data Studio now Looker Studio?
Yes. Google Data Studio is now Looker Studio, the same free Google dashboard tool under a new name. This article lists alternatives to that product, so Looker Studio itself is not included in the comparison list.
Is there a free alternative to Google Data Studio?
Yes. Metabase offers a free self hosted version, Databox offers a free plan, and Power BI offers a free desktop app for building reports. Free plans usually limit data sources, history or sharing, so check those limits against your reporting needs.
Which alternative is best for agencies?
AgencyAnalytics and Whatagraph are the strongest agency picks on this list, with client dashboards, white label reports and automated delivery. Databox suits smaller agencies that mainly track KPIs, while Klipfolio suits operations heavy agencies with custom dashboard needs.
Do these tools connect to Google Analytics and ad platforms?
Most do. Databox, AgencyAnalytics, Whatagraph and Klipfolio all offer marketing connectors, and Power BI and Tableau connect through their connector libraries. Metabase connects best to databases, so marketing teams may need an extra step to bring ad data in.
Sources
See where you really rank - block by block
ProMapRanker scans Google Maps across a grid of your service area. Simple monthly plans from $19, white-label on every plan.
Start freeKeep reading
 zoro.to alternatives
Best Zoro.to Alternatives in 2026
We compare the best zoro.to alternatives in 2026, listing only legal licensed anime streaming services, from Crunchyroll to free options for fans today.
Read → zip alternatives
Best Zip Alternatives in 2026
We compare the best zip alternatives for buy now, pay later in 2026, covering pay-in-4 plans, fees, spending limits, and credit reporting options today.
Read → yesware alternatives
Best Yesware Alternatives in 2026
Compare the best yesware alternatives for sales email tracking, templates, and sequences, with current pricing and honest tradeoffs for small sales teams.
Read →