 ProMapRanker
Best GoodData Alternatives in 2026

Key takeaways
- Power BI offers the lowest entry price for Microsoft shops, while Tableau offers deeper visual polish at a higher seat cost.
- Looker and Sigma suit teams that need a governed model or live warehouse queries, rather than simple charting.
- Metabase and Apache Superset give budget teams a working BI option without per-user fees for self-hosting.
- Embedding needs change the choice, so test dashboards inside your own product before you sign.
Quick comparison
| Pick | Great for | Pricing starts at | Free tier | |
|---|---|---|---|---|
 Tableau | Visual analytics depth | $15 per user per month | Free trial | Visit |
 Microsoft Power BI | Microsoft 365 teams on a budget | $14 per user per month | Yes | Visit |
 Looker | Governed semantic models | See website | Free trial | Visit |
 Metabase | Budget self-service analytics | $100 per month | Yes | Visit |
 Qlik Sense | Exploratory associative analysis | $30 per user per month | Free trial | Visit |
 ThoughtSpot | Search-driven self-service | $25 per user per month | Free trial | Visit |
 Sisense | Embedded analytics at scale | See website | Free trial | Visit |
 Sigma | Spreadsheet-style warehouse analytics | See website | Free trial | Visit |
 Apache Superset | Free open source dashboards | Free | Yes | Visit |
The best GoodData alternatives
GoodData is known for embedded analytics and a governed semantic layer for software products. These alternatives cover the same ground in different ways, from classic BI dashboards to search-driven analysis and open source tools. We compared official feature pages, pricing pages, app store listings, privacy policies and public reviews.
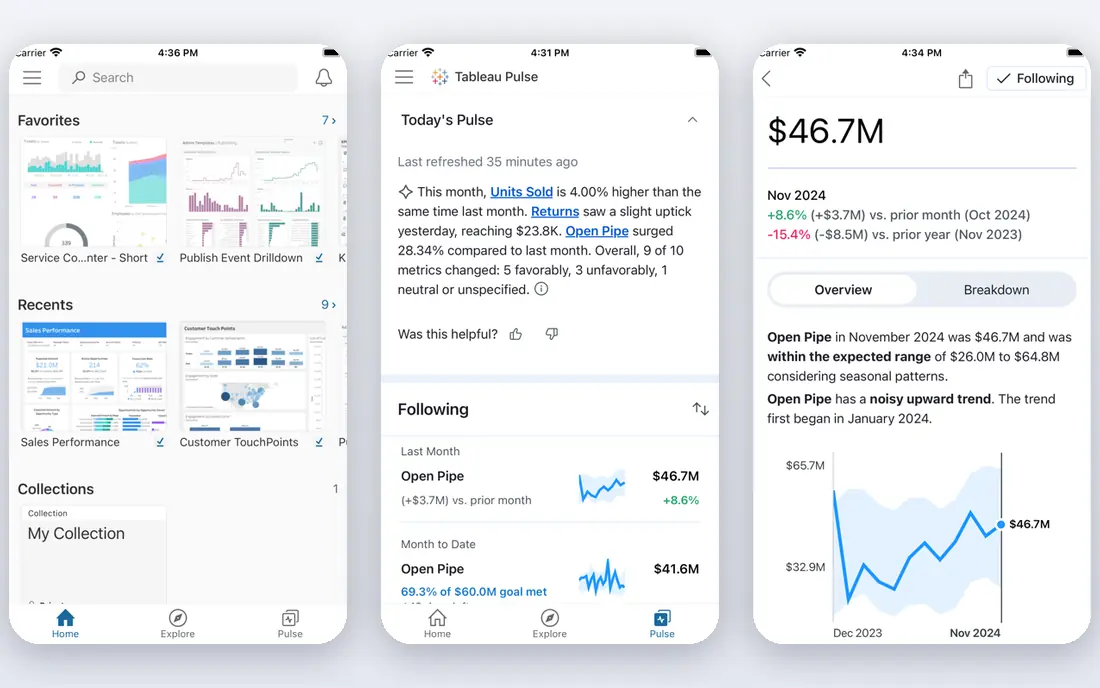
Tableau remains the visual benchmark in BI. Analysts can build polished, interactive dashboards with a drag-and-drop workflow, and viewers can filter and explore without rebuilding the underlying work. The range of connectors also helps teams that pull data from many systems.
Pricing is role based, so the entry viewer price is not the price for someone who builds dashboards. Creator seats cost much more, and a team with many authors should model the mix before buying. If visual quality and analyst freedom matter most, Tableau is a strong pick despite the cost gap.
- Strong visual design
- Flexible dashboard building
- Wide data connector range
- Creator seats cost far more than viewer seats
- Learning curve for advanced work

Power BI is the value leader for teams already using Microsoft 365, Excel and Teams. Pro seats cost far less than Tableau Creator seats, and the free Desktop app lets individuals build reports before sharing. Its semantic models and DAX formulas also give analysts real control over measures.
Sharing is where the cost appears, because viewers generally need a Pro seat or a shared capacity plan. Large governed deployments also need Fabric capacity, which changes the total. For Microsoft shops with a clear seat count, Power BI is hard to beat on price and integration.
- Low Pro seat price
- Native Microsoft 365 integration
- Free Desktop for individual work
- Sharing needs paid seats
- Advanced capacity adds cost at scale

Looker suits organisations where metric consistency is the main problem. Its LookML layer defines business logic once, so every dashboard, embedded view and API result uses the same definitions. That control matters when customers or executives argue about numbers and need one trusted answer.
The trade-offs are price transparency and skills. Pricing is quote based, with platform and user components, and someone on the team must learn LookML. Teams already on BigQuery and Google Cloud will feel at home. Teams that want quick, ad hoc charts may prefer a simpler tool.
- LookML keeps metrics consistent
- Strong embedding and API options
- Google Cloud integration
- Quote-only pricing
- LookML expertise needed to get full value
Metabase is the friendly budget option in this list. Non-technical users can ask questions with a visual builder, while analysts can write SQL when they need more control. The open source version is free to self-host, and cloud plans use flat monthly tiers rather than per-user pricing for the entry tier.
Advanced features such as row-level permissions and single sign-on sit on higher tiers, so growing teams should check the tier map early. Embedding also improves on paid plans. For small teams that need working dashboards this week without enterprise pricing, Metabase is a practical choice.
- Open source self-hosting
- Simple question builder for non-technical users
- Flat cloud tiers
- Advanced governance needs higher tiers
- Embedding and permissions are tier limited
Qlik Sense helps users explore data by showing how selections relate across fields, which suits teams that discover questions as they analyse. Its associative engine highlights associated and unrelated values, making it easier to spot patterns that a fixed report might hide. Dashboards can be built for exploration rather than only for fixed reporting.
Pricing combines capacity and users, so a simple per-seat comparison can mislead. Start with a trial on your real data and check how the starter capacity limits affect your team. If exploratory analysis is central to your work, Qlik Sense offers a distinct and useful model.
- Associative engine for exploring connections
- Strong in-memory analysis
- Flexible dashboards
- Capacity and user mix can complicate pricing
- Interface takes time to learn
ThoughtSpot lets business users type a question and get a chart, which reduces the queue of ad hoc requests for analysts. That search style works best when data is modelled well, with clear measures and dimensions. For executives and managers who want quick answers, it can change how often they ask the data team for help.
It is not a magic answer machine. Poor modelling leads to confusing results, and the entry tier has user limits that larger teams will outgrow. Trial it with questions your team actually asks, not only demo questions. When self-service search is the goal, ThoughtSpot is a leading option.
- Natural language search for data
- Fast answers for business users
- Live query options
- Modelling work still needed for good answers
- Higher tiers rise with users and features
Sisense is built for software teams that embed analytics into products and for larger organisations with complex data. It offers dashboards, embedded views and AI assistance, with a focus on scaling to many users and data sources. Developers get APIs and embedding controls that go beyond a simple iframe.
Small teams may find the sales-led pricing and implementation effort disproportionate to their needs. Get a scoped quote with your user count and embedding requirements, and trial the embedded experience inside your own app. For product embedding at scale, Sisense remains a serious contender.
- Strong embedded analytics
- AI-assisted analysis
- Handles large, complex data models
- Quote-only pricing
- Implementation can be heavy for small teams
Sigma appeals to analysts who think in spreadsheets but need to query a cloud warehouse directly. Its interface feels familiar, with formulas and pivot style work, yet queries run live against warehouse data instead of exporting it. That approach keeps data fresh and avoids stale extracts.
Pricing is quote based, and your warehouse compute is a separate cost, so budget both parts. Teams on Snowflake, BigQuery or similar warehouses will get the most value. If your team lives in spreadsheets and your data already sits in a warehouse, Sigma bridges those worlds well.
- Familiar spreadsheet interface
- Live queries against the warehouse
- No data extraction needed
- Quote-only pricing
- Warehouse costs sit outside the Sigma bill
Apache Superset is the free, open source option for teams with engineering capacity. It offers a wide range of charts, dashboards and a SQL workspace, without licence fees. Organisations that already run open source data tools often add Superset as their visualisation layer.
The cost is operational. You host, secure, upgrade and scale it yourself, and support comes from community resources unless you buy a managed service. For teams that want full control and have platform skills, that trade is worthwhile. For teams that want a managed service, a paid BI tool will save time.
- Free open source core
- Wide chart range
- SQL Lab for analysts
- Self-hosting needs engineering time
- Setup and upgrades are your responsibility
How we picked these
We compared official feature pages, pricing pages, app store listings, privacy policies and public reviews. We kept only tools that exist and work in October 2026 and that offer dashboards, self-service analysis or embedded analytics. We noted where pricing is quote based rather than published, because that gap affects how easily a small team can budget.
How to choose a BI tool
Start with the audience, not the chart library. Executives need trusted, simple dashboards. Analysts need flexible exploration. Customers need embedded views that load fast and match your product. A tool that excels for one audience can frustrate another, so test with each group.
Test with your real data model
Demo data hides modelling pain. Connect your actual warehouse or database, build three dashboards your team uses weekly, and check performance, permissions and refresh behaviour. If a tool struggles with your joins, row counts or security rules, you will learn it in a trial rather than after a contract.
Count authors, viewers and embed users separately
Per-user pricing punishes teams with many authors, while capacity pricing suits large viewer audiences. List how many people build, how many only view, and how many external users will see embedded dashboards. That split often decides between a per-seat tool and a capacity or flat tier tool.
Plan governance early
Decide who owns metric definitions, who can publish, and how changes are reviewed. A governed semantic layer helps at scale, but it also needs an owner. Without that owner, even a strong tool fills with conflicting dashboards, and trust in the numbers falls.
Frequently asked questions
What is the best GoodData alternative for embedded analytics?
Sisense, Looker and Metabase all support embedding, with different strengths. Sisense suits large product embedding, Looker suits governed embedding with a semantic layer, and Metabase suits budget embedding. Test the embedded load time, login flow and styling inside your own product before you choose.
Which BI tool is cheapest for a small team?
Metabase and Apache Superset offer the lowest software cost, especially when self-hosted. Power BI Pro is the cheapest paid seat among major commercial tools in this list. The true cost also includes hosting, warehouse compute and admin time, so compare totals, not only seat prices.
Can non-technical users build their own reports?
Yes, with the right tool and modelling. Metabase, ThoughtSpot and Power BI all offer visual builders or search that help business users. Good modelling, clear field names and a short training session matter more than the tool choice alone. Without those, self-service often stalls.
Do I need a data warehouse to use these tools?
Not always. Many tools connect directly to databases, spreadsheets and cloud apps. A warehouse helps when data is large, messy or spread across systems, and it is central to Sigma and Looker style workflows. Small teams can start with direct connections and add a warehouse later.
How is GoodData different from Tableau or Power BI?
GoodData focuses more on embedded analytics for software products and a governed semantic layer, while Tableau and Power BI focus more on internal dashboards and self-service analysis. The alternatives here overlap, so the choice depends on whether your main audience is internal staff or external product users.
What should I check before switching BI tools?
Check dashboard migration effort, metric definitions, permissions, embedding, refresh schedules and export options. Run the new tool alongside the old one for a reporting cycle, and confirm that key numbers match. A parallel run catches definition differences before users lose trust in the new dashboards.
Sources
See where you really rank - block by block
ProMapRanker scans Google Maps across a grid of your service area. Simple monthly plans from $19, white-label on every plan.
Start freeKeep reading
 zyte alternatives
Best Zyte Alternatives in 2026
These zyte alternatives cover managed scraping APIs, proxy networks and no code tools for lawful collection from your own or consented sources only in 2026.
Read → zerto alternatives
Best Zerto Alternatives in 2026
Compare the best zerto alternatives for disaster recovery and replication, with recovery targets, cloud options and honest trade-offs for teams in 2026.
Read → zerofox alternatives
Best ZeroFox Alternatives in 2026
We compared 9 zerofox alternatives for brand protection, phishing takedowns, dark web monitoring, and social impersonation, with clear coverage notes.
Read →