 ProMapRanker
Best Dynatrace Alternatives in 2026


All-in-one cloud observability · Pricing starts at: $15 per host per month
Key takeaways
- Datadog is the broadest all-in-one alternative, while New Relic offers a generous free ingest tier for smaller teams.
- Grafana Cloud suits teams already invested in open source dashboards and OpenTelemetry.
- Splunk Observability and AppDynamics fit enterprises with existing vendor relationships and strict compliance needs.
- Pricing models differ sharply, so compare per-host, per-user, and per-gigabyte costs on your own volume.
Quick comparison
| Pick | Great for | Pricing starts at | Free tier | |
|---|---|---|---|---|
| Datadog | All-in-one cloud observability | $15 per host per month | Free trial | Visit |
 New Relic | Usage-based observability | Free | Yes | Visit |
 AppDynamics | Enterprise APM | See website | Free trial | Visit |
 Splunk Observability | Splunk-based enterprises | $15 per host per month | Free trial | Visit |
 Grafana Cloud | Open source dashboards | Free | Yes | Visit |
 Elastic Observability | Search-led observability | See website | Yes | Visit |
 Honeycomb | Trace-first debugging | See website | Yes | Visit |
 Instana | Automated discovery | See website | Free trial | Visit |
 Sentry | Error tracking plus APM | $26 per month | Yes | Visit |
The best dynatrace alternatives
We compared these platforms on APM, logs, traces, infrastructure monitoring, and pricing. Dynatrace itself is not listed, because this guide covers what to use instead of it.
Datadog is the broadest alternative for cloud-native teams that want one platform for infrastructure, applications, logs, and user experience. Its integration library covers most cloud services and tools, and dashboards bring those signals together for on-call teams. If your team wants a single vendor for observability, Datadog is the default shortlist pick.
Cost control is the work here. Each product bills separately, so a full setup can grow well beyond the infrastructure starting price. Model hosts, log volume, and APM usage together, and set retention limits early, before the first large bill arrives.
- Very broad integration coverage
- Logs, metrics, traces, and security in one platform
- Strong dashboards
- Bills grow across many separate products
- Pricing needs careful modeling
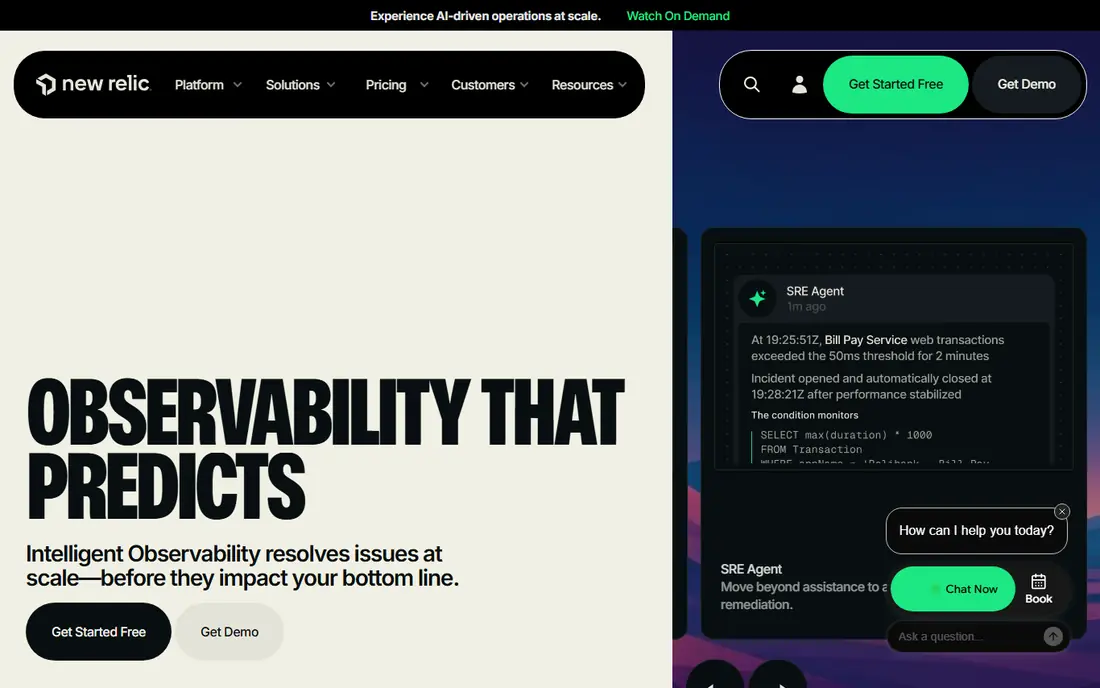
New Relic suits teams that want to start small and pay mainly for data volume. The free tier includes 100 GB of ingest per month, which covers many startups and side projects, and the platform covers APM, logs, infrastructure, and browser monitoring in one place. OpenTelemetry support also helps teams avoid being locked to one agent.
The catch is that usage-based pricing can climb as traffic grows, and full-platform user seats add cost on higher tiers. For teams with modest ingest and clear retention rules, New Relic is a strong, low-friction alternative.
- Free tier includes 100 GB of ingest per month
- Full platform in one account
- OpenTelemetry support
- Costs rise with ingest and full-platform users
- Pricing tiers need reading

AppDynamics, part of Cisco, targets enterprises that need deep APM with a business lens. It traces transactions end to end, ties performance to business outcomes, and offers the support structure large organizations expect. Teams with complex, revenue-critical applications often value that depth.
Smaller teams may find the sales-led pricing and implementation effort heavy. Check current pricing on the vendor site and plan for an owner who can manage agents and dashboards. For enterprise APM, AppDynamics remains a serious Dynatrace rival.
- Deep application performance tracing
- Business transaction focus
- Enterprise support
- Pricing is quote-based
- Setup suits larger teams with dedicated owners
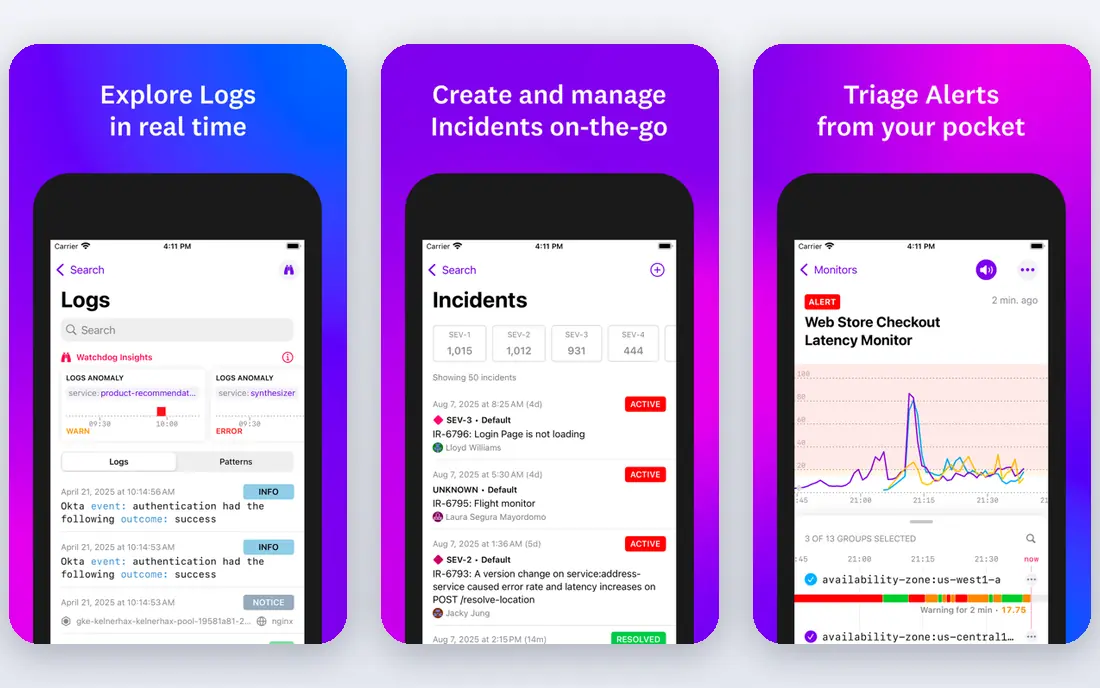
Splunk Observability Cloud suits organizations already invested in Splunk for logs and security. Infrastructure pricing starts at $15 per host per month, with higher tiers for application and end-to-end monitoring. OpenTelemetry ingestion helps teams standardize instrumentation across services.
Total cost depends on which tiers and log volumes you choose, so model the full stack, not just the starting tier. New users also face a learning curve with Splunk's query approach. For Splunk shops, the integration benefit is real and often decisive.
- Strong log and metric analysis
- OpenTelemetry support
- Fits existing Splunk investments
- Full end-to-end pricing rises per host
- Learning curve for new users
Grafana Cloud is the pick for teams that already love Grafana dashboards and open source tooling. The free tier covers logs, metrics, and traces for small use, and the Pro plan starts at $19 per month plus usage. Loki, Mimir, and Tempo give a coherent open source stack behind a managed service.
Usage charges still apply beyond the free tier, and teams that self-host Grafana instead take on operations work. For dashboard-led teams that want flexibility and OpenTelemetry support, Grafana Cloud is a strong, cost-aware alternative.
- Free tier for logs, metrics, and traces
- Familiar Grafana dashboards
- OpenTelemetry via Alloy
- Pro plan starts at $19 per month plus usage
- Self-hosting needs operations effort
Elastic Observability suits teams that already use Elasticsearch or need strong search across logs. It covers APM, logs, metrics, and uptime, with machine learning features for anomaly detection. Self-hosting is an option for teams that want control over data and costs.
Deployment choice drives price and effort. Managed pricing varies, and self-hosted Elasticsearch needs tuning and care at scale. For search-led teams with Elasticsearch skills, Elastic is a flexible alternative to a single-vendor APM suite.
- Search and analytics strength
- Logs, APM, and security in one stack
- Self-hosted option
- Pricing varies by deployment
- Running Elasticsearch well needs expertise
Honeycomb is built for debugging complex production systems through wide, high-cardinality events rather than pre-aggregated metrics. Engineers can ask new questions of live data without re-instrumenting, which helps when an incident does not match a known dashboard. Unlimited seats on some plans also help whole teams investigate together.
It is not a general infrastructure monitoring suite in the same way Datadog is, so teams may pair it with another tool for host and network basics. Event volume planning matters for cost. For trace-first debugging, Honeycomb is a distinctive and well-liked pick.
- High-cardinality event tracing
- Fast debugging of production issues
- Unlimited seats on some plans
- Event-based pricing needs volume planning
- Less of a general infrastructure suite
Instana, part of IBM, focuses on automatic discovery of services, dependencies, and changes, with tracing at fine granularity. That automation helps teams with fast-changing microservices, where manual service maps go stale quickly. Enterprise support through IBM suits regulated or large organizations.
Pricing is quote-based, so budgeting needs a sales conversation. The community and third-party guide volume is also smaller than for Datadog or New Relic. For automated, enterprise-grade observability, Instana is worth including in a shortlist.
- Automatic discovery and mapping
- Fine-grained tracing
- IBM enterprise backing
- Pricing is quote-based
- Smaller community than Datadog or New Relic
Sentry is developer-first: it catches errors, shows the code context behind them, and adds APM and profiling for performance issues. The free tier suits small projects, and paid plans start at $26 per month. Teams that fix bugs from Sentry daily often find it faster for application issues than a general platform.
It does not replace full infrastructure, network, and log suites on its own, so larger organizations may pair Sentry with Grafana or another platform. For application teams that prioritize error and performance fixing, Sentry is a focused and effective alternative.
- Excellent error tracking
- APM and profiling for developers
- Free tier for small projects
- Less full-stack infrastructure coverage
- Larger observability bills need planning
How we picked these
We compared official pricing pages, APM and log coverage, OpenTelemetry support, and deployment options, and we kept only platforms that are live in October 2026 and truly serve observability workloads. We included all-in-one suites, open source-led options, and developer-focused tools, so readers can match a platform to team size and stack.
What to check before you switch
Model cost on your own numbers, not on a starting price. Hosts, ingest volume, retention days, and user seats each drive a different vendor's bill, and the cheapest starting price can become the most expensive full setup. Run a trial with production-like traffic and check the bill forecast, not just the dashboards.
Also check instrumentation. OpenTelemetry support makes switching easier, but agent features, sampling, and custom metrics still vary. Finally, test incident workflows: alerting, on-call routing, and the path from alert to root cause matter more in a real outage than any feature list. Also agree on retention before you scale. Longer retention helps post-incident review, but it raises ingest and storage costs on most platforms. Decide which signals need long retention and which can expire sooner, and review that policy each quarter. A short runbook for common alerts, with owners and escalation steps, will make any platform here work better in practice.
Frequently asked questions
What is the best alternative to Dynatrace?
Datadog is the broadest alternative for all-in-one observability, while New Relic is best for teams that want a generous free ingest tier. Grafana Cloud is best for open source-led teams, and Splunk Observability is best for existing Splunk users.
Are there free alternatives to Dynatrace?
Yes. New Relic, Grafana Cloud, Elastic Observability, Honeycomb, and Sentry all offer free tiers, while Datadog, AppDynamics, Splunk Observability, and Instana offer free trials. Free tiers usually limit volume, retention, or seats.
Which alternative to Dynatrace is best for small teams?
New Relic and Grafana Cloud are strong for small teams because of their free tiers and usage-based pricing. Sentry is also a good fit when error tracking and application performance matter more than full infrastructure monitoring.
What are alternatives to Dynatrace for Kubernetes?
Datadog, New Relic, Grafana Cloud, and Splunk Observability all support Kubernetes monitoring, with container and cluster views. Check agent support for your distribution and whether Kubernetes metrics are included in the tier you plan to buy.
Can I migrate from Dynatrace without rewriting all instrumentation?
Often, yes, if you use OpenTelemetry, since most platforms here accept it. Agent-specific features and custom dashboards will still need rework, so budget time for dashboards, alerts, and retention settings during migration.
Sources
See where you really rank - block by block
ProMapRanker scans Google Maps across a grid of your service area. Simple monthly plans from $19, white-label on every plan.
Start freeKeep reading
 zscaler alternatives
Best Zscaler Alternatives in 2026
Looking for zscaler alternatives? We compare 9 SASE and zero trust platforms on architecture, data protection, pricing, and fit for your network and team.
Read → zapier alternatives free
Best Zapier Alternatives Free in 2026
Nine automation tools for zapier alternatives free in 2026, all with genuinely free tiers, plus free plan limits, starting prices and upgrade paths explained.
Read → which platform is best for online reputation
Which Platform Is Best for Online Reputation in 2026
Wondering which platform is best for online reputation? We compare 8 review, listing, and response tools for small and multi-location businesses and agencies.
Read →