 ProMapRanker
Best Datadog Alternatives in 2026


All-in-one observability with a genuinely free start · Pricing starts at: Free
Key takeaways
- New Relic is the easiest free start, with a free tier that includes a monthly data allowance and one full user.
- Grafana Cloud suits teams already built on Prometheus and other open standards, with a free tier and a low paid platform fee.
- Dynatrace and Splunk fit large enterprises that want automatic discovery and deep log analytics, but both are quote-led at scale.
- Prometheus and Zabbix cost nothing to self-host, yet they need more setup and care than a managed platform.
- Sentry and Honeycomb are the sharpest picks when error tracking or trace-first debugging matters more than infrastructure metrics.
Quick comparison
| Pick | Great for | Pricing starts at | Free tier | |
|---|---|---|---|---|
| New Relic | All-in-one observability with a genuinely free start | Free | Yes | Visit |
 Grafana Cloud | Teams built on open observability standards | Free | Yes | Visit |
 Dynatrace | Large enterprises with complex environments | See website | Free trial | Visit |
 Splunk Observability Cloud | Enterprises that need streaming log and real-time analytics | See website | Free trial | Visit |
 Sentry | Error tracking plus performance monitoring for developers | $26 per month | Yes | Visit |
 Prometheus | Kubernetes and cloud-native metrics | Free | Yes | Visit |
 Zabbix | On-premises infrastructure monitoring at scale | Free | Yes | Visit |
 Elastic Observability | Search-led logs, metrics and APM | See website | Yes | Visit |
 Honeycomb | Trace-first debugging of distributed systems | See website | Yes | Visit |
The best datadog alternatives
Datadog bundles infrastructure monitoring, application performance monitoring, logs and security in one platform, and its bill grows with hosts and data volume. These alternatives cover the same ground with different pricing models, from free open-source tools to enterprise platforms.
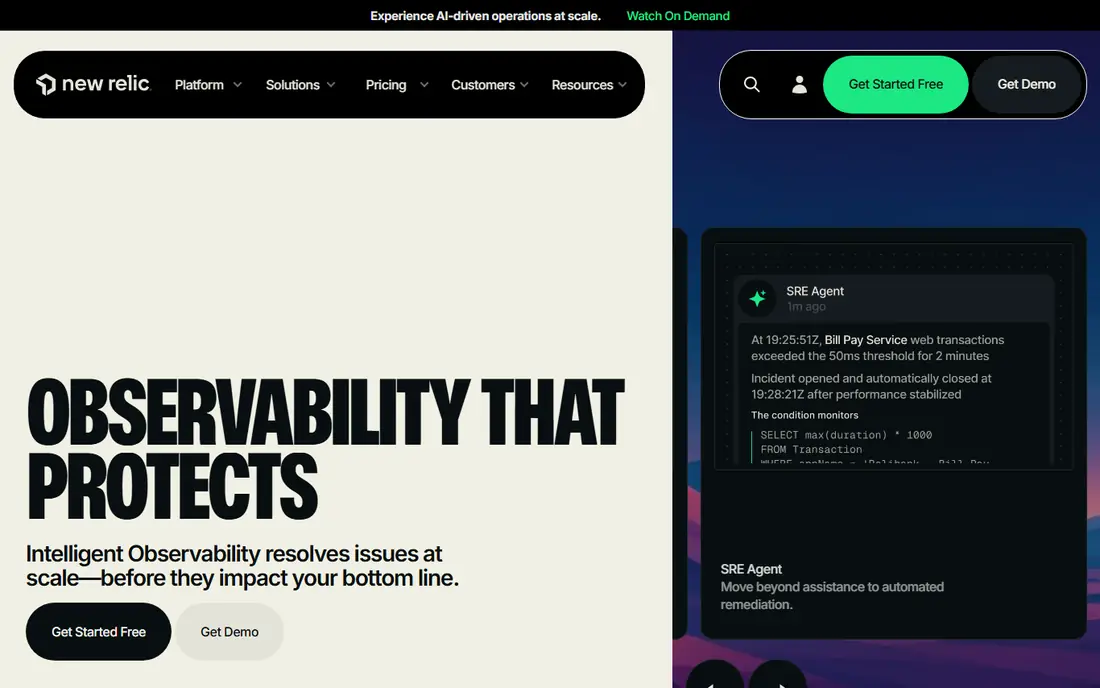
New Relic is the most direct Datadog replacement for teams that want one platform without per-host pricing. The free tier includes 100 GB of data ingest per month and one full user, which is enough for a small application to run real monitoring rather than a short trial. Paid plans move to per-user pricing with data charges, so costs track team size and volume more predictably than host counts for many setups.
The learning curve is real. New Relic Query Language is powerful, but teams new to it will spend time building dashboards and alerts before the platform feels natural. Still, for a team leaving Datadog over cost, New Relic's free tier and broad coverage make it the first tool to try.
- Free tier with monthly data allowance
- Broad APM, logs and infrastructure coverage
- User-based paid pricing
- Query language takes time to learn
- Data overages can raise costs at scale
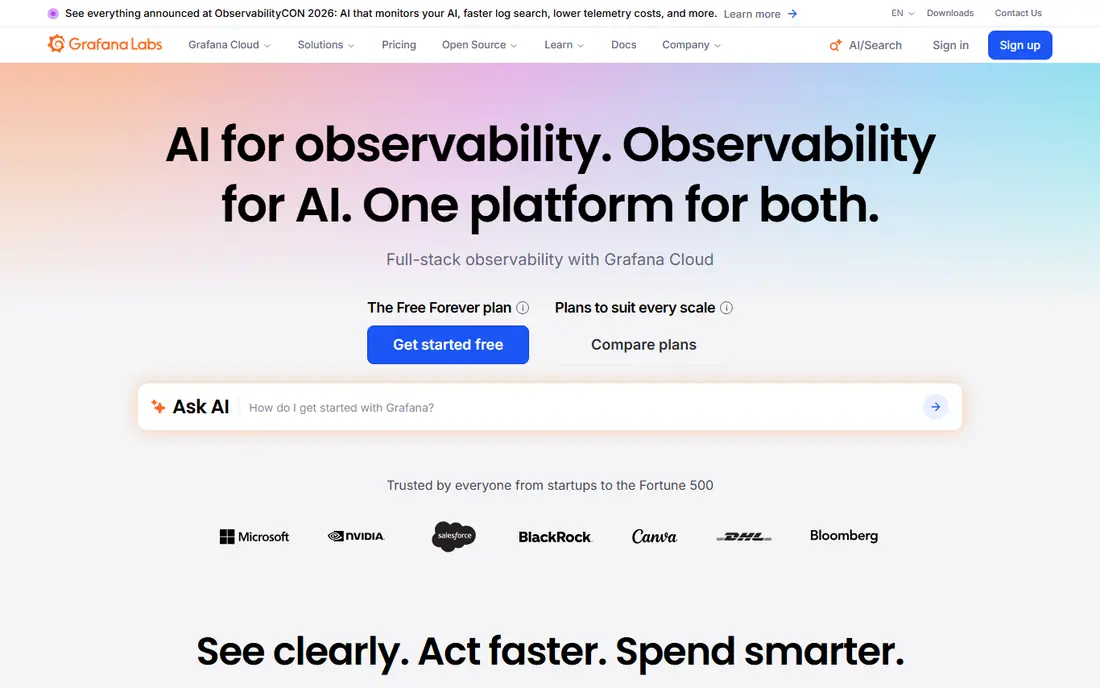
Grafana Cloud takes the open-source tools many teams already run and offers them as a managed service. Dashboards are its calling card, with support for Prometheus metrics, Loki logs, Tempo traces and dozens of other data sources in one view. The free tier lets a small team get started without a card, and paid plans start with a platform fee plus usage charges.
The trade-off is assembly. Grafana Cloud is a set of composable pieces rather than a single opinionated agent, so teams need to decide how metrics, logs and traces fit together. That flexibility is a strength for engineers who know their stack, and a slower start for teams that want everything configured out of the box.
- Free tier
- Works with Prometheus, Loki and Tempo
- Strong dashboards and alerting
- Paid plans add a platform fee plus usage
- Assembling the full stack takes planning
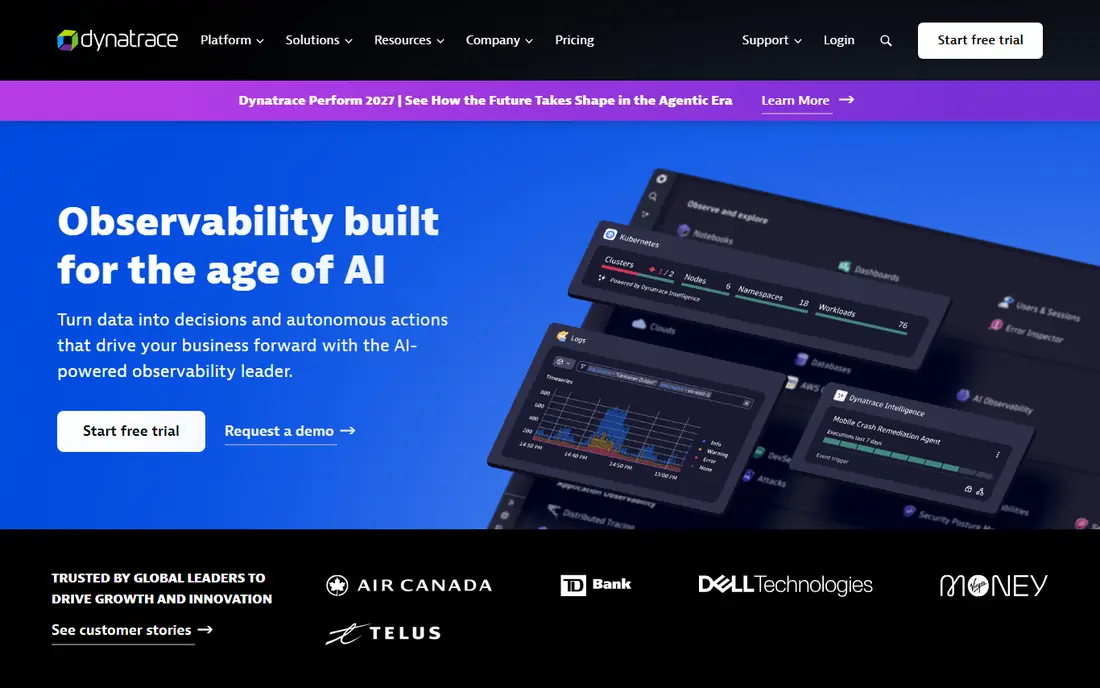
Dynatrace installs a single agent that discovers services, maps dependencies and monitors full-stack performance with little manual configuration. Its Davis AI analysis points to likely root causes rather than leaving engineers to correlate charts by hand. For a large enterprise with hundreds of services, that automatic mapping saves weeks of setup compared with hand-built dashboards.
Pricing is the main barrier. Dynatrace publishes a rate card but enterprise deals are typically negotiated, and the platform's breadth can feel heavy for a small team. It is the right alternative when automatic discovery and enterprise governance matter more than a low entry price.
- Automatic discovery and mapping
- AI-assisted root cause analysis
- Broad enterprise coverage
- Quote-led pricing at scale
- Depth can overwhelm small teams
Splunk Observability Cloud
Great for: Enterprises that need streaming log and real-time analytics
Splunk Observability Cloud brings Splunk's log analytics strength to infrastructure and application monitoring, with streaming analytics that surface problems as data arrives. Teams already invested in Splunk for security or IT operations get a familiar query approach and shared data pipelines. That shared foundation is a strong reason to choose Splunk over a separate monitoring vendor.
Cost and complexity are the catches. Pricing depends on hosts, data volume and product mix, and it is negotiated rather than published as a single simple rate. Smaller teams will usually find New Relic or Grafana Cloud easier to buy and run.
- Powerful log analytics
- Real-time streaming
- Strong fit for teams already using Splunk
- Pricing is complex and quote-led
- Learning curve for new users
Sentry starts from the developer's view: when code breaks in production, it shows the error, the stack trace and the affected users in one place. The free developer plan covers small projects, and the Team plan starts at $26 per month billed annually, adding performance monitoring and more event volume. That focus makes Sentry a natural complement to infrastructure monitoring, and for many app teams it is enough on its own.
It is not a full infrastructure replacement. Host metrics, network monitoring and log management are thinner here than in Datadog or New Relic, so teams that need deep infrastructure coverage should pair Sentry with Prometheus or Grafana Cloud.
- Developer-friendly error workflow
- Free developer plan
- Performance monitoring included
- Infrastructure monitoring is thinner than Datadog
- Costs rise with event volume
Prometheus is the default metrics system for Kubernetes, and for good reason. It pulls metrics from services, stores them as time series, alerts through Alertmanager and answers questions with PromQL. It costs nothing to run, and its exporter ecosystem covers databases, queues, hardware and cloud services. Teams that already run Kubernetes often have Prometheus in place before they start shopping for a Datadog alternative.
The work is in the surrounding pieces. Long-term storage, dashboards and log management usually come from Grafana, Thanos or a managed service, and all of that needs care. Prometheus is the best alternative when your team is comfortable running open-source infrastructure and wants full control over data.
- Free and open source
- Standard for Kubernetes
- Powerful query language and alerting
- Needs separate storage and visualisation for long retention
- Setup and care fall on your team
Zabbix monitors servers, networks, cloud instances and devices from one on-premises platform, with templates that cover common systems out of the box. It is free to use, scales to large estates and suits organisations that must keep monitoring data inside their own network. Public sector and enterprise IT teams with mixed hardware often pick Zabbix for exactly that control.
The interface and configuration are less polished than modern SaaS tools, and tuning templates and triggers takes patience. Teams that want a managed, hands-off experience will prefer Grafana Cloud or New Relic, but teams that value self-hosting and zero licence cost will find Zabbix hard to beat.
- Free and open source
- Broad device and server monitoring
- Mature alerting and templates
- Interface feels dated
- Setup and tuning take time
Elastic Observability builds on Elasticsearch, so searching logs feels like searching a database: fast, flexible and precise. It covers APM, infrastructure metrics, logs and uptime, and teams can run it themselves or use Elastic Cloud. Organisations already running Elasticsearch for search get an easy path to observability on infrastructure they understand.
Resource use is the honest catch. Elasticsearch clusters need memory, disk and care as data grows, and cloud costs follow usage closely. Teams with heavy log volumes should set retention and filtering policies early, or the bill will surprise them just as a Datadog bill can.
- Powerful search across logs and traces
- Self-managed option
- Mature APM agents
- Resource needs grow with data volume
- Cloud pricing depends on usage
Honeycomb is built for a specific pain: a request that touches many services and fails in a way no single dashboard explains. Its tracing handles high-cardinality data well, so engineers can slice by user, build version or any other attribute and find the failing path quickly. The free plan gives small teams a real way to try that workflow before paying.
It is not a like-for-like Datadog replacement for infrastructure metrics and host monitoring. Teams that adopt Honeycomb usually pair it with Prometheus or Grafana for infrastructure, using Honeycomb where debugging distributed traces matters most.
- Free plan
- High-cardinality tracing
- Fast querying for debugging complex requests
- Less infrastructure monitoring depth
- Usage pricing needs volume forecasting
How we picked these
We compared official pricing pages, free tier terms and product documentation for each tool, and we checked that each one is actively maintained and available in October 2026. A tool made this list only when it covers a substantial part of Datadog's job: infrastructure metrics, APM, logs, traces or error tracking. We avoided tools that only do uptime checks, and we flagged quote-led pricing plainly instead of estimating a price we could not verify.
What to check before you switch
Start with what you actually monitor today. Export a list of your hosts, services and data volumes, and check which of those each alternative covers without add-ons. A team that mostly needs APM and error tracking can save money with Sentry or New Relic, while a team with heavy log volume should test Elastic or Splunk on real log samples. Next, set retention and cardinality limits on day one. Most surprise bills in observability come from keeping high-cardinality data longer than anyone needs, so decide retention per data type before migration.
Also test the agent and the alert path. Install the agent on a staging service, trigger a real failure and follow the alert from detection to the dashboard that explains it. The tool that gets an on-call engineer to the cause fastest is usually the right pick, even when another tool looks cheaper on paper. Finally, confirm data residency and access controls if you operate in regulated industries, since self-hosted options give more control here than most SaaS platforms.
Frequently asked questions
What is the best Datadog alternative overall?
New Relic is the best overall alternative for most teams, thanks to its free tier, broad APM and infrastructure coverage, and per-user pricing. Grafana Cloud is the better pick for teams already committed to open-source tooling, and Dynatrace suits large enterprises that want automatic discovery.
What are the best free Datadog alternatives?
Prometheus, Zabbix, New Relic and Grafana Cloud all offer genuinely free starting points. Prometheus and Zabbix are free to self-host with no usage cap beyond your hardware, while New Relic and Grafana Cloud offer managed free tiers with data allowances.
Is Grafana a replacement for Datadog?
Grafana Cloud can replace Datadog for metrics, logs and traces, especially when paired with Prometheus, Loki and Tempo. It needs more assembly than Datadog, since you choose how each signal is collected and stored, but it avoids per-host pricing and vendor lock-in.
Which Datadog alternative is best for error tracking?
Sentry is the best pick for error tracking, with a developer-focused workflow that links errors to releases, users and performance data. Honeycomb is stronger for tracing complex distributed requests, while New Relic covers errors as part of a broader APM suite.
How do I reduce observability costs when switching from Datadog?
Measure hosts, data ingest and retention before you switch, then set cardinality limits and retention policies in the new tool. Free tiers and usage-based pricing help small teams, but the largest savings usually come from dropping unused metrics and shortening log retention for low-value data.
Sources
See where you really rank - block by block
ProMapRanker scans Google Maps across a grid of your service area. Simple monthly plans from $19, white-label on every plan.
Start freeKeep reading
 zoom alternatives for webinars
Best Zoom Alternatives for Webinars in 2026
Discover zoom alternatives for webinars in 2026, from browser-based rooms to sales-focused platforms, with pricing, audience limits and honest trade-offs.
Read → tipalti alternatives
Best Tipalti Alternatives in 2026
Compare the best tipalti alternatives for accounts payable, global payouts and bill pay, with pricing and free plans for small teams in 2026 for US teams.
Read → mixpanel alternatives
Best Mixpanel Alternatives in 2026
Compare the best mixpanel alternatives for product analytics, funnels and retention, with free tiers and current pricing for growing teams in 2026 for US teams.
Read →