 ProMapRanker
Best Coralogix Alternatives in 2026


Broadest all-in-one observability · Pricing starts at: $15 per host per month
Key takeaways
- Datadog is the broadest like-for-like replacement, with the widest integration catalog and per-product pricing to watch closely.
- Grafana Cloud and SigNoz suit teams that want open standards and a free starting point without vendor lock-in.
- New Relic gives small teams a generous free data allowance of 100 GB per month, then charges per GB and per full platform user.
- Honeycomb fits teams that debug by high-cardinality traces and events rather than by host counts.
- Pricing units differ sharply, so compare your own log volume, host count, and user count before choosing.
Quick comparison
| Pick | Great for | Pricing starts at | Free tier | |
|---|---|---|---|---|
| Datadog | Broadest all-in-one observability | $15 per host per month | No | Visit |
 New Relic | Generous free data allowance | Free | Yes | Visit |
 Grafana Cloud | Open stack with a real free tier | Free | Yes | Visit |
 Splunk Observability Cloud | Splunk shops and enterprise scale | $15 per host per month | No | Visit |
 Dynatrace | Automatic discovery and root cause | See website | No | Visit |
 Elastic Observability | Search-led logs and self-hosting | See website | Yes | Visit |
 Honeycomb | Trace-first debugging | Free | Yes | Visit |
 Sumo Logic | Log analytics and security use | Free | Yes | Visit |
 SigNoz | OpenTelemetry-first and self-hosting | $49 per month | Yes | Visit |
The best coralogix alternatives
Coralogix charges mainly by data volume, with logs, traces, and metrics priced per GB and no per-host or per-user fee on its published model. The tools below cover the same ground in different ways, from per-host suites to open-source stacks you can run yourself. We compared official pricing pages, product documentation, and public reviews, and we did not claim hands-on testing we did not do. Use these tools only for systems you are authorised to monitor, and note that software alone does not make an organisation compliant with any regulation.
Datadog is the closest direct replacement for a team that wants everything from one vendor. Infrastructure monitoring starts at $15 per host per month on annual billing, APM adds $31 per host per month, and logs are charged by ingestion and indexing. That breadth helps large teams that already run many cloud services and want one place to search across them.
The risk is cost control. Custom metrics, indexed spans, and longer retention each add their own charges, so a busy incident or a new label can move the bill. Datadog suits teams with someone watching usage and setting limits, rather than a small team that wants a set-and-forget price.
- Very wide integration catalog
- Logs, metrics, traces, and security in one place
- Strong dashboards
- Bill can grow fast with add-ons and high-cardinality data
- Pricing is complex
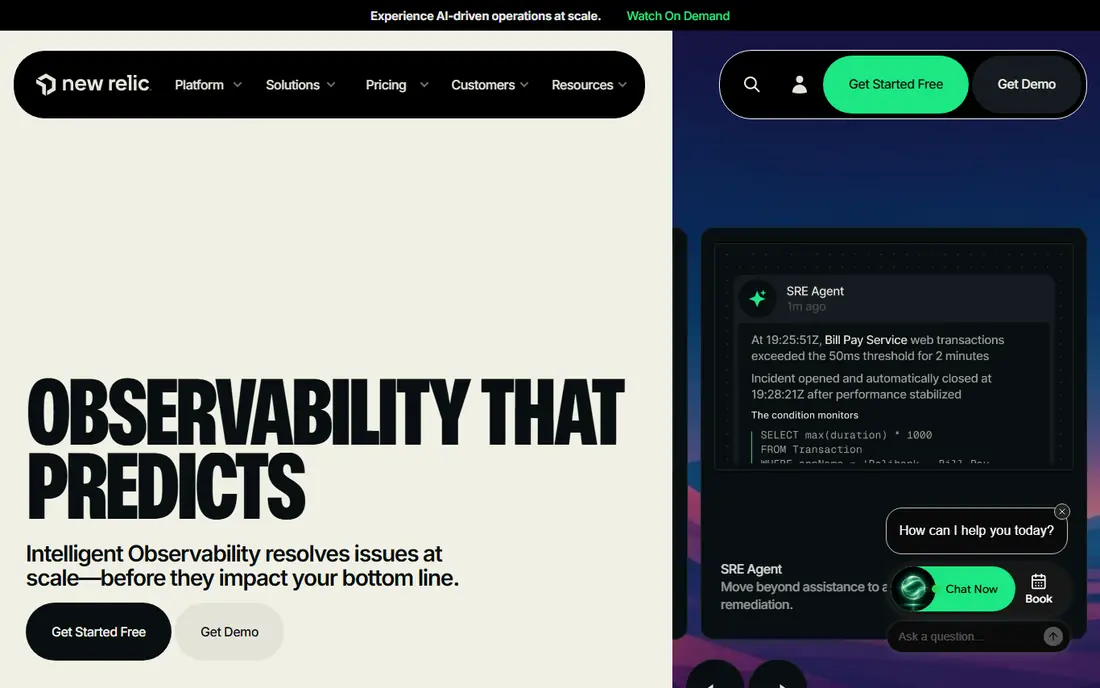
New Relic is the easiest free start in this list for a small app. The free tier includes 100 GB of data ingest per month and one full platform user, with unlimited basic users for viewing dashboards and alerts. APM, infrastructure, logs, and browser monitoring all feed the same query language, which keeps troubleshooting in one place.
Costs appear when the team grows. Standard adds full platform users at $99 per month after a $10 first user, and Pro full platform users cost $349 per month on annual billing. Data beyond 100 GB costs $0.40 per GB on the standard option. For a solo developer or a tiny team, that free allowance goes a long way.
- 100 GB free data ingest per month
- Unlimited basic users
- One data model for all signals
- Full platform users get costly on Pro
- Data overage adds up at scale
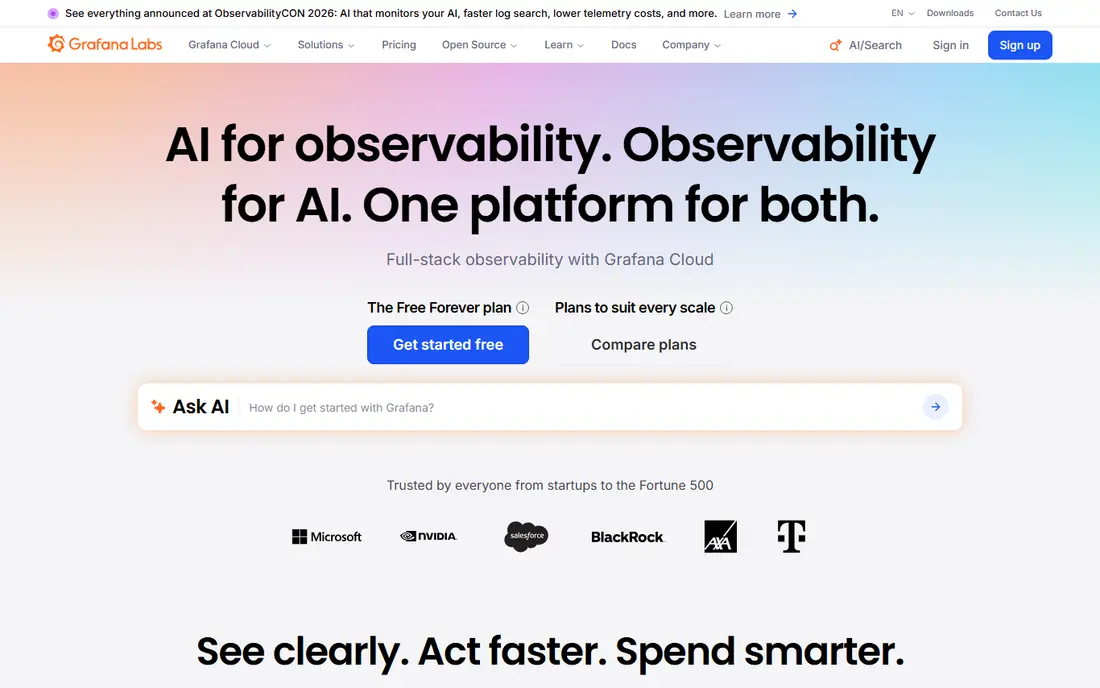
Grafana Cloud appeals to teams that already live in Grafana dashboards or Prometheus metrics. The free tier includes 10,000 active series, 50 GB each of logs and traces, and three users, with 14-day retention. Pro starts at $19 per month plus usage, with longer retention and support, which makes the step up gradual for a growing service.
The trade-off is that usage meters still matter. Active series, GB written, and dashboard users each count, so a noisy service can push the bill up even though the base fee is low. Grafana Cloud is a good pick when you want open tooling, portable dashboards, and a managed service without rewriting your existing stack.
- Free tier covers metrics, logs, and traces
- Open standards and Prometheus familiarity
- Strong dashboards
- Pro usage charges need careful tracking
- Enterprise support sits at a high commit
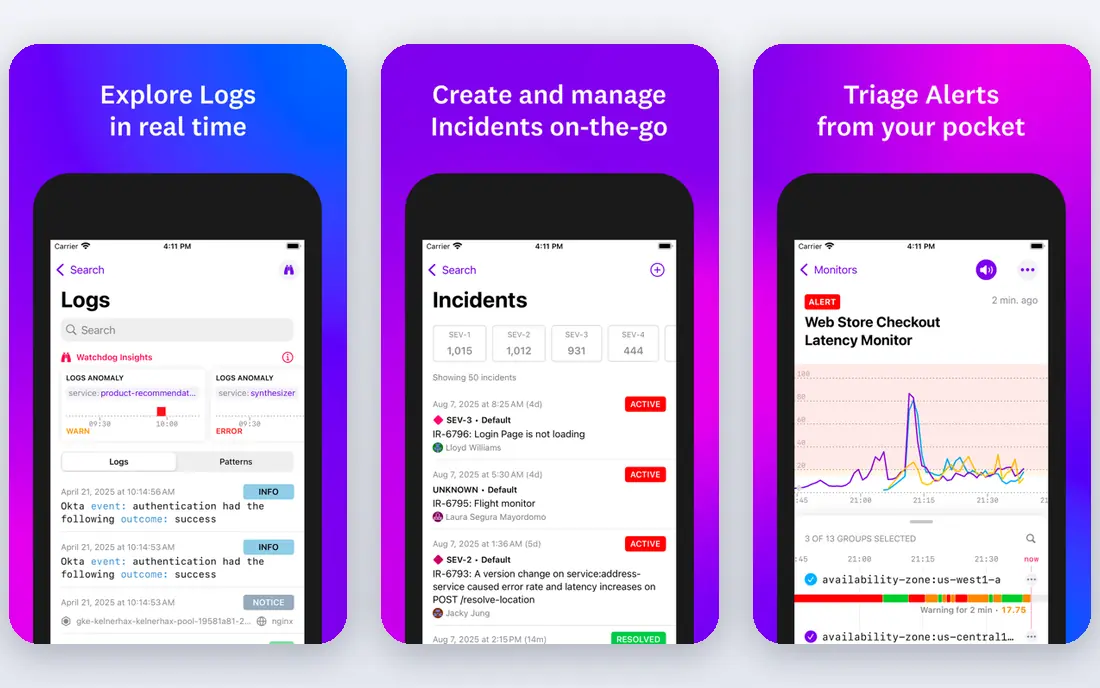
Splunk Observability Cloud makes most sense for organisations already using Splunk for logs or security. Host editions start at $15 per month for infrastructure, $60 for app plus infrastructure, and $75 for end-to-end coverage, while logs are licensed separately. That structure gives large teams a clear way to buy APM and infrastructure monitoring alongside their existing Splunk investment.
Smaller teams may find the total harder to predict, since the host price is only part of the bill. A trial helps, but a realistic estimate needs your host count, log volume, and retention needs in one conversation. For a Splunk-heavy enterprise, the shared data model and security tooling can justify that effort.
- Deep fit with Splunk logs and security tools
- Per-host editions are clear
- Strong enterprise controls
- Logs are priced separately from host editions
- Total cost needs a sales conversation at scale
Dynatrace stands out for automatic discovery. Its agent maps services, dependencies, and infrastructure with less manual setup than many rivals, and its Davis AI features help point to a likely root cause during incidents. Infrastructure-only monitoring is listed around $29 per host per month in third-party summaries of its consumption model, while full-stack coverage costs more.
The downside is pricing clarity. Dynatrace uses consumption units rather than a single flat rate, so two teams with similar host counts can get different bills. That model suits enterprises that want deep automation and can negotiate a committed plan, but it is less friendly for a small team that wants a simple monthly figure.
- Automatic service discovery and dependency mapping
- Strong AI-assisted root cause
- Managed option available
- Consumption pricing is hard to compare at a glance
- Best suited to larger estates
Elastic Observability is built on Elasticsearch, so teams that already search logs with Elastic will feel at home. You can self-host the open stack for free apart from your own infrastructure, or use Elastic Cloud with resource-based pricing that scales with compute and storage. Logs, metrics, traces, and security data share the same search and dashboard tools.
Self-hosting is the catch for small teams. Elasticsearch needs care around indexing, storage, and upgrades, and a poorly tuned cluster can be slow or costly. Elastic Cloud removes that burden but makes the bill depend on deployment size rather than a simple per-host rate. Pick Elastic when search quality and deployment control matter more than a single flat price.
- Powerful search across logs and traces
- Self-hosted open option
- Flexible deployment choices
- Running Elasticsearch well takes skill
- Cloud pricing is resource-based and varies
Honeycomb takes a different view of debugging. Instead of pre-built dashboards for each host, it lets engineers query wide events with many fields, which helps when a bug only appears for a small slice of users. The free tier covers up to 20 million events, and Pro starts at $150 per month, with unlimited seats so the whole team can query without seat fees.
Honeycomb is not a one-to-one replacement for a full infrastructure suite. Teams that need deep host monitoring, network maps, or security tooling will still need another tool alongside it. For product and platform teams that spend most incident time tracing requests across services, Honeycomb can be the fastest path to an answer.
- Free tier up to 20 million events
- Unlimited seats
- High-cardinality queries without per-label charges
- Pro starts at $150 per month
- Less of a general infrastructure suite than Datadog
Sumo Logic started in log analytics and still shines there, with a free tier covering limited daily log volume and 7-day retention. Paid tiers use credits, with log analytics and security analytics sold as separate focuses, which lets a team buy for operations or for security without paying for both at full strength. Global intelligence features add context from across its customer base.
Credit pricing is the weak point for budgeting. The per-credit rate looks small, but total credits depend on ingestion, retention, and query patterns, so a first bill can surprise a new team. Sumo Logic fits log-heavy teams and security teams that already think in terms of log volume and retention, rather than teams that want a simple per-host price.
- Free tier for log analytics
- Strong security analytics option
- Mature log search
- Credit-based pricing can be confusing
- Advanced observability sits on higher tiers
SigNoz is the open-source option for teams that want to standardise on OpenTelemetry. The self-hosted version is free apart from infrastructure, and SigNoz Cloud starts at $49 per month plus usage, with logs priced around $0.30 per GB in third-party summaries. Metrics, logs, and traces share one interface, which keeps a small platform team from juggling three tools.
The cost of freedom is effort. Self-hosting means owning upgrades, storage, and backups, and the integration catalog is smaller than Datadog or New Relic. SigNoz suits teams that already use OpenTelemetry, want data portability, and prefer a lower cloud bill over a fully managed suite.
- OpenTelemetry-native design
- Self-hosted option is free
- Cloud starts at $49 per month plus usage
- Smaller integration catalog than Datadog
- Self-hosting needs operational effort
How we picked these
We compared official pricing pages, product documentation, and public reviews for observability platforms that cover logs, metrics, and traces in October 2026. We kept tools that are actively sold or maintained, that accept OpenTelemetry or a clear ingestion path, and that publish at least a starting price or a free tier. We left out tools that only cover one signal, such as uptime monitors, and tools whose pricing could not be traced to a vendor page or a recent published summary. Where pricing is usage-based, we show the starting unit rather than a total, since your total depends on your own volume.
How to compare pricing fairly
Do not compare headline prices across these tools, since they charge for different things. Datadog and Splunk charge per host, New Relic charges per GB and per user, Grafana Cloud charges per series and per GB, and Coralogix-style tools charge per GB with no host fee. The fair test is to run the same workload through a trial: same services, same log volume, same retention, and same number of dashboard users.
Start with a one-week trial on a non-production service, then check three numbers: data ingested per day, active series or hosts, and who actually needs a paid seat. Many teams overpay for seats that only view dashboards, so check which tools offer free viewer seats. Also set retention deliberately, since keeping logs for 90 days instead of 14 days can cost more than the base plan itself.
Questions to ask before signing
Ask how the vendor counts a host, a user, and a GB, and what happens when you exceed each limit. Ask whether logs, metrics, and traces share one bill or three, and whether alerting and dashboards are included at your tier. Ask about data export, since a tool that makes export hard can lock you in even when the pricing looks fair. A short trial with real data answers these questions better than a sales call.
Frequently asked questions
What is the cheapest Coralogix alternative?
For a tiny workload, New Relic free tier and Grafana Cloud free tier cost nothing to start, and SigNoz self-hosted costs only your own infrastructure. For a paid cloud plan, SigNoz Cloud at $49 per month plus usage and Grafana Cloud Pro at $19 per month plus usage are the lowest published starting points here. Your cheapest option still depends on data volume, since a high-volume team can pay more on a low base fee than on a per-host plan.
Is Datadog a direct replacement for Coralogix?
Datadog covers the same signals and adds a wider integration catalog, so it works as a direct replacement in function. The pricing model differs, since Datadog charges per host and per product while Coralogix charges mainly per GB. Teams moving from Coralogix should model host counts and log indexing separately, or the first Datadog bill may surprise them.
Can I self-host an observability platform?
Yes. SigNoz and Elastic offer self-hosted options, and Grafana offers open-source components you can run yourself. Self-hosting removes per-GB and per-seat charges but adds infrastructure, storage, upgrades, and on-call work for the monitoring system itself. It fits teams with platform skills and a reason to keep data in their own cloud account.
Do these tools support OpenTelemetry?
All nine in this list accept OpenTelemetry data or offer a clear OpenTelemetry path, though the native agent differs by vendor. Datadog, Dynatrace, and Splunk also offer their own agents, which can be simpler to start but harder to move later. If portability matters, send data in OpenTelemetry format from the start and keep vendor-specific agents to a minimum.
How much log data do I need to keep?
Keep hot logs for as long as you need to debug recent incidents, often 7 to 30 days, and archive older logs in cheaper storage if you need them for audits. Longer retention helps with slow-burning bugs and compliance checks, but it raises storage costs on every platform here. Set retention per data type rather than one rule for everything.
Will switching observability tools break my dashboards?
Dashboards rarely move cleanly between vendors, even with OpenTelemetry data, since query languages and dashboard formats differ. Plan to rebuild key dashboards and alerts in the new tool during a trial, and run both tools in parallel for a short period. That overlap costs more for a month, but it avoids losing visibility during the cutover.
Sources
- https://www.datadoghq.com/pricing/list/
- https://newrelic.com/pricing
- https://grafana.com/pricing/
- https://www.splunk.com/en_us/products/observability-cloud.html
- https://www.dynatrace.com/pricing/
- https://www.elastic.co/observability
- https://www.honeycomb.io/pricing
- https://www.sumologic.com/pricing/
- https://signoz.io/pricing/
See where you really rank - block by block
ProMapRanker scans Google Maps across a grid of your service area. Simple monthly plans from $19, white-label on every plan.
Start freeKeep reading
 zyte alternatives
Best Zyte Alternatives in 2026
These zyte alternatives cover managed scraping APIs, proxy networks and no code tools for lawful collection from your own or consented sources only in 2026.
Read → zerto alternatives
Best Zerto Alternatives in 2026
Compare the best zerto alternatives for disaster recovery and replication, with recovery targets, cloud options and honest trade-offs for teams in 2026.
Read → zerofox alternatives
Best ZeroFox Alternatives in 2026
We compared 9 zerofox alternatives for brand protection, phishing takedowns, dark web monitoring, and social impersonation, with clear coverage notes.
Read →