 ProMapRanker
Best Website Speed Test Tools in 2026


Free Core Web Vitals check · Pricing starts at: Free
Key takeaways
- PageSpeed Insights is the best free starting point, since it pairs lab scores with real-user Core Web Vitals data.
- WebPageTest gives the deepest diagnostic view, with real browsers, locations, and detailed waterfalls.
- GTmetrix suits non-developers who want a clear grade and readable report, though free tests are limited.
- SpeedCurve, DebugBear, and Calibre suit teams that need ongoing monitoring, alerts, and deploy comparisons.
- One test score is not a verdict, so test the same page more than once and compare lab and field data together.
Quick comparison
| Pick | Great for | Pricing starts at | Free tier | |
|---|---|---|---|---|
| Google PageSpeed Insights | Free Core Web Vitals check | Free | Yes | Visit |
 WebPageTest | Deep diagnostics | Free | Yes | Visit |
 GTmetrix | Readable reports | Free | Yes | Visit |
 Pingdom Tools | Quick location checks | Free | Yes | Visit |
 SpeedCurve | Ongoing monitoring | See website | Free trial | Visit |
 DebugBear | Monitoring and regressions | See website | Free trial | Visit |
 Calibre | Team performance budgets | See website | Free trial | Visit |
 Uptrends | Global free checks | Free | Yes | Visit |
The best website speed test tools
We compared tools on Core Web Vitals coverage, test locations, waterfall detail, monitoring, and free limits, using vendor pages and October 2026 listings. The list below moves from free one-off checks to paid monitoring.
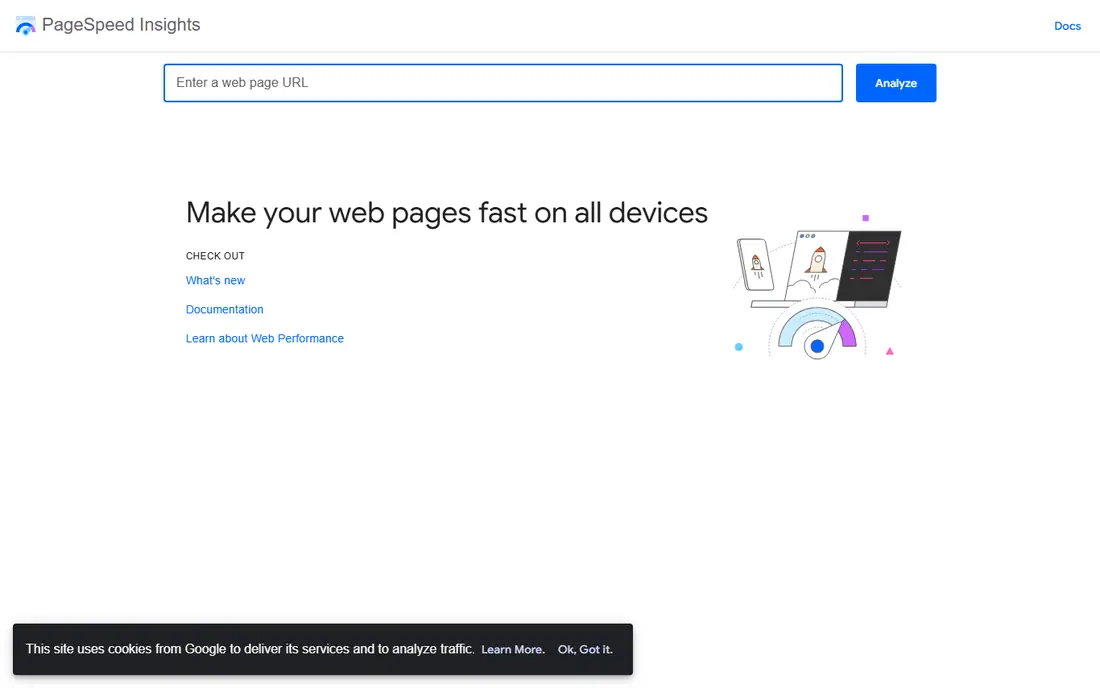
PageSpeed Insights is the first tool most site owners should run. Paste a URL and you get a Lighthouse lab score plus real-user Core Web Vitals data where available, for mobile and desktop. That pairing matters, because a lab score alone can hide what real visitors actually experience.
It is a one-off check, not a monitoring service. There are no alerts, no history tracking built in, and no multi-page dashboard. Use it to diagnose a page and to check a fix, then pair it with Search Console or a monitoring tool for ongoing tracking.
- Free
- Lab and real-user data together
- Clear fix suggestions from Lighthouse
- Single-page checks only
- No ongoing monitoring or alerts on its own

WebPageTest is the deepest free diagnostic tool here. It runs a page in a real browser, from many global locations, on throttled connections, and records a request waterfall, filmstrip, and timing breakdown. That detail shows exactly which request, image, or script slowed a page, not just that the page was slow.
The interface is more technical than GTmetrix or PageSpeed Insights, so beginners may need time to read a waterfall. Free runs are generous in recent listings, with paid plans adding monitoring and higher limits. For a stubborn speed problem, this is the tool to open second, after PageSpeed Insights.
- Real browsers and many locations
- Detailed waterfalls and filmstrips
- Scripted multi-step tests
- Interface suits developers more than beginners
- Advanced options take time to learn
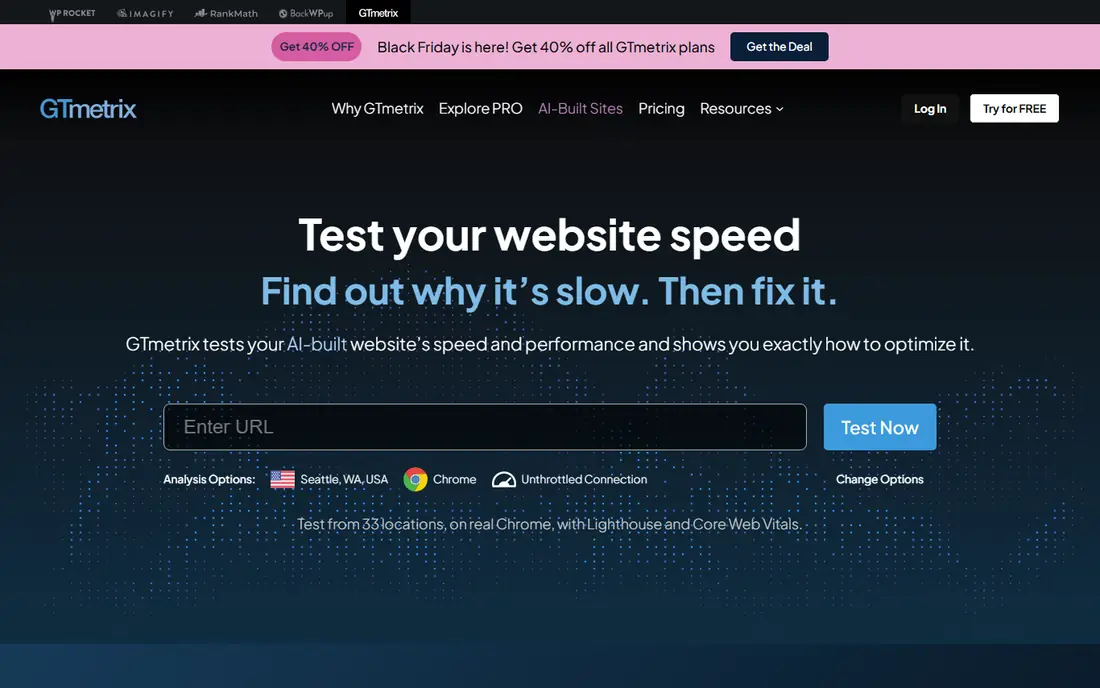
GTmetrix suits site owners who want a clear answer without reading a raw waterfall first. It gives grades, timing, and a readable list of issues, plus a waterfall for deeper checks. The report format makes it easy to share a result with a developer or client.
Free limits are the catch. Recent listings describe a small monthly test allowance, a short data retention window, and mobile testing behind paid plans. Paid plans start at a modest yearly figure in some listings, but check the current pricing page, since free terms have tightened over time.
- Clear grades and readable reports
- Waterfall and video views
- Useful history on paid plans
- Free tests are limited each month
- Mobile testing and longer history need paid plans
Pingdom Tools is useful for a fast sanity check from a different location. Enter a URL, pick a location, and get load time, page size, and request counts in a simple view. It is handy when you want to confirm whether a slow result was a local issue or a real site issue.
It is not a Core Web Vitals tool in the same way as PageSpeed Insights, and the free tool does not monitor a site over time. Pingdom also sells uptime and monitoring products separately, so do not confuse the free speed tool with a full monitoring plan.
- Fast one-off checks
- Several test locations
- Simple grade and timing view
- No Core Web Vitals focus in recent listings
- No monitoring on the free tool alone
SpeedCurve suits teams that need to know when a deploy makes a site slower, not just how fast it is today. It tracks pages over time, compares performance across deploys, and alerts you when a metric crosses a budget. That history turns speed from a one-off project into a routine check.
It is a paid monitoring product, and pricing depends on pages and checks, so we list See website here. Setup takes more care than a one-off test, since you must choose pages, budgets, and alert rules. For a business site with regular updates, that setup pays off fast.
- Continuous monitoring
- Deploy comparisons
- Alerts when metrics regress
- Paid product
- Needs setup across pages you care about
DebugBear combines lab testing with real-user monitoring and adds detailed reports when a metric gets worse. It is strong on interaction and responsiveness issues, which matter more as sites add heavy scripts. Page experiments let you test a change before you ship it to all visitors.
Full monitoring needs a paid plan, with pricing by pages and checks in recent listings. Smaller sites may find PageSpeed Insights plus WebPageTest enough, but teams that ship often will value the regression alerts and history that a one-off tool cannot give.
- Lab and real-user monitoring
- Detailed regression reports
- Page-level experiments
- Paid plans needed for full monitoring
- Smaller teams may not need its depth
Calibre is built for teams that treat speed as a shared budget, not a single score. Set budgets for key metrics, test pages on a schedule, and alert the team when a budget breaks. Dashboards make it easy for designers, developers, and managers to see the same numbers.
It is a paid tool, so a single-page site owner will get less value than a team with many pages and regular releases. If you need a quick free check, start with PageSpeed Insights. If you need a team to own speed over time, Calibre is a strong shortlist option.
- Performance budgets and alerts
- Team dashboards
- Scheduled tests across pages
- Paid product
- Best value for teams, less so for a single-page check
Uptrends free speed tool lets you test a page from many global locations and view a waterfall, which helps when visitors are spread across regions. A page that loads fast near your server may be slow elsewhere, and a global check catches that gap early.
The free tool is a one-off check, while uptime and full monitoring sit in paid Uptrends plans. Use the free tool for spot checks across locations, and use a monitoring tool from this list if you need alerts and history. For international sites, that global view is a useful extra check.
- Free speed tool with many locations
- Waterfall view
- Useful global comparison
- Full monitoring is a separate paid product
- Free tool is a one-off check
How we picked these
We compared vendor pages, free limits, Core Web Vitals coverage, and monitoring features as listed in October 2026, and we favored tools that are live and widely used for real site work. We did not claim hands-on testing. Where free limits or prices differed across listings, we described them in general terms or wrote See website, and we told readers to confirm current terms before buying.
How to test a site properly
Test the same page more than once
A single test can be skewed by a slow network moment or a cold cache. Run the same page at least twice, on mobile and desktop, and look at the pattern, not one outlier. If results swing widely, check hosting and third-party scripts before you chase a single score.
Read lab and field data together
Lab data shows what a test browser saw under set conditions. Field data shows what real visitors experienced. When they disagree, field data usually matters more for rankings and user experience, while lab data helps you find the fix. PageSpeed Insights gives you both, so use both panels.
Fix the biggest delay first
Start with the largest contentful paint delay, large images, render-blocking scripts, or slow server response, whichever the waterfall shows as biggest. Small tweaks to minor requests rarely move the headline score. Fix one large issue, retest, and then move to the next.
Set a budget and retest after changes
Pick a simple budget, such as a target for largest contentful paint and page weight, and retest after each deploy. Monitoring tools help here, but even a manual retest routine beats a single audit that no one revisits. Record the date and the change with each test, so you can link a gain or loss to real work.
Frequently asked questions
What are the best tools to test website speed for free?
PageSpeed Insights, WebPageTest, GTmetrix, and Pingdom Tools all offer free checks, with different strengths. PageSpeed Insights is best for Core Web Vitals, WebPageTest is best for deep diagnosis, and GTmetrix is best for readable reports. Use more than one, since each test measures under different conditions.
How fast should a website load?
Visitors expect a page to feel fast, with largest contentful paint under 2.5 seconds often cited as a good target. That target is a guide, not a guarantee of rankings or sales, since content and user intent matter too. Focus on the pages that drive enquiries and sales first.
Why do speed tools give different scores?
Tools use different locations, devices, network throttling, and test conditions, so scores will differ. A lab score, a real-user score, and a grade from another tool measure related but different things. Compare trends within one tool over time, rather than chasing identical scores across tools.
Do I need a paid speed monitoring tool?
Not always. A small site with few updates can rely on free checks and Search Console field data. A larger site with frequent deploys benefits from paid monitoring, alerts, and deploy comparisons, since a regression can sit unnoticed for weeks without them.
What is Core Web Vitals?
Core Web Vitals are Google measures of real user experience: largest contentful paint for loading, interaction to next paint for responsiveness, and cumulative layout shift for visual stability. PageSpeed Insights and Search Console both report them. Passing them helps user experience and can support search visibility, but they are not the only ranking factor.
Sources
See where you really rank - block by block
ProMapRanker scans Google Maps across a grid of your service area. Simple monthly plans from $19, white-label on every plan.
Start freeKeep reading
 zscaler alternatives
Best Zscaler Alternatives in 2026
Looking for zscaler alternatives? We compare 9 SASE and zero trust platforms on architecture, data protection, pricing, and fit for your network and team.
Read → zapier alternatives free
Best Zapier Alternatives Free in 2026
Nine automation tools for zapier alternatives free in 2026, all with genuinely free tiers, plus free plan limits, starting prices and upgrade paths explained.
Read → which platform is best for online reputation
Which Platform Is Best for Online Reputation in 2026
Wondering which platform is best for online reputation? We compare 8 review, listing, and response tools for small and multi-location businesses and agencies.
Read →