 ProMapRanker
Best System Monitoring Software in 2026

Key takeaways
- Datadog is the broadest observability platform for cloud teams, while Grafana Cloud suits teams that already use Prometheus and open source tools.
- New Relic offers a generous free tier for application monitoring, and Zabbix offers a free, self-hosted option for traditional infrastructure.
- PRTG and ManageEngine OpManager suit Windows-centered and mid-size IT teams that want network and server monitoring without a cloud-only model.
- Pricing units differ by host, user, gigabyte, sensor, and target, so model your bill at your real scale before choosing.
- The best monitoring tool is the one your team actually checks, with alerts tuned so real problems stand out from noise.
Quick comparison
| Pick | Great for | Pricing starts at | Free tier | |
|---|---|---|---|---|
 Datadog | full-stack observability | $15 per host per month | Yes | Visit |
 New Relic | application monitoring | See website | Yes | Visit |
 Grafana Cloud | open source dashboards | $19 per month | Yes | Visit |
 Zabbix | free self-hosted monitoring | Free | Yes | Visit |
 PRTG Network Monitor | network and server monitoring | See website | Yes | Visit |
 Nagios XI | classic infrastructure monitoring | See website | Free trial | Visit |
 Dynatrace | enterprise observability | $29 per host per month | Free trial | Visit |
 SolarWinds | network and hybrid infrastructure | See website | Free trial | Visit |
 ManageEngine OpManager | mid-size IT monitoring | See website | Free trial | Visit |
The best system monitoring software
We compared infrastructure monitoring, application performance, network monitoring, dashboards, and alerting for tools that IT and engineering teams use in 2026. The best system monitoring software depends on what you run: cloud services, traditional servers, networks, or a mix of all three. A tool that excels at application traces may be weak on network devices, and a network tool may lack modern application insights.
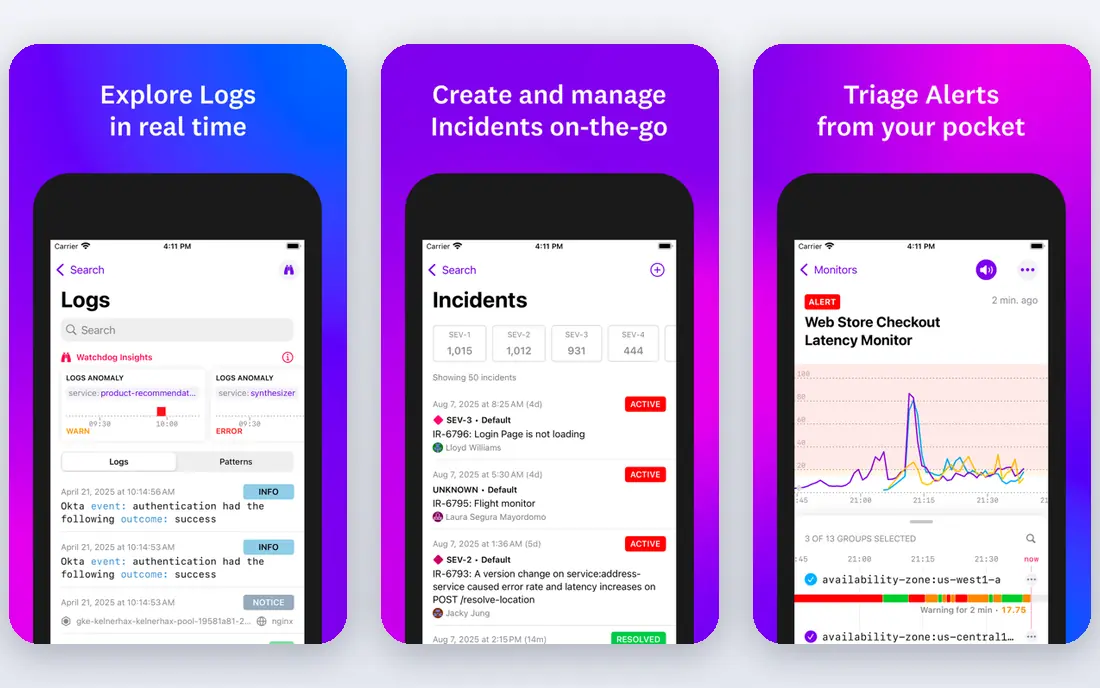
Datadog is our pick for cloud teams that want one platform for infrastructure, applications, logs, and user experience. Its integration library covers most cloud services and tools, and its dashboards make it easy to move from a host problem to the related application traces and logs. That correlation saves time during incidents, when teams need answers fast.
Cost is the main caution. Infrastructure Pro starts at $15 per host per month on annual billing, and application monitoring, logs, and other products add separate charges. Set usage alerts and retention rules early, and model the bill at several times your current scale before committing. The free tier covers up to five hosts with short retention, which is enough for a small test.
- Infrastructure, application, logs, and security in one platform
- Large integration library
- Strong dashboards and correlation
- Bills grow quickly as hosts, logs, and products grow
- Pricing has many moving parts
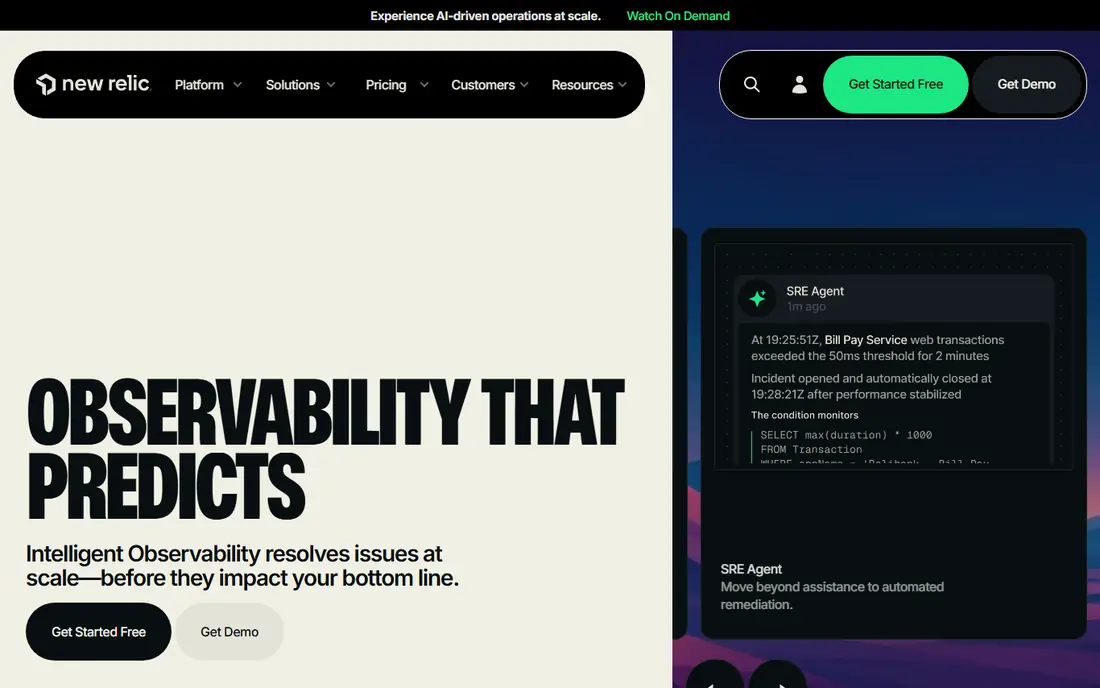
New Relic suits application teams that want to see how code performs in production, from slow transactions to errors and browser performance. Its free tier includes a monthly data allowance and a full user, which makes it a practical starting point for small teams and side projects. Infrastructure and log monitoring sit in the same platform, so teams can expand without switching tools.
Pricing combines user seats and data ingested beyond the free allowance, so a team with many users or heavy log volume should model the total carefully. New Relic is strongest when application performance is the priority, and less focused than PRTG or SolarWinds on traditional network device monitoring.
- Generous free tier with monthly data allowance
- Application, infrastructure, and logs in one platform
- Usage-based pricing
- Pricing combines per-user seats and data usage, so totals need modeling
- Enterprise features sit in higher tiers
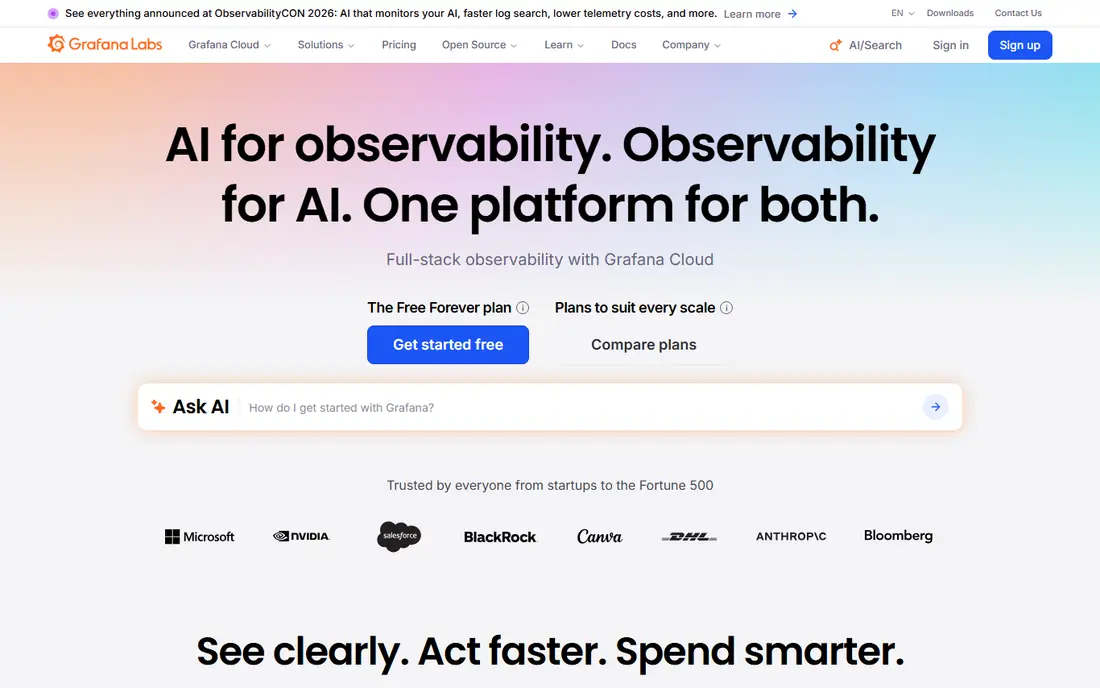
Grafana Cloud is the best choice for teams already invested in Prometheus, Loki, and the wider open source observability stack. Its dashboards are flexible and widely used, its alerting is strong, and the cloud service removes the need to run Grafana yourself. The free tier covers a useful amount of metrics, logs, and traces for small projects.
Paid pricing starts at $19 per month plus usage for active series, logs, and traces, so heavy workloads need careful budgeting. Teams without Prometheus experience may prefer Datadog or New Relic for a more guided setup, but teams that already use the open source stack will feel at home here.
- Excellent dashboards and alerting
- Works well with Prometheus and open source tools
- Free tier for small use
- Usage charges for metrics, logs, and traces add up
- Setup needs more technical skill than a turnkey tool
Zabbix is the free, self-hosted pick for traditional infrastructure monitoring. It handles servers, network devices, and services at scale, with templates and triggers that let IT teams define exactly what to watch and when to alert. Organizations that prefer to keep monitoring inside their own network, or that want to avoid per-host SaaS fees, often choose Zabbix.
The trade-off is effort. You must install, maintain, and secure Zabbix and its database, and the interface feels more technical than Datadog or Grafana Cloud. Teams with Linux and monitoring experience will get a powerful tool for no license cost, while teams without that expertise may prefer a hosted service.
- Free and open source
- Strong for servers, networks, and devices at scale
- Flexible templates and triggers
- You host, update, and secure it yourself
- Interface and setup take more effort than cloud tools
PRTG from Paessler is a practical pick for IT teams that want to monitor networks, servers, and devices without a complex observability stack. Its sensor model is easy to understand: each thing you monitor uses a sensor, and dashboards and alerts show status at a glance. The free tier includes 100 sensors, which covers a small office or a test environment well.
Sensor-based pricing needs planning, since a large network with many devices can need thousands of sensors. Count sensors before you buy, and check which edition fits your device count. For mid-size IT teams, especially those with Windows infrastructure, PRTG offers a good balance of depth and simplicity.
- Sensor-based monitoring for networks, servers, and devices
- Free tier with 100 sensors
- Clear dashboards and alerts
- Sensor counts grow quickly and raise cost
- Windows-centered history may suit some teams better than others
Nagios XI builds on the long-running Nagios Core project and adds a commercial interface, reporting, and configuration tools. IT teams with Nagios experience can monitor hosts, services, and network devices with a wide range of plugins, and the status views make it easy to see what is down at a glance. It suits sysadmin teams that already know the Nagios way of working.
Newer teams may find the setup and plugin management slower than Datadog or Grafana Cloud, and the interface is less modern. Nagios Core remains free and open source for teams that want the core engine without the commercial interface. Choose XI when you want Nagios familiarity plus commercial support and reporting.
- Long track record in infrastructure monitoring
- Plugin-based checks for many systems
- Clear host and service status views
- Plugin management and configuration take time
- Interface feels dated next to cloud platforms
Dynatrace is built for large enterprises with complex, distributed systems where finding the root cause matters more than watching a single server. It automatically discovers services and dependencies, maps how they connect, and uses that map to point to likely causes during incidents. That automation helps big teams that cannot manually track every service.
Pricing starts around $29 per host per month for infrastructure monitoring, with full-stack monitoring priced higher, and enterprise contracts often include additional products. Smaller teams will find Dynatrace more than they need, but large organizations with many services and strict reliability goals often find the root-cause features worth the cost.
- Automatic discovery and dependency mapping
- Strong root-cause analysis for large systems
- Security and business analytics add-ons
- Enterprise pricing and complexity
- Infrastructure pricing starts higher than Datadog
SolarWinds suits IT teams that need deep network monitoring alongside server and hybrid infrastructure coverage. Its network performance tools help diagnose bandwidth, device, and configuration issues, and its reporting supports capacity planning and compliance work. Large enterprises and managed service providers often use SolarWinds for networks that span on-premises and cloud resources.
Pricing varies by product and scale, and deployment takes more tuning than a simple SaaS signup. Teams that mainly monitor cloud applications will get better value from Datadog or New Relic, but teams whose core problem is network health will find SolarWinds a strong fit.
- Deep network diagnostics
- Hybrid infrastructure monitoring
- Strong reporting for IT teams
- Pricing is quote-influenced and can be high
- Deployment and tuning take time
ManageEngine OpManager is a solid mid-size IT pick that covers networks, servers, virtual machines, and devices in one console. It includes workflow automation for routine tasks, such as restarting a service or alerting a team, which helps small IT departments handle more with fewer people. Both on-premises and cloud deployment options are available.
Pricing depends on the number of devices and the edition you choose, so count devices and confirm the edition before budgeting. Small teams with only a handful of servers may find PRTG or Zabbix simpler, but mid-size IT teams that want a single console for a mixed environment will find OpManager practical.
- Network, server, and device monitoring in one console
- Workflow automation for common IT tasks
- On-premises and cloud options
- Pricing depends on device count and edition
- Interface can feel busy for small teams
How we picked these
We compared official feature pages, pricing pages, and documentation for monitoring tools that are actively maintained in October 2026. We favored tools that cover a clear monitoring job, from application performance to network devices, and we left out status-page-only tools and single-purpose uptime checkers. Where pricing depends on hosts, users, data, sensors, or devices, we reported the starting unit as published and wrote See website where the figure was not clearly verifiable.
How to choose the right monitoring tool
Start with what you need to watch. Application teams should start with New Relic or Datadog, network teams with PRTG, SolarWinds, or OpManager, and infrastructure teams with Zabbix, Nagios XI, or Grafana Cloud. Then check deployment: cloud tools save setup time, self-hosted tools save license cost but add maintenance, and hybrid options sit in between.
Next, tune alerts before you scale. Start with a small set of alerts for downtime, high error rates, and disk or memory pressure, and review noisy alerts weekly. A monitoring tool that pages your team for every minor event will soon be ignored, while a well-tuned tool earns trust during real incidents. Finally, test the incident workflow, from alert to dashboard to fix, during a trial, since that workflow matters more than any single chart.
Frequently asked questions
What is the best monitoring tool for a small business?
For a small business, Grafana Cloud and New Relic offer useful free tiers, while PRTG covers small networks with its free sensor tier. Zabbix is also a strong free option if you have someone comfortable hosting and maintaining it.
What is the best system monitoring software for PC and servers?
Datadog and New Relic cover servers and applications in the cloud, while PRTG, OpManager, and Zabbix cover servers and network devices in traditional IT environments. Choose based on whether your systems live mainly in the cloud or on premises.
What is the best tool for application monitoring?
New Relic and Datadog are the leading choices for application monitoring, with traces, error tracking, and performance dashboards. Dynatrace is also strong for large enterprises that need automatic root-cause analysis across many services.
What is the best free system monitoring software?
Zabbix is the best fully free, self-hosted option, and Grafana Cloud, New Relic, and PRTG all offer free tiers for smaller use. Free tiers work well for learning and small environments, but larger systems usually need a paid plan.
How much does system monitoring software cost?
Costs range from free for Zabbix and the free tiers of cloud tools, to per-host, per-user, per-gigabyte, or per-sensor pricing on paid plans. The total depends on hosts, devices, data volume, and users, so model your own scale before choosing.
Sources
See where you really rank - block by block
ProMapRanker scans Google Maps across a grid of your service area. Simple monthly plans from $19, white-label on every plan.
Start freeKeep reading
 who is the best seo company
Who Is the Best SEO Company in 2026
Compare who is the best SEO company in the USA, from full service agencies to SEO only specialists, with fit and service notes Compare features, pricing,.
Read → top bi software
Top BI Software in 2026: 9 Tools Compared
Compare the top BI software in 2026, with dashboards, reporting, data links, sharing, pricing and free plans for small teams, analysts and large companies.
Read → spyfu alternatives
SpyFu Alternatives in 2026: 9 Tools Compared
Compare the best spyfu alternatives in 2026, from Semrush and Ahrefs to SE Ranking, Moz, and Mangools, for competitor and keyword research work. for teams
Read →