 ProMapRanker
Top BI Software in 2026: 9 Tools Compared


Microsoft-first companies · Pricing starts at: $14 per user per month
Key takeaways
- The best BI tool depends on your data stack: Microsoft, Google, warehouse-first or spreadsheet-first teams will choose differently.
- Viewer pricing matters more than creator pricing, since most staff only read dashboards.
- A free tool can be enough for department reporting, but governed metrics need a tool with a shared definition layer.
- Trial with your own data and your own hardest question, not a sample dashboard, before you commit.
Quick comparison
| Pick | Great for | Pricing starts at | Free tier | |
|---|---|---|---|---|
| Microsoft Power BI | Microsoft-first companies | $14 per user per month | Yes | Visit |
 Tableau | Dashboard-heavy analytics teams | $15 per user per month | No | Visit |
 Looker Studio | Free Google-based reporting | Free | Yes | Visit |
 Looker | Governed metrics for large Google Cloud teams | See website | No | Visit |
 ThoughtSpot | Search-driven self-serve analytics | $25 per user per month | Free trial | Visit |
 Qlik Sense | Associative exploration for analysts | See website | Free trial | Visit |
 Zoho Analytics | Non-technical small teams | $24 per month | Free trial | Visit |
 Metabase | SQL-savvy teams that want open source | Free | Yes | Visit |
 Sigma | Spreadsheet-style work on warehouse data | See website | Free trial | Visit |
The best bi software
We compared BI tools that turn business data into dashboards and reports, and favored tools with clear pricing, broad data links and sharing options for real teams.
Power BI is our pick for most companies that already use Microsoft 365, Excel and Teams. Its Pro price, listed near $14 per user per month in recent comparisons, is low next to Tableau and Looker, and its Desktop app is free for building reports. Its links to Excel, SharePoint and Azure data make it easy to start from data teams already have.
The catch is sharing. Free Desktop reports cannot be shared securely at scale without Pro licenses or Premium capacity, so viewer costs must be counted. Data modeling with DAX also takes learning, though that depth is what makes Power BI strong for complex reports. For a Microsoft shop, it is still the best value in this list.
- Low per-user price for Pro
- Strong Microsoft 365 and Excel links
- Free Desktop app for building reports
- Sharing needs Pro or Premium capacity
- Learning curve for data modeling
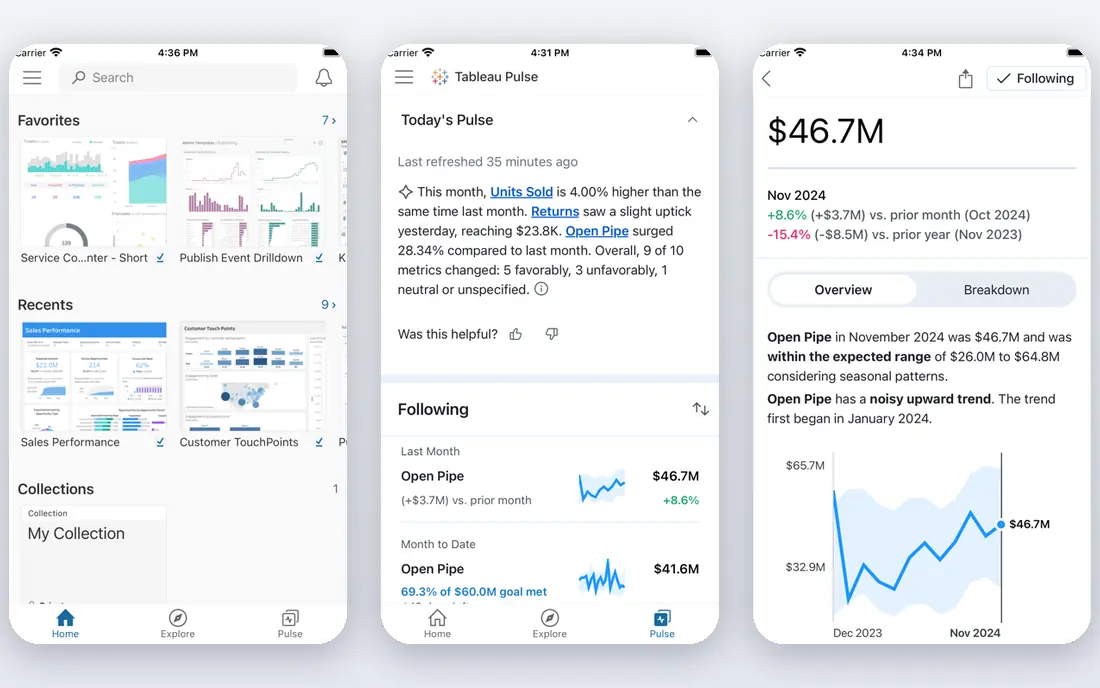
Tableau suits analytics teams that spend most time exploring data and building polished dashboards. Its visual tools let analysts ask new questions quickly, and its dashboard design is more flexible than many rivals. For a team that values exploration over simple scheduled reports, Tableau remains a top choice.
Pricing needs care. Viewer licenses start near $15 per user per month in recent comparisons, while Creator licenses cost much more, near $75 per user per month. A team with many creators can face a large bill, so count creators, explorers and viewers separately before comparing Tableau with Power BI.
- Strong visual exploration
- Flexible dashboard design
- Large analyst community
- Creator price is much higher than viewer price
- Total cost rises fast with team size
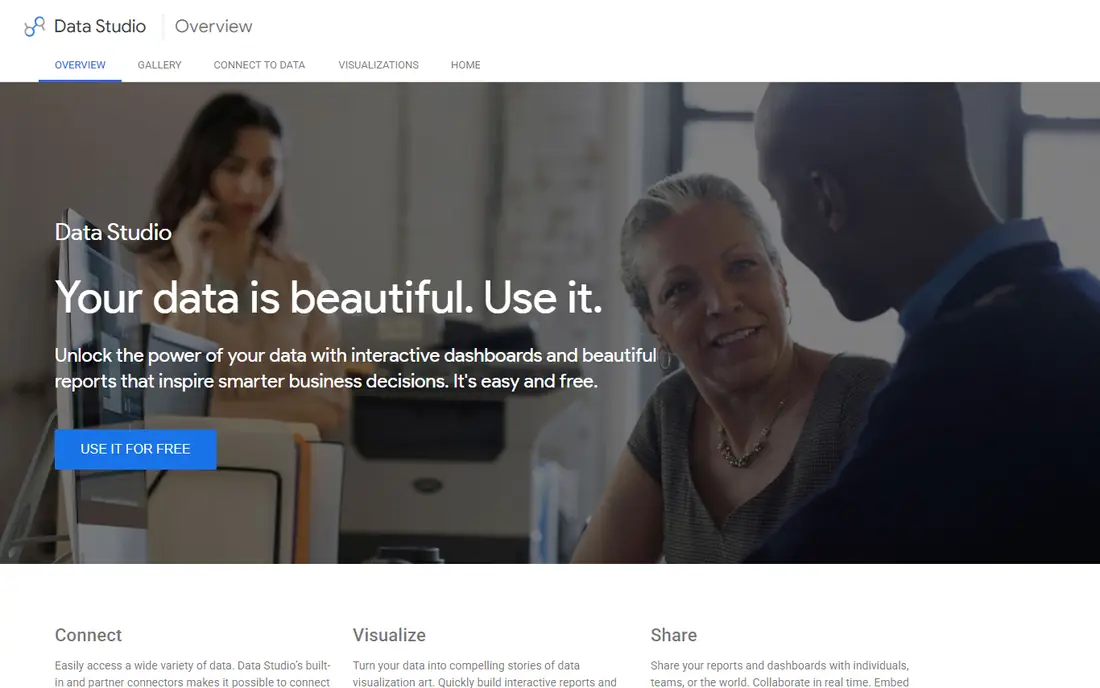
Looker Studio is the best free BI tool for small teams and marketing reporting. It is free for standard use, it shares as easily as a Google Doc, and it links well to Google Analytics, Google Ads, Sheets and BigQuery. For a department that needs a few live dashboards without a BI budget, it is hard to beat.
The limit is governance. Without a shared metric layer, two reports can define revenue or conversions differently, which causes arguments about numbers. Larger teams should use Looker or another governed tool for core company metrics, and keep Looker Studio for fast department reports where that risk is lower.
- Free for standard use
- Easy sharing like a Google Doc
- Strong Google Analytics and Ads links
- Metric definitions can drift across reports
- Less governance than Looker or Power BI
Looker, now part of Google Cloud, suits large teams that need one trusted definition for each metric. Its LookML modeling layer lets analysts define revenue, churn or margin once, then reuse that definition in every dashboard. That control is why large Google Cloud and BigQuery teams choose it, despite its cost.
The downside is price and skill. Recent comparisons put Looker costs in the tens of thousands per year for mid-size teams, and it needs staff who can model data and manage code. Small teams will find Looker Studio or Power BI faster and cheaper. For a large company where metric trust matters, Looker is worth the investment.
- LookML gives one shared definition for metrics
- Strong BigQuery fit
- Version control for models
- High total cost
- Needs data modeling skill and implementation time
ThoughtSpot suits business users who want to ask questions in plain words and get a chart, without waiting for an analyst. A sales manager can search for revenue by region and month and get a live answer, which reduces ad hoc requests. Its starting price near $25 per user per month in recent comparisons is clear for small teams.
The catch is data preparation. ThoughtSpot works best when data is already modeled and clean, so a messy warehouse will still need analyst work first. It also suits teams that value self-serve search over highly designed dashboards. For a company with many non-technical users, that trade is often worth it.
- Search-like questions for business users
- AI-assisted answers
- Strong self-serve for non-analysts
- Needs clean modeled data to work well
- Total cost rises with team size
Qlik Sense suits analysts who like to explore data by clicking and filtering, rather than only reading fixed dashboards. Its associative engine highlights related values as you select, which can reveal patterns that a static report hides. That style suits teams that investigate data, not only report it.
Pricing is quote-based for many plans, so get a written quote at your user count. Qlik also has a learning curve, especially for dashboard design and data loading. For an exploration-heavy team that already knows Qlik, it remains a strong alternative to Tableau and Power BI.
- Associative engine shows related data as you filter
- Strong for exploration
- Good data preparation tools
- Pricing is not clearly published
- Learning curve for new users
Zoho Analytics is our pick for small, non-technical teams that want dashboards without hiring an analyst. Its starting price near $24 per month for two users is low, its interface is friendly, and its AI assistant lets users ask questions in plain words. It also links to Zoho apps and many other data sources.
The limit is scale. A large enterprise with complex data modeling, governance and hundreds of users will likely need Power BI, Tableau or Looker instead. For a small business that needs sales, marketing and finance dashboards fast, Zoho Analytics is one of the easiest tools to adopt.
- Easy for non-technical users
- AI assistant for plain-language questions
- Low starting price for two users
- Less depth for large enterprise BI
- Advanced modeling is thinner than Power BI or Looker
Metabase suits technical teams that like open source and SQL. Its self-hosted version is free, which makes it cheap to start, and its question builder lets non-SQL users build simple charts while SQL users can write full queries. Its cloud plan, starting near $85 per month for small teams in recent comparisons, removes server work.
Self-hosting is not free in effort: updates, backups and security are your job. Metabase also lacks the deep governance and dashboard design of Tableau or Looker. For a startup or a technical team that wants a fast, low-cost BI tool, it is still an excellent choice.
- Free self-hosted option
- Simple for SQL users
- Cloud plan for teams that do not want servers
- Self-hosting needs server care
- Governance and design options are thinner than enterprise tools
Sigma suits teams that love spreadsheets but need to work on live warehouse data. Its interface feels like a spreadsheet, with formulas and pivots, but it queries Snowflake, BigQuery and other warehouses directly, without copying data into a separate BI store. That live link helps teams that already think in sheets.
Pricing is custom, so you will need a quote, and warehouse compute costs are separate. Sigma is less suited to teams without a warehouse, since its strength is warehouse-first work. For a data team that wants Excel-style freedom on governed warehouse data, Sigma is a strong modern option.
- Spreadsheet-like interface on live warehouse data
- No data extracts needed
- Familiar for Excel users
- Pricing is custom
- Warehouse compute costs add to the bill
How we picked these
We compared official pricing and feature pages plus recent 2026 BI comparisons, and kept only tools still sold as BI platforms. We favored dashboard building, data links, sharing and pricing clarity, and we avoided pure data visualization libraries and pure spreadsheet apps. Where pricing was custom, we wrote See website rather than guessing.
What to check before you buy
Start with your data, not a demo dashboard. Connect your own sales, finance or marketing data, then ask your hardest real question in each trial tool. Check how long it takes to build the answer, whether the number matches your trusted source, and whether a non-analyst can repeat the same question. That test reveals data modeling, speed and ease far better than sample data.
Next, price the whole team. Count creators who build reports, explorers who edit them, and viewers who only read them, since each role can cost differently. Add data warehouse, Premium capacity or compute costs, since those can exceed license fees. Also check refresh limits, row limits and export options, since a tool that cannot refresh your data on time is not useful.
Finally, check governance. Ask how metrics are defined, who can change a definition, and whether dashboards can be versioned. A tool that lets every team define revenue differently will create more arguments than insights. For core company numbers, choose a tool with a shared metric layer, even if department reports stay in a simpler tool.
Frequently asked questions
What is the best BI software for small business?
Power BI, Looker Studio and Zoho Analytics suit small businesses, depending on your stack. Looker Studio is free for Google-based reporting, Zoho Analytics is easiest for non-technical teams, and Power BI is best value for Microsoft shops. Start with a free or low-cost plan and upgrade only when you need governance.
What is the best business analytics software for large companies?
Tableau, Power BI and Looker suit large companies, with Looker leading for governed metrics on Google Cloud and Power BI leading for Microsoft shops. Tableau leads for visual exploration. Compare total cost at your real user count, including viewer licenses and data costs, not only creator prices.
Is there a free BI tool?
Looker Studio is free for standard use, and Metabase offers a free self-hosted version. Power BI Desktop is also free for building reports, though sharing needs a paid license. Free tools suit department reporting, while company-wide metrics often need a paid governed tool.
What is the best BI platform for Google Analytics?
Looker Studio is the simplest choice for Google Analytics reporting, since it links directly and shares easily. Looker suits larger Google Cloud teams that need governed metrics across many sources. For a marketing team that only needs Analytics and Ads dashboards, Looker Studio is usually enough.
How much does BI software cost?
Small team costs range from free to about $25 per user per month, while enterprise costs rise with creators, viewers and data capacity. Power BI Pro starts near $14 per user per month, Tableau viewers start near $15, and Looker can cost tens of thousands per year. Always price your full team, not only one analyst.
What is the best reporting tool for business intelligence?
The best reporting tool depends on who builds reports and who reads them. Power BI suits Microsoft teams, Tableau suits analyst-led teams, and Looker Studio suits fast Google reporting. For search-driven reporting by business users, ThoughtSpot is a strong option. Trial each one with your own data.
Sources
See where you really rank - block by block
ProMapRanker scans Google Maps across a grid of your service area. Simple monthly plans from $19, white-label on every plan.
Start freeKeep reading
 who is the best seo company
Who Is the Best SEO Company in 2026
Compare who is the best SEO company in the USA, from full service agencies to SEO only specialists, with fit and service notes Compare features, pricing,.
Read → spyfu alternatives
SpyFu Alternatives in 2026: 9 Tools Compared
Compare the best spyfu alternatives in 2026, from Semrush and Ahrefs to SE Ranking, Moz, and Mangools, for competitor and keyword research work. for teams
Read → doodle alternatives
Doodle Alternatives in 2026: 9 Tools Compared
Find the best Doodle alternatives for group polls, booking links, and team scheduling, with free plans, starting prices, and the use each tool suits best.
Read →