 ProMapRanker
Best Sysadmin Tools: 9 Tools Compared

Key takeaways
- The best sysadmin tool depends on your pricing unit, since per device, per technician, and per sensor pricing give very different bills for the same fleet.
- Monitoring alone is not enough for most teams, so we favored tools that also cover patching, automation, or remote access.
- Zabbix and PRTG suit teams that want strong monitoring without a large per device bill, while NinjaOne and Atera suit teams that want endpoint management in one console.
- Free plans and trials are worth using for a real pilot, because console speed and alert noise only show up on your own devices.
- Plan for alert tuning from day one, since a tool that pages you for every small event will soon be ignored.
Quick comparison
| Pick | Great for | Pricing starts at | Free tier | |
|---|---|---|---|---|
 NinjaOne | Endpoint management at scale | See website | Free trial | Visit |
 Atera | Per technician pricing | $129 per technician per month | Free trial | Visit |
 ManageEngine OpManager | Network monitoring | See website | Free trial | Visit |
 PRTG Network Monitor | Sensor based network monitoring | $200 per month | Yes | Visit |
 Zabbix | Free open source monitoring | Free | Yes | Visit |
 Datadog | Cloud and application monitoring | See website | Free trial | Visit |
 Site24x7 | Website and infrastructure monitoring | $9 per month | Free trial | Visit |
 Pulseway | Mobile first IT management | See website | Free trial | Visit |
 Lansweeper | IT asset discovery and inventory | See website | Free trial | Visit |
The best sysadmin tools
System administration covers a wide job, from watching a switch to patching a thousand laptops. The tools below are not identical, and that is the point. Some watch networks, some manage endpoints, and some watch cloud services and applications. Start from the work your team does most, then pick the console you will actually open every day.
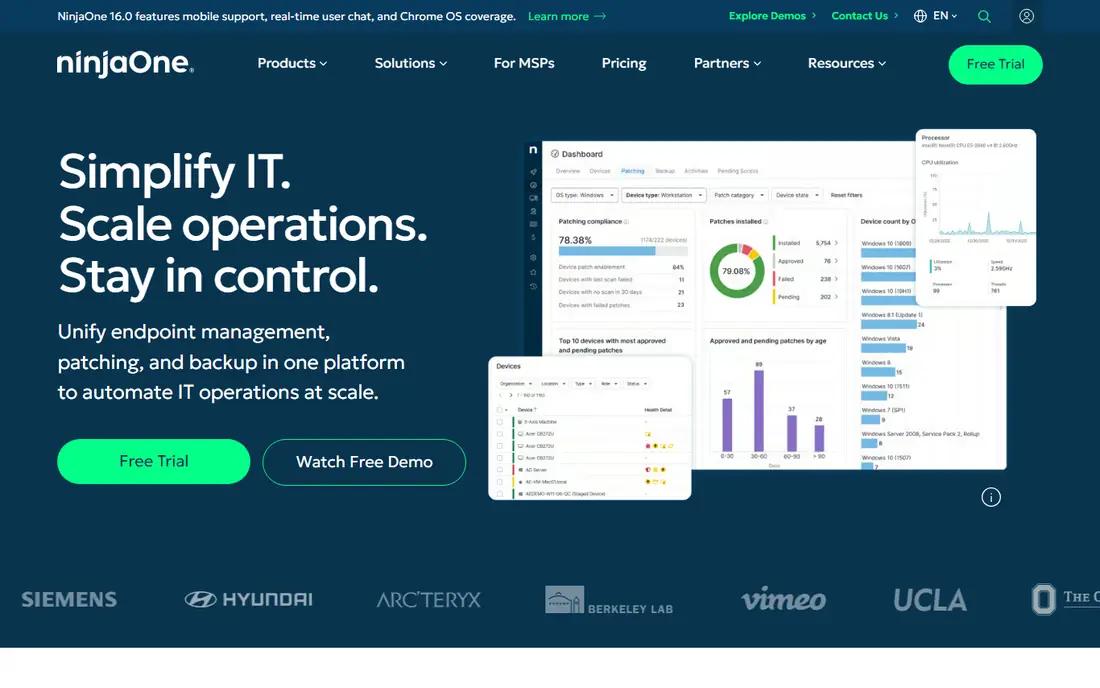
NinjaOne is our pick for most endpoint teams because the console is quick and the core work is in one place. Patching for operating systems and third party apps, scripting, monitoring, and remote access sit together, so a technician can move from an alert to a fix without switching tools. Onboarding and support are a real strength for small teams that cannot afford a long setup project.
The pricing model is the main caution. Per device billing is simple at small scale, and it grows steadily as you add machines. Backup, mobile device management, and vulnerability tools are separate modules on many plans, so price the full stack, not just the base console. If your fleet is modest and you value speed, NinjaOne is an easy recommendation.
- Fast modern console
- Strong patching and automation
- Free onboarding and support on many plans
- Per device costs climb on large fleets
- Backup and some modules cost extra
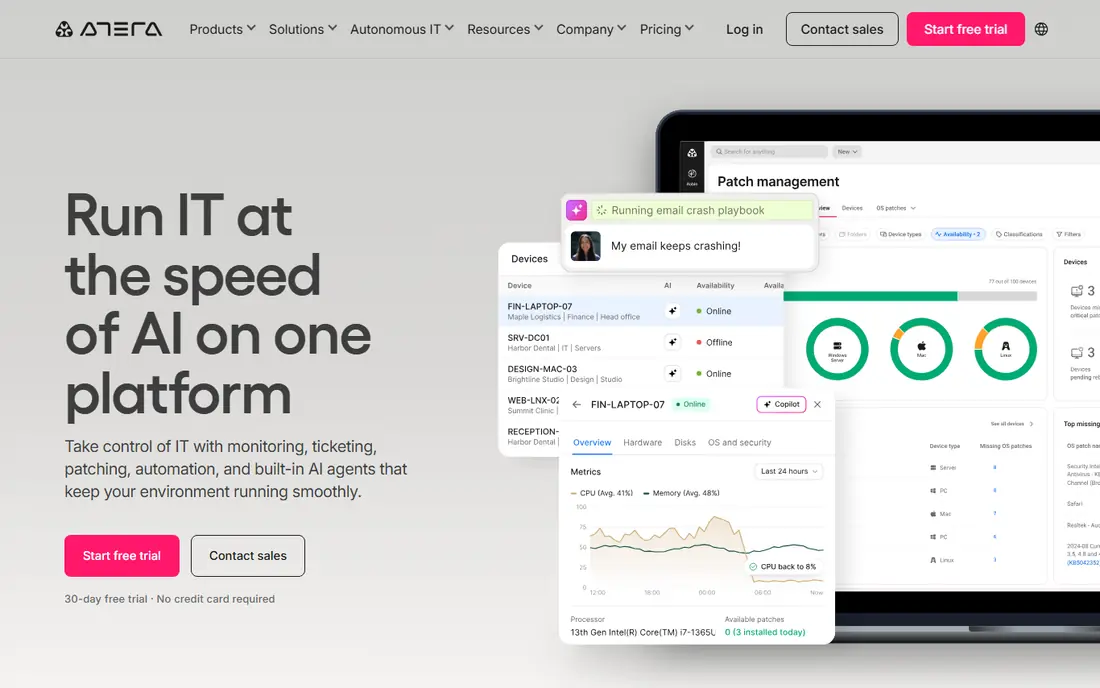
Atera flips the pricing question. Instead of paying per device, you pay per technician, and endpoints are unlimited on paid plans. That model suits managed service providers and internal teams with many devices and a small bench, because adding machines does not raise the bill in the same way. Remote access, monitoring, patching, and ticketing are built in, which keeps daily work in one window.
The trade-off is depth. Atera covers a lot, but a specialist monitoring or security tool may go deeper in one area. We would use Atera when headcount is stable and device count is growing, and when you want one bill that is easy to forecast. Trial it with your real ticket flow, since ticketing habits decide whether a team sticks with a tool.
- Unlimited endpoints on paid plans
- Remote access and ticketing included
- Simple pricing for growing teams
- Depth varies by module
- Larger teams may need add ons for advanced needs
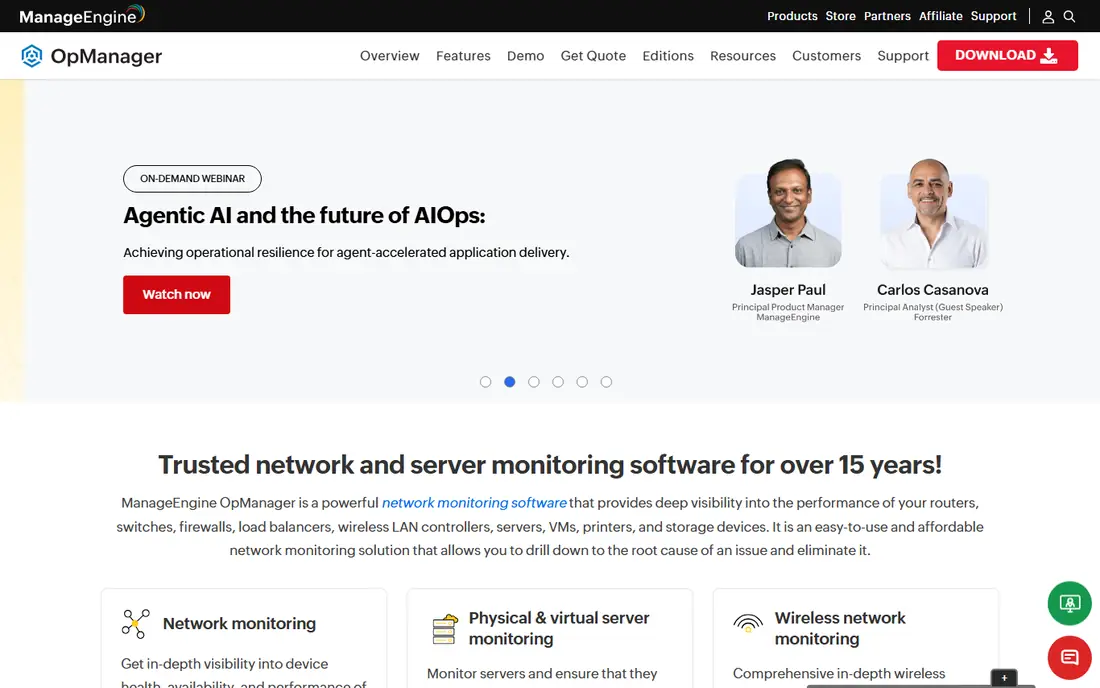
OpManager is built for network operations teams that need to see routers, switches, servers, and links in one view. It polls devices, tracks performance, maps the network, and raises alerts when a link or device fails. For teams that manage offices, branches, and data center gear, that network-first view is more useful than an endpoint-only console.
Setup is the honest catch. Discovery and alert tuning take work, especially on a large or mixed network, and the interface rewards teams that invest in maps and thresholds. We would pick OpManager when network health is the main job, and when you already use, or plan to use, other ManageEngine tools for service desk or endpoint work.
- Broad network device coverage
- Maps and fault alerts
- Works with other ManageEngine tools
- Setup can take time on large networks
- Pricing requires a quote for many tiers
PRTG thinks in sensors, where one sensor measures one thing, such as traffic on a port, ping to a gateway, or CPU on a server. That model is easy to grasp, and auto discovery helps small teams get running in an afternoon. The free edition, with 100 sensors, is enough for a home lab or a very small office, and it is a fair way to learn the tool.
Sensor math is also the trap. A single switch with many ports can use many sensors, so a network that looks small on paper can reach a paid tier quickly. We would count sensors for your real devices before you buy, and set a sensor budget per device type. PRTG suits Windows-based teams that want SNMP, flow, and map views without building a monitoring stack from parts.
- Free edition with 100 sensors
- Large sensor library
- Auto discovery and clear maps
- Sensor counts grow fast
- Windows hosted design suits some teams more than others
Zabbix is the strongest free option here for teams with monitoring skill in house. The open source core covers servers, networks, cloud resources, and applications, with templates, triggers, and alerting that can grow to very large estates. There is no per device license for the core software, which makes it attractive for schools, nonprofits, and budget-conscious IT departments.
The cost shows up as time, not license fees. You need someone who can install, tune, and maintain it, and the interface is more technical than a polished commercial console. We would pick Zabbix when you have that skill, or when you want full control over data and hosting. Paid support is available from the vendor if you need a safety net.
- Free open source core
- Strong templates and alerting
- Scales to large environments
- Setup and tuning need skill
- Interface feels technical for new admins
Datadog suits teams that run cloud services and need to see infrastructure, applications, logs, and user experience together. Its dashboards and integrations cover major cloud platforms and common services, which helps when a slow page could be a server, a database, or a third party call. For DevOps and platform teams, that joined-up view saves a lot of guesswork.
Pricing is the caution. Usage based billing across hosts, logs, and custom metrics can grow faster than expected, so set budgets and retention limits early. Small teams with only a few servers may find Datadog more than they need. We would pick it when application performance is a business metric, not just an IT metric.
- Broad cloud and application coverage
- Strong dashboards and alerting
- Many integrations
- Usage based pricing can be hard to forecast
- Depth can overwhelm small teams
Site24x7 is a practical pick for small and mid-size teams that need to know, quickly, whether a site or server is up and fast. It covers websites, servers, networks, and cloud resources from many locations, and the starting price is low compared with larger observability platforms. Alerts and status pages help small teams look professional when something breaks.
The trade-off is depth. Some advanced application and log features require higher tiers, and very large estates may prefer a specialist tool. We would use Site24x7 as a first monitoring tool, or as a second check alongside an endpoint tool, when uptime and response time are the main worries.
- Low starting price
- Website, server, and network checks
- Global monitoring locations
- Depth varies by plan
- Advanced features sit on higher tiers
Pulseway is built around the phone in your pocket. Alerts arrive on mobile, and you can restart services, run scripts, and open remote sessions from the app, which suits admins who are often away from a desk. Patching, monitoring, and remote control are included in the broader platform, so on-call work does not wait until you reach a laptop.
The mobile focus is also a limit for teams that live in a desktop console all day, since some workflows feel better on a larger screen. Pricing varies by module, so confirm what your plan includes before you compare it with a per device rival. We would pick Pulseway for small teams and solo admins who need reliable on-call control.
- Strong mobile app for alerts and actions
- Remote access and patching
- Good for on call work
- Pricing varies by modules
- Desktop console is less central for some teams
Lansweeper answers a different question from the rest of this list: what do we actually own. It scans networks, finds devices, and builds a detailed inventory of hardware, software, and users, with reports that help audits, license checks, and lifecycle planning. For teams that have inherited an unclear estate, that clarity alone can justify the tool.
It is not a full endpoint management or monitoring replacement. You will still need patching and alerting tools for daily operations, and Lansweeper works best as the inventory layer under them. We would pick it when asset accuracy, audit readiness, and software tracking are the gaps, and pair it with NinjaOne, Atera, or a monitoring tool for action.
- Deep asset discovery
- Detailed hardware and software inventory
- Useful reports for audits
- More inventory than remediation
- Monitoring and patching need other tools
How we picked these
We compared official feature pages, pricing pages, and current roundups for tools that are live in October 2026, and we kept only tools that fit real sysadmin work: monitoring, endpoint management, asset discovery, or cloud observability. We favored tools with a clear trial or free tier, a current product page, and a distinct strength, rather than listing every tool with a similar feature set. We did not claim hands-on testing, and we treated vendor pricing as a starting point to confirm on a quote, since many of these tools price by fleet size or modules.
How to choose for your team
Count your units before you compare prices. If you have 80 laptops and two technicians, per technician pricing may beat per device pricing, while a 2,000 device fleet with many technicians may favor the opposite. For networks, count sensors or monitored elements, not just devices, since switches and servers use many checks each.
Next, run a pilot on a slice of your real estate. Watch alert volume for two weeks, and tune thresholds until only actionable alerts reach on-call staff. Finally, check integrations with your ticketing, identity, and backup tools, because a monitoring tool that cannot create a ticket or respect your access rules will add manual work.
Frequently asked questions
What is the best sysadmin tool for a small business?
For a small team, NinjaOne, Atera, or Site24x7 are strong starting points, depending on the job. NinjaOne suits endpoint management, Atera suits per technician billing, and Site24x7 suits uptime checks. Start with a trial on your own devices, and pick the console your team opens without being asked.
Is Zabbix really free?
The Zabbix core software is open source and free to download and use, with no per device license for the core. You still pay for hosting, time, and any paid support or services you choose. That trade makes sense when you have in-house skill, and less sense when you need a fully managed console.
How is PRTG pricing calculated?
PRTG prices by sensor tier, where one sensor measures one metric on one device. The free edition includes 100 sensors, and paid tiers start higher as sensor counts grow. Count sensors for switches, servers, and applications before you buy, since port-heavy devices use sensors quickly.
Do I need both monitoring and endpoint management?
Many teams do. Monitoring tells you something is wrong, while endpoint management lets you patch, script, and remote in to fix it. Some tools cover both, and others pair well together, such as Lansweeper for inventory plus an endpoint tool for action.
What should I check in a free trial?
Check console speed, alert noise, patch success, remote session quality, and reporting. Run the trial on real devices, not just a demo estate, and include a weekend on-call shift if you can. A tool that looks good in a demo can still flood you with alerts on a real network.
Can these tools replace a help desk?
No, not on their own. Several include ticketing, but a full service desk needs request handling, knowledge, and service level tracking that these tools only partly cover. Treat ticketing in an endpoint tool as a bonus, and keep a dedicated service desk when ticket volume or service promises grow.
Sources
See where you really rank - block by block
ProMapRanker scans Google Maps across a grid of your service area. Simple monthly plans from $19, white-label on every plan.
Start freeKeep reading
 zscaler alternatives
Best Zscaler Alternatives in 2026
Looking for zscaler alternatives? We compare 9 SASE and zero trust platforms on architecture, data protection, pricing, and fit for your network and team.
Read → zapier alternatives free
Best Zapier Alternatives Free in 2026
Nine automation tools for zapier alternatives free in 2026, all with genuinely free tiers, plus free plan limits, starting prices and upgrade paths explained.
Read → which platform is best for online reputation
Which Platform Is Best for Online Reputation in 2026
Wondering which platform is best for online reputation? We compare 8 review, listing, and response tools for small and multi-location businesses and agencies.
Read →