 ProMapRanker
Best Statistical Analysis Software in 2026

Key takeaways
- R is the most flexible free choice for analysts who code, while JASP and jamovi are the best free choices for point-and-click work.
- IBM SPSS Statistics remains the familiar standard for survey and social science work, but it costs far more than free rivals.
- Stata leads for reproducible econometrics and panel data, while SAS leads for large enterprise and regulated analysis.
- Pick by your field, your data size, and whether you code, not by a general ranking alone.
Quick comparison
| Pick | Great for | Pricing starts at | Free tier | |
|---|---|---|---|---|
 R | Free code-based analysis | Free | Yes | Visit |
 IBM SPSS Statistics | Survey and social science | $99 per month | No | Visit |
 Stata | Econometrics and panel data | See website | No | Visit |
 SAS | Enterprise and regulated analysis | See website | No | Visit |
 JASP | Free Bayesian and classical tests | Free | Yes | Visit |
 jamovi | Free easy teaching and analysis | Free | Yes | Visit |
 Minitab | Quality and Six Sigma work | See website | Free trial | Visit |
 GraphPad Prism | Lab science graphing | See website | Free trial | Visit |
 PSPP | Free SPSS-like analysis | Free | Yes | Visit |
The best statistical analysis software
Statistical software turns raw data into tests, models, and charts you can defend. The right choice depends on whether you point and click or write code, whether you need Bayesian methods, and whether your field expects a specific tool. These nine options cover that full range, from free teaching tools to enterprise platforms.
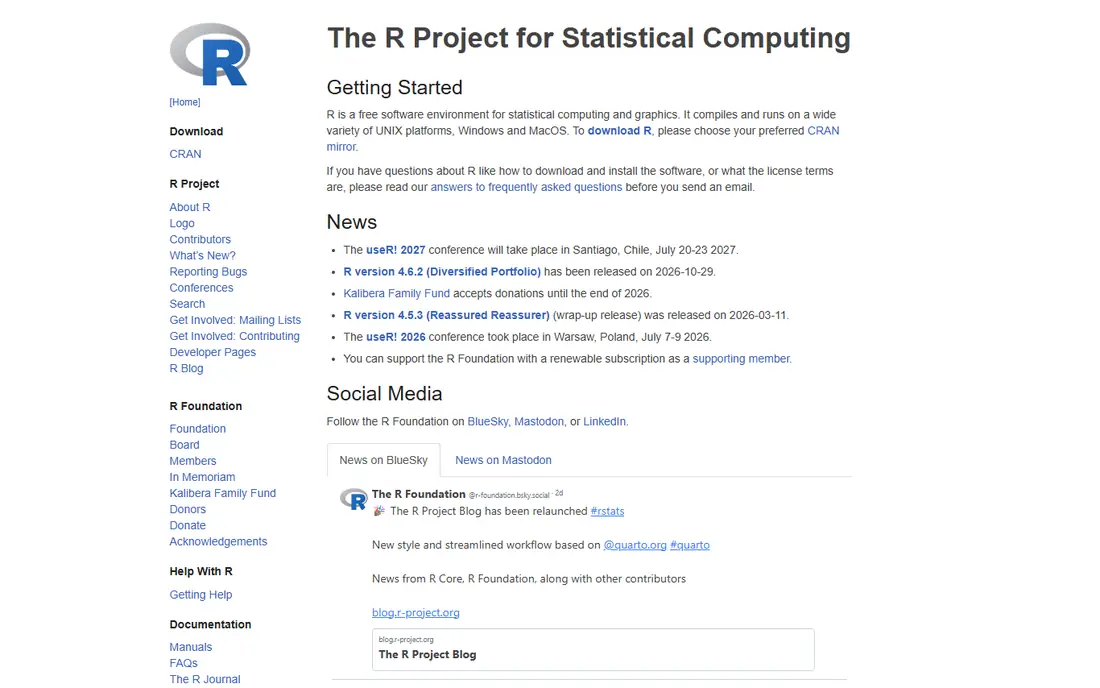
R is the most flexible free statistical tool, and it is the standard for many researchers who code. Its package library covers almost every modern method, from basic tests to advanced modeling, machine learning, and Bayesian analysis, and scripts make your work reproducible in a way point-and-click steps often do not. Graphics in R, especially with popular packages, are also strong for publication.
The cost is learning time. R has no point-and-click interface by itself, though RStudio and similar tools help, and beginners must learn code before they can run a simple test. There is also no official vendor support line, so help comes from docs and community. If you are willing to code, R gives unmatched depth at no license cost.
- Free and open source
- Huge package library for new methods
- Strong graphics and reproducible scripts
- Code-based, so beginners face a steep start
- No official support line
- Package quality varies
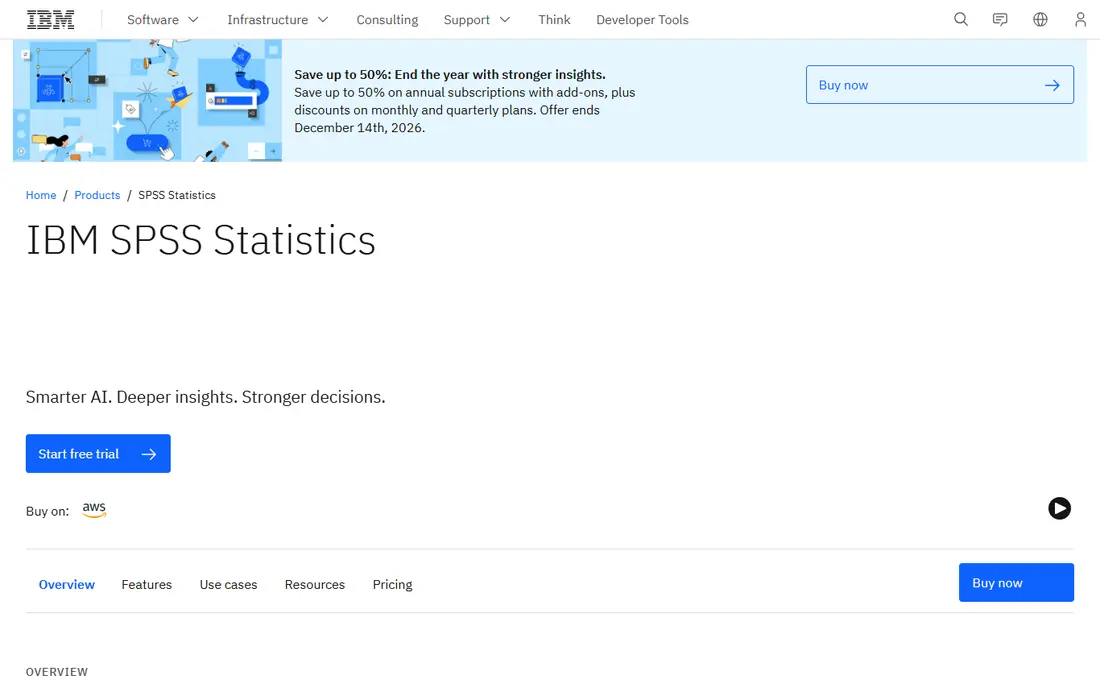
IBM SPSS Statistics remains the familiar choice for social science, market research, and survey analysis. Its menus cover descriptive statistics, t-tests, ANOVA, regression, and forecasting without code, and its output is widely recognized by reviewers, teachers, and employers. Many courses still teach SPSS first, which makes collaboration easier for students and teams.
The main drawback is price. Subscription pricing is listed from $99 per user per month in recent comparisons, which is a large ongoing cost compared with free JASP, jamovi, or R. SPSS is also less flexible than R for advanced or new methods, and data manipulation can feel slower. If your field expects SPSS output, it is worth the cost. If not, free tools cover most of the same basic tests.
- Familiar point-and-click interface
- Strong for surveys and regression
- Widely taught and recognized
- High subscription cost
- Less flexible than R for new methods
- Data handling can feel clunky
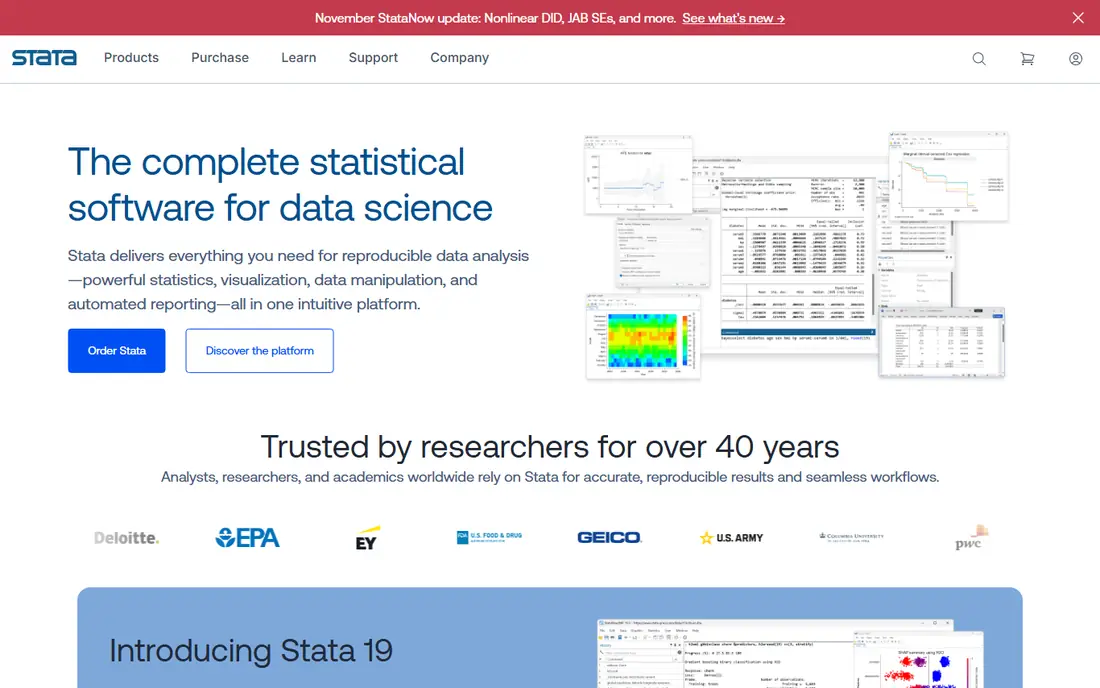
Stata is the leading choice for econometrics, panel data, time series, and survey analysis in economics, epidemiology, and political science. Its do-files make analysis reproducible, its data management tools handle panel structures well, and its documentation is clear and complete. Many academic journals and employers expect Stata code, which makes it a practical career choice in those fields.
Pricing is license-based and varies by user type, with student and academic prices lower than commercial prices, so check the current Stata store for your category. Stata is also less flexible than R for some newer methods, and its interface feels dated beside newer tools. For reproducible econometric work, that trade-off is usually worth it.
- Excellent panel and survey data tools
- Reproducible do-files
- Clear documentation
- License cost adds up
- Less flexible than R for some methods
- Interface feels dated to some users
SAS leads for large-scale enterprise analysis, especially in pharma, finance, and government work where validated results and audit trails matter. It handles very large datasets, complex data management, and regulated reporting with a track record that smaller tools cannot match. SAS Viya adds a modern cloud and machine learning layer to that core strength.
Pricing is quote-based and enterprise level, so small teams and students should not expect a simple monthly plan. The learning curve is also steep, with its own programming language and a large feature set. For a single researcher or a small class, R or JASP will be simpler and free. For a large organization with regulatory needs, SAS remains a serious standard.
- Proven for large datasets
- Strong in pharma and finance
- Validated, auditable workflows
- Quote-based enterprise pricing
- Steep learning curve
- Less common for small teaching projects
JASP is the best free point-and-click tool for researchers who want Bayesian analysis beside classical tests. Its interface is clean, its output tables are formatted for publication, and it covers t-tests, ANOVA, regression, and Bayesian versions of many common tests. Psychology, education, and social science students often find JASP easier to learn than SPSS, at no cost.
It is less flexible than R for data cleaning and advanced modeling, and its test range is smaller than SPSS or Stata. Large commercial workflows with complex data pipelines will also need a code-based tool. For coursework, theses, and standard research tests, JASP gives a polished free result without a subscription.
- Free and open source
- Bayesian and classical tests side by side
- Publication-ready tables
- Less flexible than R for data wrangling
- Smaller test range than SPSS
- Not suited to large commercial workflows
jamovi is the easiest free statistical tool for beginners and teachers. It is built on R, but you use menus instead of code, and its spreadsheet-like data view feels familiar from day one. Modules extend it for new methods, and its output updates live as you change an analysis, which helps students see how a test works.
Compared with JASP, jamovi has less Bayesian depth, though it still covers standard tests well. Advanced work may need extra modules or a move to R itself. For teaching, coursework, and basic to intermediate analysis, jamovi is a friendly free choice that does not hide results behind a paywall.
- Free and open source
- Very easy to learn
- Built on R with growing modules
- Less Bayesian depth than JASP
- Advanced methods need modules or R
- Not for large enterprise work
Minitab is the specialist for quality improvement, Six Sigma, and manufacturing analysis. It excels at control charts, capability analysis, measurement systems, and designed experiments, with menus and output that quality teams understand without statistical training. Engineers and plant managers often prefer Minitab over a general tool for that focused work.
It is narrower than SPSS, Stata, or R, so it is not the best general research tool. Pricing also varies by plan and is not published plainly for every option, so request a quote for your team size. For quality and process work, Minitab is the right specialist. For general survey or econometric research, pick a broader tool from this list.
- Built for quality improvement
- Control charts and capability analysis
- Clear for manufacturing teams
- Pricing is not published plainly for all plans
- Narrower than general stats tools
- Less common outside quality work
GraphPad Prism is made for lab scientists who need clear graphs and standard stats in one place. It handles t-tests, ANOVA, regression, survival analysis, and dose-response curves, and its graphs are ready for papers and posters without extra design work. Biology, pharmacology, and medical researchers often choose Prism over a general tool for that reason.
It is not a general statistics platform. Survey analysis, panel data, and large enterprise modeling belong in SPSS, Stata, SAS, or R instead. Pricing is subscription-based and varies by license type, so check the current GraphPad store. For lab work where graphs matter as much as tests, Prism is a strong, focused pick.
- Excellent scientific graphs
- Good for lab stats and dose-response work
- Clear, publication-ready output
- Not a general statistics platform
- Subscription pricing
- Less suited to survey or panel data
PSPP is a free, open source program designed to feel like SPSS, including its interface and syntax language. Its main use is running existing SPSS syntax files without paying for a license, and it covers many standard tests, descriptive statistics, and regression models. For users with old SPSS files or a tight budget, that compatibility is valuable.
It is missing many SPSS procedures, its output formatting is more limited, and development is slower than JASP or jamovi. Most new users will get a better experience from JASP or jamovi unless they specifically need SPSS syntax compatibility. PSPP remains useful as a free bridge for legacy files, not as a first choice for new projects.
- Free and open source
- SPSS-like interface and syntax
- Covers many standard tests
- Missing many SPSS procedures
- Output formatting is limited
- Slower development than JASP and jamovi
How we picked these
We compared official product pages, pricing pages, and documentation for statistical tools available in October 2026. We kept tools with a real, current product presence and a clear statistical focus, covering free, point-and-click, code-based, and enterprise options. We did not claim hands-on testing. Where pricing was quote-based or varied by license type, we wrote See website rather than guessing a single figure.
What to check before you buy
Start with your field and your data. Economics and panel work point to Stata, quality work points to Minitab, lab work points to Prism, and general research points to R, SPSS, JASP, or jamovi. Check whether your course, journal, or employer expects a specific tool, since that expectation can matter more than a feature comparison.
Test with your own dataset, not a demo file. Check import formats, missing data handling, output formatting, and whether you can reproduce the analysis later. For paid tools, confirm academic, student, or nonprofit pricing, since those rates differ sharply from commercial rates. For free tools, confirm that the test you need exists in the current version, not just in an old review.
Frequently asked questions
What is the best statistical software for students?
JASP and jamovi are the best free starting points for most students, since they are point-and-click, free, and cover coursework tests well. R is the best long-term free choice if you plan to code and work in research. SPSS is worth it only if your course or field requires it, since free tools cover most basic tests.
What is the best statistics software for researchers who do not code?
JASP, jamovi, SPSS, and Prism lead for non-coders, each in a different field. JASP suits Bayesian and social science work, jamovi suits teaching and general analysis, SPSS suits surveys, and Prism suits lab science. Pick by field, then test your exact analysis in the free trial or free edition before you commit.
What is the best free statistical software overall?
R is the most powerful free tool overall, but only for users who code. For point-and-click users, JASP and jamovi share the lead, with JASP ahead on Bayesian methods and jamovi ahead on ease of learning. PSPP is best only when you need to run old SPSS syntax files for free.
Is SPSS better than R?
Neither is better in all cases. SPSS is easier to learn and widely recognized for survey work, while R is free, more flexible, and better for new methods and reproducible scripts. Many researchers learn both, using SPSS or JASP for quick tests and R for complex or repeated analysis.
Can free tools handle large datasets?
R handles large datasets well with the right packages and enough memory, while JASP and jamovi suit small to medium teaching and research datasets better. SAS and Stata handle large, structured datasets with stronger data management tools. Test with a sample of your real data, and check memory, import speed, and output size before you choose.
Sources
See where you really rank - block by block
ProMapRanker scans Google Maps across a grid of your service area. Simple monthly plans from $19, white-label on every plan.
Start freeKeep reading
 zscaler alternatives
Best Zscaler Alternatives in 2026
Looking for zscaler alternatives? We compare 9 SASE and zero trust platforms on architecture, data protection, pricing, and fit for your network and team.
Read → zapier alternatives free
Best Zapier Alternatives Free in 2026
Nine automation tools for zapier alternatives free in 2026, all with genuinely free tiers, plus free plan limits, starting prices and upgrade paths explained.
Read → which platform is best for online reputation
Which Platform Is Best for Online Reputation in 2026
Wondering which platform is best for online reputation? We compare 8 review, listing, and response tools for small and multi-location businesses and agencies.
Read →