 ProMapRanker
Best Software for Statistical Analysis in 2026


Point-and-click statistics · Pricing starts at: $99 per user per month
Key takeaways
- IBM SPSS Statistics and GraphPad Prism suit users who want point-and-click analysis without writing code for every test.
- R and Jamovi are the best free options, with R offering the most flexibility and Jamovi offering the easiest start for beginners.
- SAS, Stata and JMP suit research and enterprise teams that need reproducible, auditable analysis at scale.
- Minitab suits quality and process work, with tools built for manufacturing, Six Sigma and process improvement.
Quick comparison
| Pick | Great for | Pricing starts at | Free tier | |
|---|---|---|---|---|
| IBM SPSS Statistics | Point-and-click statistics | $99 per user per month | Free trial | Visit |
 SAS | Regulated and enterprise analysis | See website | Free trial | Visit |
 Stata | Reproducible research | See website | Free trial | Visit |
 R | Free statistical computing | Free | Yes | Visit |
 JMP | Interactive visual analysis | See website | Free trial | Visit |
 Minitab | Quality and process analysis | See website | Free trial | Visit |
 GraphPad Prism | Biostatistics and graphing | See website | Free trial | Visit |
 Jamovi | Free point-and-click statistics | Free | Yes | Visit |
The best software for statistical analysis
Statistical analysis software ranges from point-and-click tools for students to code driven platforms for researchers and enterprise teams. We compared official pricing pages, feature lists and the analysis types each vendor lists, and we note where pricing is quote based, since academic, student and commercial prices differ. We did not claim hands-on testing, and we based our view on vendor pages and public reviews.
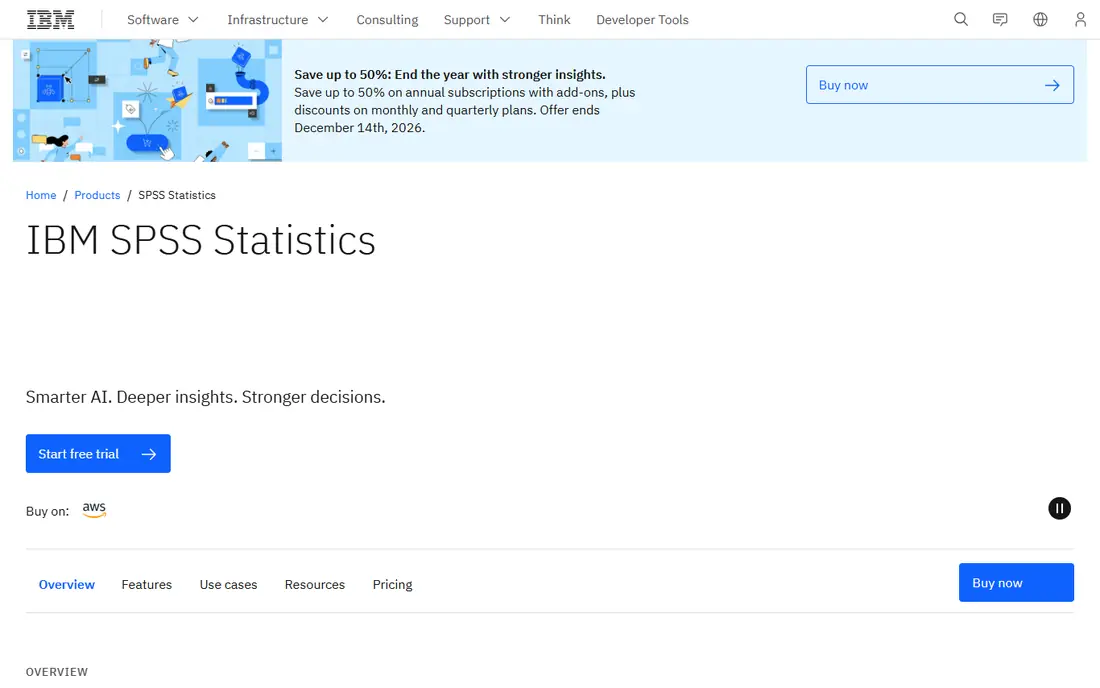
IBM SPSS Statistics is the classic point-and-click statistics tool, used widely in social sciences, business and health research. Users pick a test from a menu, choose variables, and get tables and charts that are ready to report, without writing code for common analyses. It covers descriptive statistics, regression, ANOVA, multivariate analysis and forecasting, with syntax available for users who want to save and rerun an analysis. The base subscription starts at $99 per user per month.
The catch is cost and modules. The commercial price is high for a solo user, and some advanced procedures sit in separate modules, so the total depends on which analyses are needed. Academic and student pricing differs, so students should check their institution's licence first. For a team that wants a familiar, menu driven tool with a long track record, SPSS remains a safe choice.
- Familiar menu driven interface
- Wide test library
- Clear tables and charts
- Commercial price is high for solo users
- Advanced modules cost extra
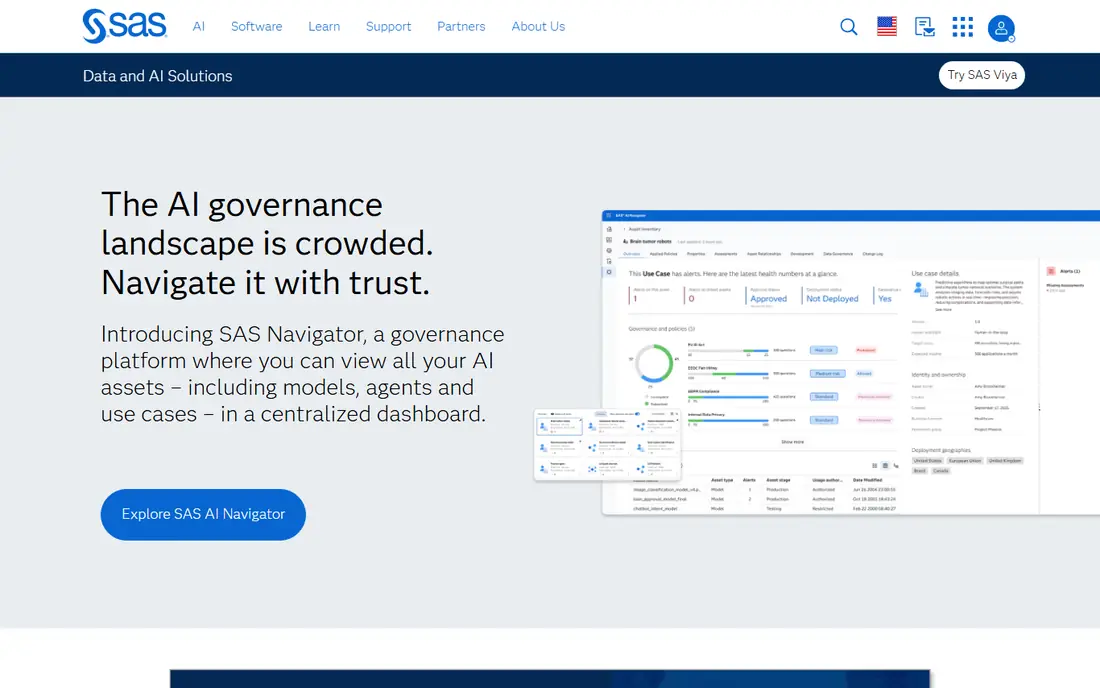
SAS is an enterprise analytics platform used in regulated industries, finance, health care and government, where auditable workflows and reproducible results matter. Its statistical procedures cover regression, ANOVA, Bayesian analysis, survey analysis and many other methods, and its data handling suits very large datasets. SAS also offers a free trial and learning editions for students, which helps new users learn the language before a commercial purchase.
The drawback is pricing and learning curve. SAS pricing is quote based and varies by product, user type and deployment, so we list it as See website. New users also face a steeper start than with a point-and-click tool, since much SAS work uses code. For an enterprise or research team that needs governed, repeatable analysis at scale, SAS is a leading option.
- Strong audit and reproducibility tools
- Wide enterprise use
- Powerful data handling
- Quote based pricing
- Learning curve for new users
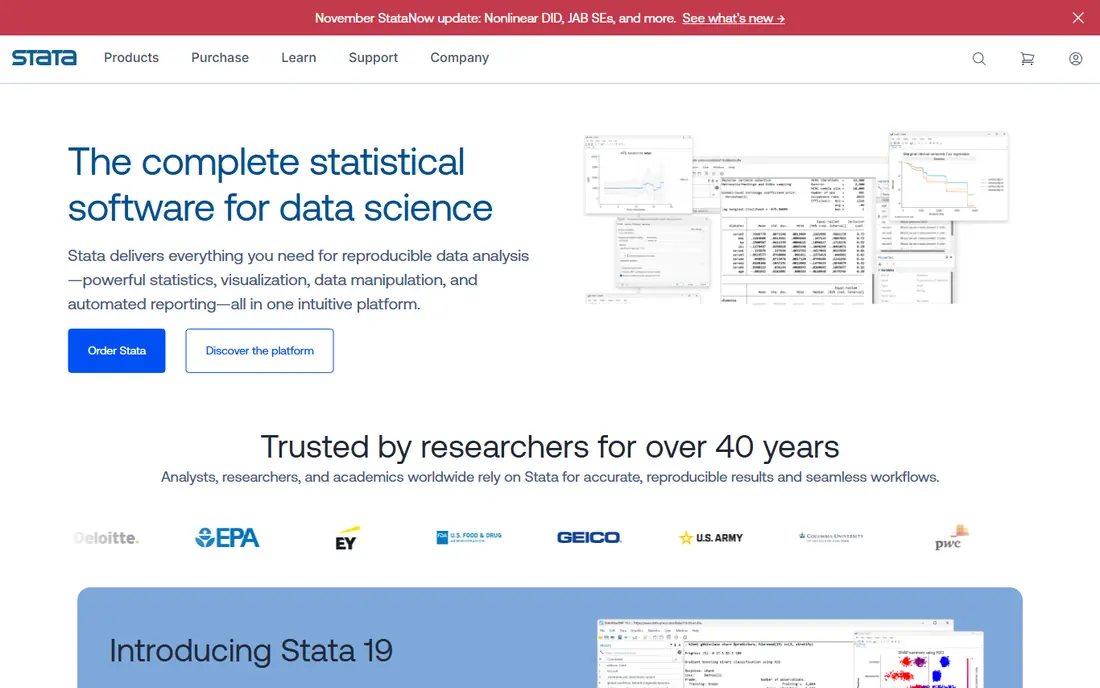
Stata is a favourite in economics, epidemiology and social research, because it combines a menu interface with a powerful command language. Users can run an analysis by menu, then save the commands in a do-file and rerun the exact analysis later, which supports reproducible research and publication. It covers panel data, survey data, mixed models, survival analysis and many other methods, with clear documentation and a large user community.
The catch is licence pricing. Stata pricing varies by single user, student, business and annual versus perpetual licences, so we list it as See website rather than quoting one figure. The interface is also less visual than JMP for exploratory work. For researchers who need to share exact, rerunnable analysis code with reviewers, Stata is an excellent choice.
- Reproducible do-files
- Strong panel and survey tools
- Clear documentation
- Pricing varies by licence type
- Interface is less visual than JMP
R is a free, open source language and environment for statistical computing, used widely in academia, research and data science. Its package library covers almost every statistical method, from basic tests to Bayesian models, machine learning and advanced graphics, and its code based workflow makes an analysis fully reproducible. Many users pair R with RStudio, now Posit, which adds an editor, plots and project tools, also free for the open source edition.
The trade-off is coding. R assumes the user writes code, and there is no single vendor support line, although community help, documentation and courses are extensive. For a student, researcher or analyst with a zero budget and time to learn, R offers the most power for no licence cost. For a user who needs menus only, Jamovi or SPSS will be easier.
- Free and open source
- Huge package library
- Fully reproducible code
- Needs coding
- No single vendor support line
JMP, from JMP Statistical Discovery, is built for interactive data exploration. Users can drag variables onto graphs, link plots so that selecting points in one graph highlights them in others, and run analyses without writing code for most tasks. It suits scientists, engineers and quality teams who want to explore data visually before settling on a model, and it includes scripting for users who want to automate a workflow.
The catch is price. JMP commercial pricing is high and varies by licence type, so we list it as See website, and a free trial is available to test it. Academic pricing differs, so students and researchers should check institutional options. For a team that learns by looking at data, JMP offers an exploration experience that menu only tools do not match.
- Interactive linked graphs
- Easy data exploration
- Strong for scientists and engineers
- Commercial price is high
- Pricing varies by licence
Minitab is a statistics tool built for quality, manufacturing and process improvement, with tools for control charts, capability analysis, measurement systems, design of experiments and Six Sigma projects. Its Assistant feature helps a user choose the right test and interpret the result, which suits engineers and quality staff who are not full time statisticians. It is available as desktop software and as a web app, with a free trial.
The limit is scope. Minitab is excellent for process work, but it is less broad for general social science or economic research than SPSS, Stata or R. Pricing also varies by product and licence, so we list it as See website. For a quality team that lives by control charts and capability studies, Minitab is the natural pick.
- Quality and Six Sigma tools
- Clear assistant for choosing tests
- Process charts
- Pricing varies by product
- Less suited to general research than SPSS or Stata
GraphPad Prism is designed for bench scientists and biostatistics, combining analysis and graphing in one workflow. It covers descriptive statistics, hypothesis testing, regression, dose response curves, survival analysis and ROC curves, with graphs that are ready for a paper or presentation without a separate chart tool. Each analysis includes guidance on which test fits and how to interpret the result, which helps researchers who are not statisticians.
The trade-off is breadth. Prism does not try to cover every statistical method, and large enterprise data work suits SAS or R better. Pricing varies by academic, student and commercial licence, so we list it as See website, with a free trial available. For a lab or clinical team that needs biostatistics plus clean graphs, Prism is a strong, focused choice.
- Biostatistics focused tests
- Publication ready graphs
- Clear guidance per analysis
- Narrower scope than general tools
- Pricing varies by licence
Jamovi is a free, open source statistics tool that offers a menu driven interface similar to SPSS, without a licence fee. Users pick an analysis from a menu, see tables and plots update live, and can view the underlying R code for each analysis, which helps students learn the link between menus and code. It covers common tests, regression, ANOVA and more, with modules that add extra methods.
The limit is depth. Jamovi's core library is smaller than R, SAS or SPSS, and it lacks the enterprise governance tools of SAS. For a student, a small research team or a teacher who needs a free, easy tool for standard analyses, Jamovi is an excellent pick. For advanced or regulated work, R, Stata or SAS will be needed alongside it, or instead of it.
- Free and open source
- Menu driven like SPSS
- R code view for learning
- Smaller test library than R or SAS
- Fewer enterprise features
How we picked these
We compared official pricing pages, feature lists and analysis coverage for statistical software available in October 2026. We included point-and-click tools, code driven tools and free tools, so readers can match a tool to their skill level and budget, and we left out spreadsheet add-ins with no dedicated statistical workflow, and tools with no clear trial or free path. We based our view on vendor pages and public reviews, and we did not claim hands-on testing. Where pricing varied by academic, student or commercial licence, we wrote See website rather than quoting one figure.
What to check before you buy
Start with your skill level and your analysis type. If you need standard tests and clean tables without coding, a menu tool such as SPSS, Jamovi or Prism will be faster. If you need reproducible code, custom models or very large data, R, Stata or SAS will serve you better, even with a learning curve. Check that the tool covers the exact tests you run most, not just a long feature list.
Next, check licence terms. Academic, student and commercial prices differ widely, and some tools offer a free trial long enough to complete a real project. Test the tool on your own data, check how it handles missing values, and confirm that tables and graphs export in a form your team or journal accepts. A tool that fits your workflow will save more time than a tool with a longer method list that you never use.
Frequently asked questions
What is the best statistical analysis software?
The best tool depends on your needs. SPSS and Jamovi suit point-and-click users, R suits coders who want a free and flexible tool, Stata suits reproducible research, and SAS suits enterprise and regulated work. Start with your skill level, budget and analysis type, then trial two tools on the same dataset before deciding.
What is the best free statistical software?
R and Jamovi are the best free options in this list. R offers the most methods and flexibility, but needs coding, while Jamovi offers a menu interface that is easier for beginners and shows the R code behind each analysis. Many students use both: Jamovi for quick analyses, and R for advanced or custom work.
What is the best statistical software for students?
Jamovi and R are strong for students, since both are free, while SPSS, Stata and Prism often offer student or academic pricing through an institution. Check your university's software portal before buying, since a licence may already be available at no extra cost. For a class that uses menus, Jamovi or SPSS will match the teaching material most closely.
Is SPSS or R better for statistical analysis?
SPSS is easier for menu driven analysis and clear tables, while R is free, more flexible and better for reproducible code and custom methods. Many researchers use SPSS for teaching and quick analyses, and R for advanced work, and both can be valid for the same dataset. The choice often comes down to budget, coding comfort and what your team or supervisor already uses.
What software do researchers use for statistical analysis?
Researchers use a mix, depending on field. Social scientists often use SPSS or Stata, economists often use Stata or R, biologists often use Prism or R, and enterprise teams often use SAS. The common thread is reproducibility: whichever tool you pick, save the commands or code, note the version, and keep the data and analysis together so another researcher can rerun it.
Sources
See where you really rank - block by block
ProMapRanker scans Google Maps across a grid of your service area. Simple monthly plans from $19, white-label on every plan.
Start freeKeep reading
 zoho inventory alternatives
6 Alternatives to Zoho Inventory, Compared on Price and Fit
Zoho Inventory alternatives: 6 tools compared on price, free plans and fit. Katana leads the list for manufacturers. Fit and flaws are laid out for each entry.
Read → zoho crm alternatives
Best Zoho CRM Alternatives (2026)
Need Zoho CRM alternatives? We compare 7 tools on cost, free access and who each suits. Every pick gets a straight assessment. Built for quick decisions.
Read → zelle alternatives
Best Zelle Alternatives in 2026
Compare the best Zelle alternatives for sending money to friends, paying sellers and moving funds abroad, with honest notes on fees, speed and safety in 2026.
Read →