 ProMapRanker
Best Service for Real-Time Cloud Monitoring in 2026


Broad all-in-one monitoring · Pricing starts at: $15 per host per month
Key takeaways
- Real-time cloud monitoring is about live metrics, traces and logs in one view, not just a daily status check.
- Datadog suits teams that want one broad platform, while New Relic and Grafana Cloud suit teams that want lower starting costs.
- Pricing models differ sharply, since some tools charge per host, others per user and others per data volume.
- Set data limits and alert rules on day one, because metric volume and log retention drive most surprise bills.
Quick comparison
| Pick | Great for | Pricing starts at | Free tier | |
|---|---|---|---|---|
| Datadog | Broad all-in-one monitoring | $15 per host per month | Free trial | Visit |
 New Relic | User-based pricing with free tier | Free | Yes | Visit |
 Grafana Cloud | Open-source observability stack | Free | Yes | Visit |
 Dynatrace | Large complex environments | See website | Free trial | Visit |
 Site24x7 | Small teams on a budget | $9 per month | Free trial | Visit |
 LogicMonitor | Mixed cloud and on-prem estates | See website | Free trial | Visit |
 Splunk Observability Cloud | Streaming real-time analytics | See website | Free trial | Visit |
The best services for real-time cloud monitoring
We compared cloud monitoring services on live metric collection, tracing, log handling, alerting, integrations and pricing models. The seven below are active in October 2026 and cover small teams through large enterprises.
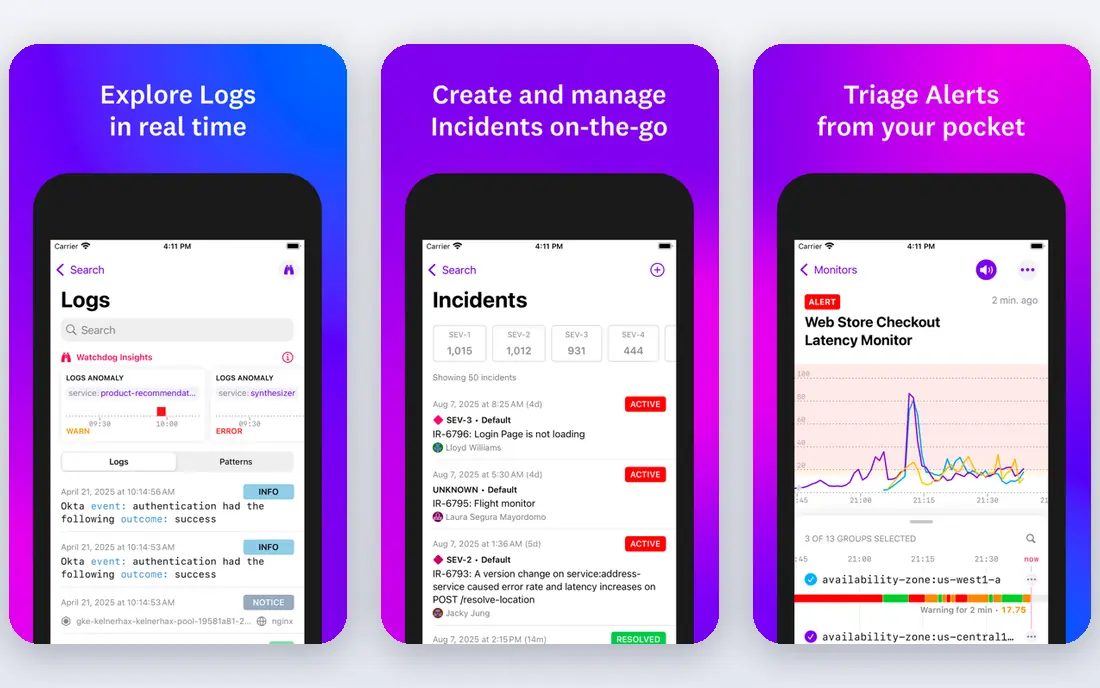
Datadog fits growing engineering teams that want infrastructure monitoring, application performance, logs and synthetic checks without stitching several tools together. Its integration library covers major cloud services, databases and frameworks, which shortens setup for standard stacks. When an alert fires, related logs and traces sit nearby, which speeds up diagnosis.
The main risk is cost control. Per-host pricing plus log and trace volume can add up as systems grow, so teams should set retention limits, filter noisy metrics and review usage monthly. Datadog rewards teams that treat monitoring spend as a managed budget, not a set-and-forget subscription.
- Very broad integration library
- Metrics, traces and logs in one platform
- Strong dashboards and alerting
- Costs can grow quickly with hosts and data volume
- Pricing needs careful planning
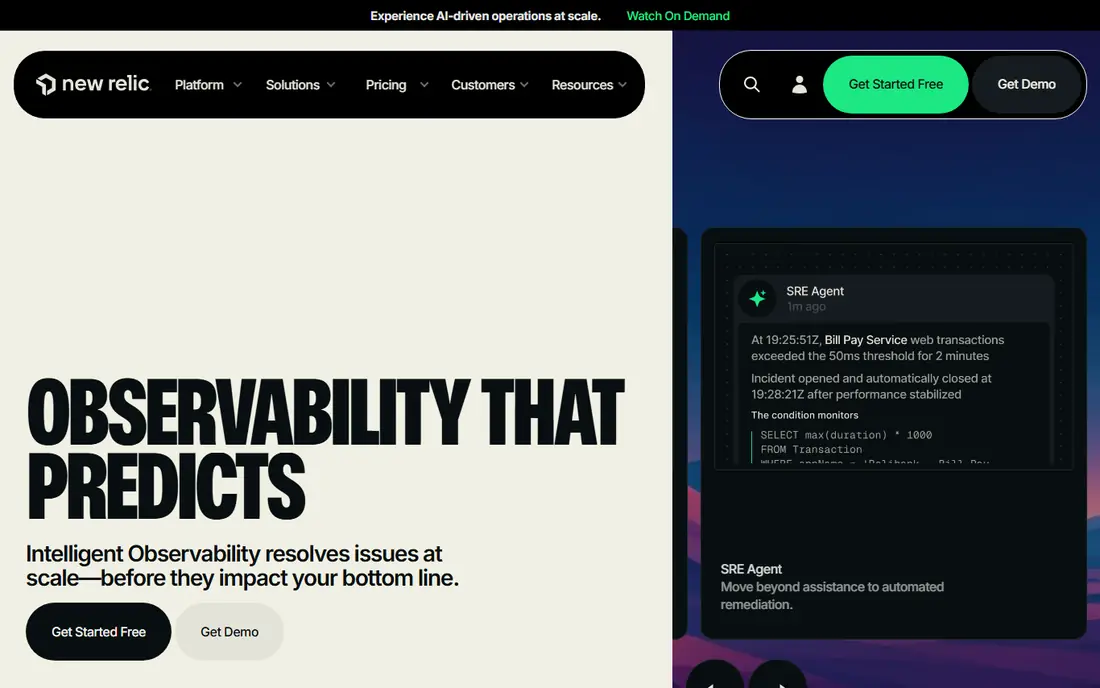
New Relic suits teams that want a real free starting point and predictable user-based pricing as they grow. The free tier includes a monthly data allowance, which lets small teams monitor live services, set alerts and build dashboards without an upfront fee. Paid plans add more users and capacity, while keeping the pricing logic simpler than per-host plus per-module billing.
The catch is data discipline. Once ingest passes the free allowance, overage charges apply, so noisy logs and high-cardinality metrics can raise the bill. Start with essential services, sample or filter verbose logs and review ingest by source each month to keep costs in line.
- Generous free data allowance
- Full-stack observability in one account
- User-based paid pricing
- Data overage costs need watching
- Large estates still need careful ingest control
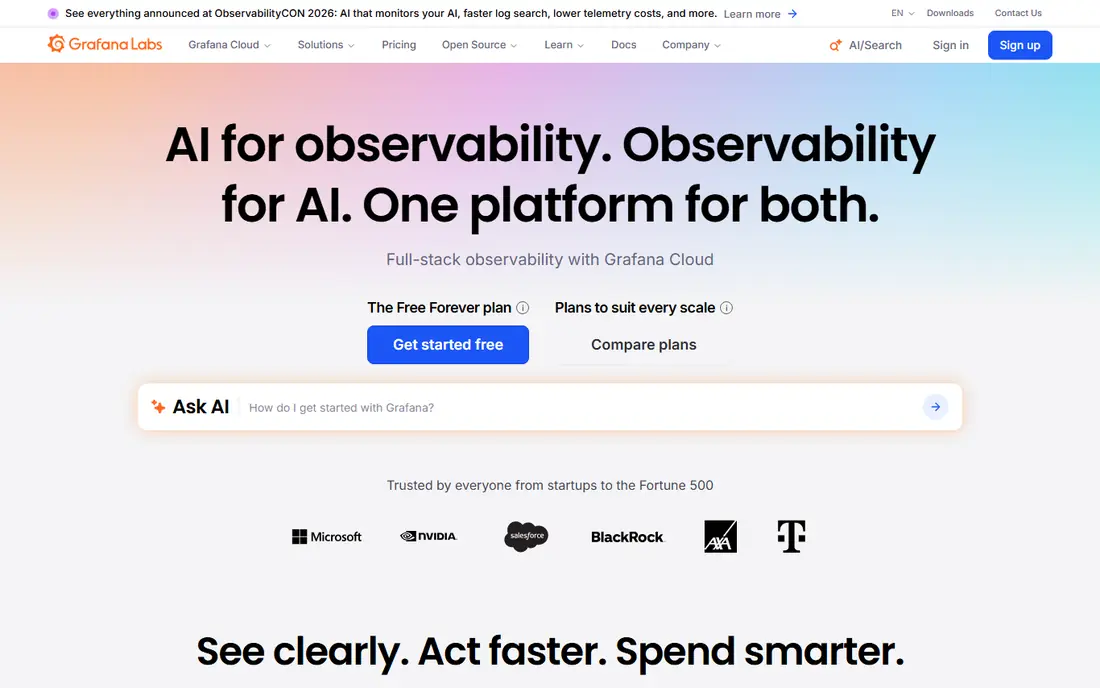
Grafana Cloud fits teams already comfortable with Prometheus, Grafana dashboards and OpenTelemetry. The managed service removes the need to run your own backend, while keeping dashboards and query tools that many engineers already know. Open standards also make it easier to move data or change tools later without rebuilding instrumentation from scratch.
The trade-off is guidance. Grafana Cloud gives you powerful building blocks, but you still design dashboards, alerts and data pipelines yourself. Teams without platform experience may need more time to reach the same polished setup that a more opinionated platform provides out of the box.
- Managed open-source stack
- Strong dashboards
- OpenTelemetry support
- More setup than a fully guided platform
- Paid costs scale with data and users
Dynatrace suits large organizations with many services, hosts and dependencies that are hard to map by hand. Its agent discovers topology automatically and links problems to likely causes, which can cut triage time in complex estates. That automation is valuable when an outage touches dozens of services at once.
For a small team, the depth and price may be more than needed. Dynatrace works best when the estate is large enough that manual mapping and guesswork already cost real engineering time. Smaller teams should compare its trial against a simpler, cheaper platform before committing to an enterprise contract.
- Automated topology mapping
- AI-assisted root-cause analysis
- Broad enterprise coverage
- Enterprise pricing and complexity
- Overkill for small single-service apps
Site24x7 fits small IT teams that need broad coverage without an enterprise bill. It monitors websites, servers, cloud resources and applications, and it includes status pages for customer communication. That breadth at a low entry price makes it a practical first monitoring tool for small businesses moving beyond basic uptime checks.
The limit is depth. Teams doing deep distributed tracing or complex microservice debugging may want a specialist APM platform alongside it. For many small services, though, clear uptime, performance and alert coverage matters more than the deepest trace view.
- Low starting price
- Broad website, server and cloud checks
- Status pages included
- Less deep APM than specialist platforms
- Advanced tracing may feel limited
LogicMonitor suits IT teams managing a mix of cloud services, on-prem servers, networks and storage. Auto-discovery helps map that estate, and consolidated dashboards bring cloud and local resources into one view. That hybrid strength matters for companies that have not moved everything to the cloud and still need to watch older systems closely.
Pricing is not a simple published starting rate for every estate, so get a quote based on your actual resource count. Also plan the rollout, because a large hybrid estate needs tagging, grouping and alert tuning before dashboards become trustworthy. Done well, it gives one place to watch a mixed environment in real time.
- Strong hybrid coverage
- Auto-discovery of devices
- Consolidated dashboards
- Quote-based pricing
- Setup takes care for large hybrid estates
Splunk Observability Cloud fits teams that need streaming, real-time analysis across metrics, traces and logs, especially where Splunk is already used for security or log work. Streaming analytics can surface anomalies quickly, and correlation across telemetry types helps teams move from alert to cause without switching tools. Enterprise integrations suit larger, regulated environments.
The trade-off is complexity and price transparency. Teams new to Splunk should use the trial to test alert setup, dashboard building and data costs before committing. Smaller teams may find a simpler platform faster to run, while larger teams gain more from the depth Splunk offers.
- Streaming analytics for fast detection
- Strong log and metric correlation
- Enterprise integrations
- Quote-based pricing
- Learning curve for teams new to Splunk
How we picked these
We compared official pricing pages, feature documentation, integration lists and public reviews for cloud monitoring services active in October 2026. We favored services with live metric and alert capability, cloud integrations and a clear trial or free tier. We excluded uptime-only checkers and single-server tools, because this guide covers real-time cloud monitoring across services and infrastructure.
We did not claim hands-on testing. Our comparison rests on vendor feature pages, pricing pages, documentation and public user feedback, and teams should trial their top two choices on a real service before committing.
What to check before you buy
Start with what you actually run. List your cloud providers, services, databases and critical user journeys, then check each candidate integration list for those items. A platform that covers your stack well will need less custom instrumentation, while a poor fit will cost engineering time before it delivers value.
Next, model the bill, not just the starting price. Per-host, per-user and per-gigabyte models behave very differently as you grow, so estimate hosts, users, log volume and retention for the next year. Set ingest filters, retention limits and usage alerts from the start, and assign someone to review the bill monthly. A monitoring tool should reduce incident costs, not create a new surprise expense.
Finally, design alerts for action, not noise. Alert on user-facing symptoms first, such as error rates, latency and failed checks, then add deeper system alerts for the teams that own those services. Use clear runbooks, on-call rotations and a short post-incident review, so each alert teaches the team something. A dashboard nobody checks is not monitoring, no matter how real-time the data looks.
Frequently asked questions
What is real-time cloud monitoring?
Real-time cloud monitoring collects live metrics, traces and logs from cloud services and shows performance, errors and availability as they happen. It differs from a daily report because alerts can fire within seconds or minutes of a problem. That speed helps teams fix issues before most users notice them.
Which service is best for a small team?
New Relic and Grafana Cloud are strong small-team starting points because both offer a free tier and lower upfront costs. Site24x7 also suits small IT teams that want broad coverage at a low monthly price. Trial two options on a real service and compare alert quality, not just dashboard looks.
Why do monitoring bills vary so much?
Bills vary because vendors charge by hosts, users, data volume or a mix of those factors, and because log volume and retention differ widely. High-cardinality metrics, verbose logs and long retention raise costs fast. Filtering noisy data and setting retention limits usually saves more than switching vendors alone.
Do I need APM as well as infrastructure monitoring?
Infrastructure monitoring shows host and service health, while APM traces requests through code and shows where slowdowns occur. Small single-service apps may manage with infrastructure checks plus logs, while multi-service apps usually need APM to find slow dependencies. Start with user-facing symptoms, then add APM where diagnosis is slow.
Can I switch monitoring vendors later?
Yes, especially if you instrument with OpenTelemetry and keep dashboards and alerts documented. Switching still takes work, because queries, alerts and integrations differ by vendor. Keep instrumentation portable, export key dashboards and avoid building critical workflows that only work in one platform.
Sources
See where you really rank - block by block
ProMapRanker scans Google Maps across a grid of your service area. Simple monthly plans from $19, white-label on every plan.
Start freeKeep reading
 worlds best local seo company
8 Worlds Best Local SEO Companies for Map Pack Growth in 2026
Compare the worlds best local seo company options for Google Business Profile work, citations, reviews, and multi-location rankings and reporting in 2026.
Read → world's best web hosting company
World's Best Web Hosting Company in 2026
Searching for the world's best web hosting company? We compared 10 hosts on price, renewal rates, speed, and support to help you choose well today in 2026.
Read → who's got the best nanny tax services
Who's Got the Best Nanny Tax Services in 2026
We answer who's got the best nanny tax services, comparing full filing, back taxes, software, and pricing so families can handle nanny taxes correctly.
Read →