 ProMapRanker
Best Self Service Analytics Tools in 2026


Microsoft-centered teams · Pricing starts at: $14 per user per month
Key takeaways
- Self-service only works when business users can answer a question without waiting for an analyst, and governance decides whether that freedom stays safe.
- Power BI and Looker Studio offer the lowest entry cost, while Tableau and ThoughtSpot suit teams that will pay for visual depth or search.
- Looker and Sigma suit governed or warehouse-centered teams, but both need setup work before business users can work alone.
- Test each tool with your own data and a non-technical colleague before signing, since demo data hides most real friction.
Quick comparison
| Pick | Great for | Pricing starts at | Free tier | |
|---|---|---|---|---|
| Microsoft Power BI | Microsoft-centered teams | $14 per user per month | Yes | Visit |
 Tableau | Visual exploration at depth | $15 per user per month | No | Visit |
 Looker Studio | Free Google-based reporting | Free | Yes | Visit |
 ThoughtSpot | Search-led analytics | $25 per user per month | No | Visit |
 Qlik Sense | Associative exploration | $300 per month for 10 users | No | Visit |
 Metabase | Affordable open-source BI | Free | Yes | Visit |
 Sigma | Spreadsheet-style warehouse analysis | See website | No | Visit |
 Zoho Analytics | Small teams on a budget | $24 per month | No | Visit |
 Hex | Notebook-based collaborative analysis | $36 per editor per month | Yes | Visit |
The best self service analytics tools
We compared official feature pages, pricing, app store listings, and public reviews, with attention to how a non-technical user builds a chart, how metrics stay consistent, and what the entry price actually buys. Prices below are starting prices where published, and several tools quote larger deployments by sales discussion.
Power BI is the default pick for a team that already runs on Microsoft 365. Desktop is free for building reports, and Pro at $14 per user per month adds sharing, scheduled refresh, and collaboration. Excel users tend to learn its interface faster than a wholly new tool, and the connector list covers the common business systems a service firm already uses.
The catch is licensing. Free desktop work does not mean free sharing, and viewers often need Pro licenses too, which changes the team total. Data modeling also rewards care: a rushed model produces inconsistent numbers across reports, so assign an owner for metrics before opening the tool to everyone.
- Low entry price for Pro
- Deep Excel and Microsoft 365 integration
- Copilot assistance on some plans
- Sharing often requires Pro licenses for viewers
- Data modeling with DAX takes learning
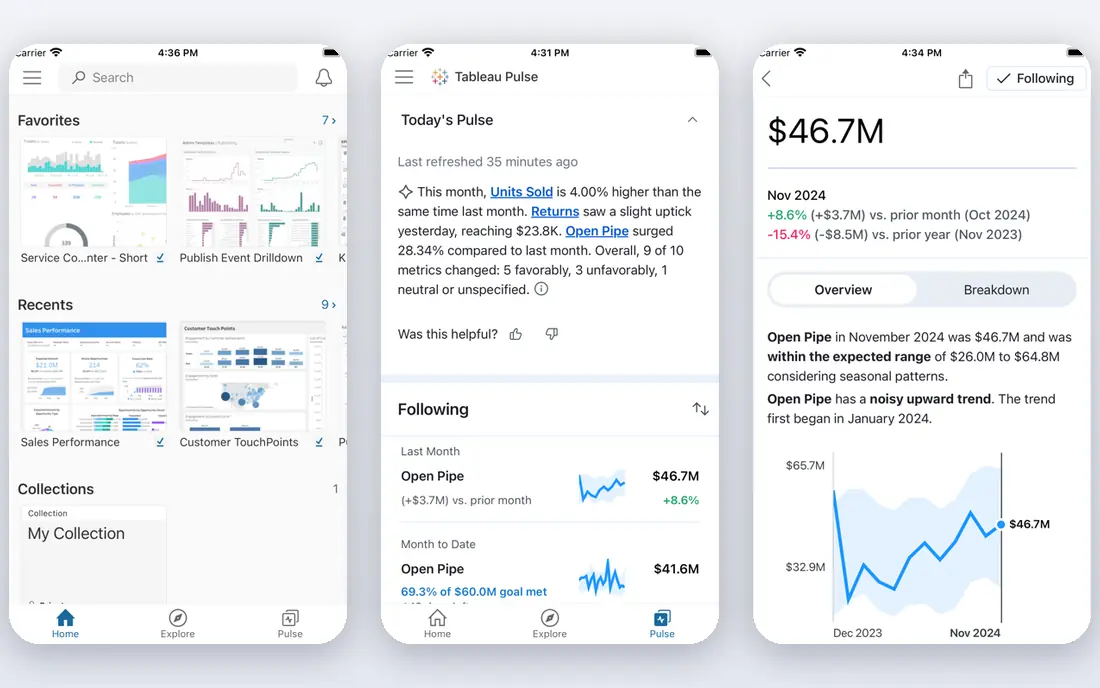
Tableau suits teams that care deeply about how a chart reads and how far a reader can explore it. Drag-and-drop analysis, strong filtering, and polished dashboards make it a favorite for analysts who present to executives. Viewer pricing starts at $15 per user per month, which keeps read-only access affordable for a wider team.
Builder pricing is the honest weakness. Creator licenses cost substantially more, so a company that gives everyone a Creator seat will overspend quickly. Audit who truly builds dashboards and who only views them, and reserve Creator licenses for the smaller building group.
- Strong visual analysis and dashboard design
- Large community and learning resources
- Handles large data well
- Creator licenses cost far more than viewer licenses
- Costs rise fast with many builders
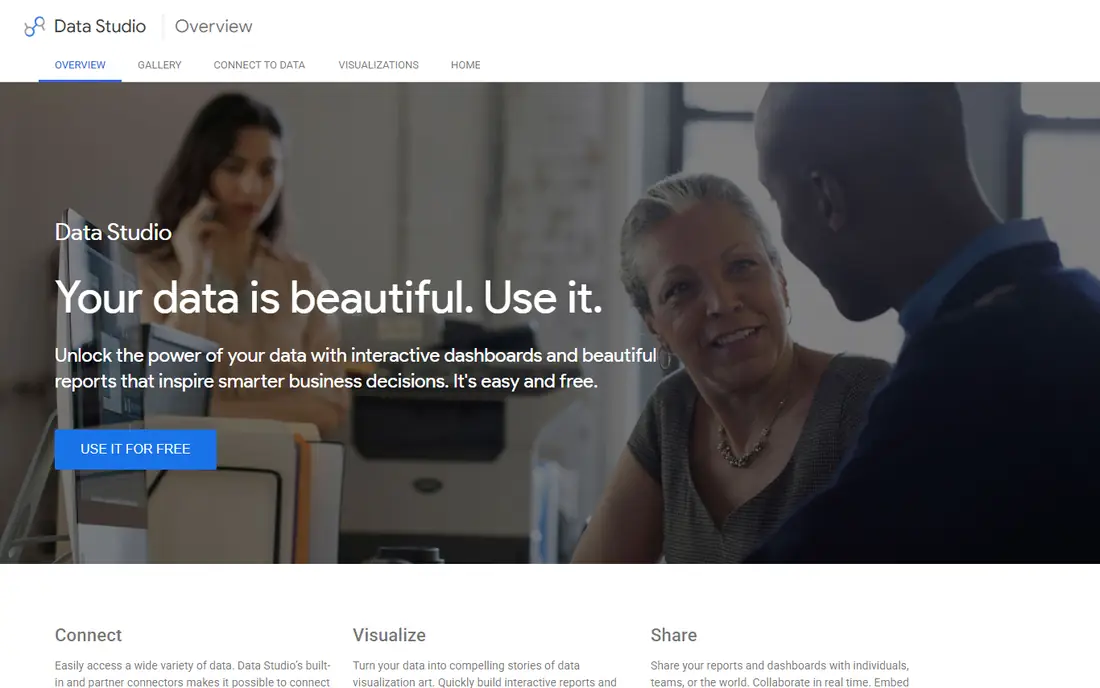
Looker Studio is the best free starting point for a small team that already uses Google tools. Reports share easily, templates speed up common dashboards, and there is no per-user fee to worry about while the team learns what it actually needs. Marketing and web analytics dashboards are a natural fit, since the Google connectors are native.
Governance is where a larger company will feel the limit. Metric definitions, access controls, and audit trails are lighter than in Looker or Power BI, so a team with strict reporting rules should test those controls early. For a small team with clear data sources, though, free and simple beats powerful and unused.
- Free to use
- Sharing feels like sharing a document
- Strong Google Analytics, Ads, and BigQuery links
- Weaker governance than enterprise BI
- Advanced modeling and support are limited
ThoughtSpot changes the habit of analytics from browsing dashboards to asking a question. A manager types a plain-language query, such as sales by region last quarter, and gets a chart that can be drilled into. That search habit suits executives and sales leaders who know the question but do not want to build a report to answer it.
The trade is control. Teams that need deep lineage, transformation visibility, and strict metric governance should compare ThoughtSpot closely against Looker or Power BI before committing. Essentials pricing starts at $25 per user per month in several comparisons, but confirm which AI and governance features sit in the chosen tier.
- Ask questions in plain language and get charts
- Liveboards suit executives
- AI search help on newer plans
- Governance visibility is thinner than some rivals
- Pricing rises with team size and features
Qlik Sense rewards curious analysts. Its associative engine lets a reader click a value and see what connects to it and what does not, which surfaces patterns that a fixed dashboard can hide. Starter pricing at $300 per month for 10 users makes it a team purchase, and that bundle fits a department that will explore data daily.
Casual users may find the depth more than they need. Basic dashboards are approachable, but the full exploration habit takes training and a clear data model. Buy Qlik Sense when a team has power users who will use that depth, not when the goal is only a few static weekly charts.
- Associative engine shows related and unrelated data clearly
- Strong for power users
- AI assistance for chart building
- Learning curve steepens beyond basic dashboards
- Entry bundle suits teams, not solo users
Metabase is the budget pick for teams with some technical skill. The open-source edition is free to self-host, and its query builder lets non-technical users filter and summarize data without writing SQL, while SQL users can go deeper in the same tool. Cloud pricing starts around $100 per month in several comparisons, which still undercuts most enterprise rivals.
Self-hosting is the real cost. Someone must maintain the server, updates, and backups, and performance depends on that setup. Paid tiers add governance, support, and scale, so a growing team should price the cloud plan alongside the free edition before treating Metabase as permanently free.
- Open-source version is free to self-host
- Visual query builder suits SQL and non-SQL users
- Simple dashboards
- Self-hosting needs technical care
- Advanced governance and support sit on paid tiers
Sigma suits teams whose staff already think in spreadsheets but whose data lives in a cloud warehouse. Users build workbooks with formulas, pivot-style summaries, and charts directly against warehouse tables, without exporting data to a desktop file first. That live link keeps numbers current and avoids the stale spreadsheet problem that plagues many small teams.
The weakness is entry transparency. Sigma quotes most deployments through sales, so a small team cannot compare a firm price without a discussion. It also assumes a warehouse is already in place; a team without one should fix its data foundation before buying a warehouse-native tool.
- Familiar spreadsheet interface on warehouse data
- No data extraction needed for live analysis
- AI help for formulas and charts
- Pricing is sales-led for most teams
- Warehouse setup must be right before business users benefit
Zoho Analytics is a strong small-team pick because its entry plan starts at $24 per month for two users, with an AI assistant that answers plain-language questions. Dashboards, scheduled reports, and a broad connector list cover the everyday needs of a service business, a retailer, or a small agency. Teams already using Zoho apps get extra value from the shared login and data links.
Complex modeling is where larger BI tools pull ahead. A company with many data sources, strict governance, and heavy transformation needs should test Zoho against Power BI or Tableau on its hardest report, not its easiest one. For straightforward reporting, though, Zoho delivers a lot per dollar.
- Low entry price for two users
- Plain-language question asking
- Wide connector list for its price
- Less depth than enterprise BI for complex modeling
- Advanced features need higher tiers
Hex fits analyst-led teams that want analysis, discussion, and published apps to live together. Analysts build notebooks with SQL and Python, colleagues comment in threads, and finished work becomes an app that business users can explore. Professional pricing starts at $36 per editor per month, with a free tier for community use.
Casual business users will still lean on analysts for the harder work, so Hex is not a pure self-service replacement for a dashboard tool. Its strength is collaboration around analysis, and teams should pair it with clear viewer roles so that business readers can explore finished apps without needing editor seats.
- Notebooks, threads, and published apps in one flow
- Free community tier
- Strong for analyst-led teams
- Less suited to casual business users alone
- Viewer and editor roles must be planned
How we picked these
We compared official feature pages, pricing, app store listings, and public reviews, and we kept only tools that let business users explore data without writing code for every question. Tools that require a developer for each new chart were left out, as were tools with no public pricing signal at all. We wrote "See website" where a vendor prices by sales discussion rather than publishing an entry rate.
How to run a fair trial
Pick one real business question and one non-technical colleague for the trial, and ask that colleague to answer the question alone in each tool. Time the task, note where help was needed, and check whether the answer matches the analyst's answer from the same data. That single test reveals more than a feature checklist, since it exposes data modeling gaps, confusing menus, and sharing limits.
Then price the whole team, not one seat. Count viewers, builders, and admins separately, and add any warehouse, premium capacity, or support costs. A tool that looks cheap for one analyst can become costly once every manager needs a viewer license, and a tool that looks costly can become fair once only a few builders need paid seats.
Frequently asked questions
What is self-service analytics?
It lets business users explore data, filter charts, and answer questions without asking an analyst for every new report. Analysts still own data quality and metric definitions, but day-to-day questions move to the people who need the answers.
Do business users still need analysts?
Yes, for data modeling, governance, and complex questions. Self-service shifts routine questions to business users and frees analysts for harder work, rather than removing analysts entirely.
Which tool is cheapest for a small team?
Looker Studio is free, and Metabase open source is free to self-host. Among paid tools, Power BI Pro at $14 per user per month and Zoho Analytics at $24 per month for two users are low entry points, though sharing rules change the team total.
How do I keep numbers consistent across dashboards?
Use one governed metric definition for each key number, assign an owner for it, and limit who can change the underlying model. Tools with a semantic layer, such as Looker, make this easier, but process matters in every tool.
Is a free tier enough for a real business?
Sometimes, for a small team with a few dashboards. Free tiers often limit sharing, refresh rates, support, or governance, so test those limits with real users before relying on free alone.
Should I choose search, dashboards, or notebooks?
Choose search when executives ask varied questions, dashboards when the same numbers are reviewed weekly, and notebooks when analysts collaborate on deeper analysis. Many teams end up using two of the three together.
Sources
- https://www.microsoft.com/en-us/power-bi
- https://www.tableau.com
- https://lookerstudio.google.com
- https://www.thoughtspot.com
- https://www.qlik.com
- https://www.metabase.com
- https://www.sigmacomputing.com
- https://www.zoho.com/analytics/
- https://hex.tech
- https://www.bygravity.com/blog/best-self-service-analytics-tools
See where you really rank - block by block
ProMapRanker scans Google Maps across a grid of your service area. Simple monthly plans from $19, white-label on every plan.
Start freeKeep reading
 worlds best local seo company
8 Worlds Best Local SEO Companies for Map Pack Growth in 2026
Compare the worlds best local seo company options for Google Business Profile work, citations, reviews, and multi-location rankings and reporting in 2026.
Read → world's best web hosting company
World's Best Web Hosting Company in 2026
Searching for the world's best web hosting company? We compared 10 hosts on price, renewal rates, speed, and support to help you choose well today in 2026.
Read → who's got the best nanny tax services
Who's Got the Best Nanny Tax Services in 2026
We answer who's got the best nanny tax services, comparing full filing, back taxes, software, and pricing so families can handle nanny taxes correctly.
Read →