 ProMapRanker
Best SaaS Tool for UI Responsiveness Mobile Apps in 2026

Key takeaways
- Sentry is the strongest developer-first choice for mobile crashes and slow UI, with clear code-level detail.
- Datadog and New Relic suit teams that want mobile performance inside a wider observability platform.
- Firebase Performance Monitoring is the lowest-cost starting point for Android and iOS teams already using Firebase.
- Instabug, Embrace, and UXCam add the user view, with bug reports, session timelines, and replays that explain slow screens.
- Measure slow frames, frozen frames, and time to first screen, not just crash counts, since a slow app loses users without crashing.
Quick comparison
| Pick | Great for | Pricing starts at | Free tier | |
|---|---|---|---|---|
 Sentry | Mobile crashes and slow UI | $26 per month | Yes | Visit |
 Datadog | Unified mobile observability | $31 per host per month | Free trial | Visit |
 New Relic | Mobile plus full-stack tracing | Free | Yes | Visit |
 Firebase Performance Monitoring | Firebase Android and iOS teams | Free | Yes | Visit |
 Dynatrace | Enterprise mobile diagnostics | See website | Free trial | Visit |
 AppDynamics | Large enterprise mobile apps | See website | Free trial | Visit |
 Instabug | In-app bug reports and feedback | See website | Free trial | Visit |
 Embrace | Mobile session timelines | See website | Free trial | Visit |
 UXCam | Session replay for mobile UI | See website | Free trial | Visit |
The best saas tool for ui responsiveness mobile apps
Mobile UI responsiveness means how quickly screens load, how smoothly scrolling and animations run, and how often the interface freezes or stutters, not just whether the app crashes. The tools below are SaaS platforms that measure or improve that responsiveness for mobile apps, through performance monitoring, tracing, crash data, and session replay, and we verified that each one genuinely covers mobile apps, not web monitoring only. We compared official feature pages, pricing pages, and documentation.
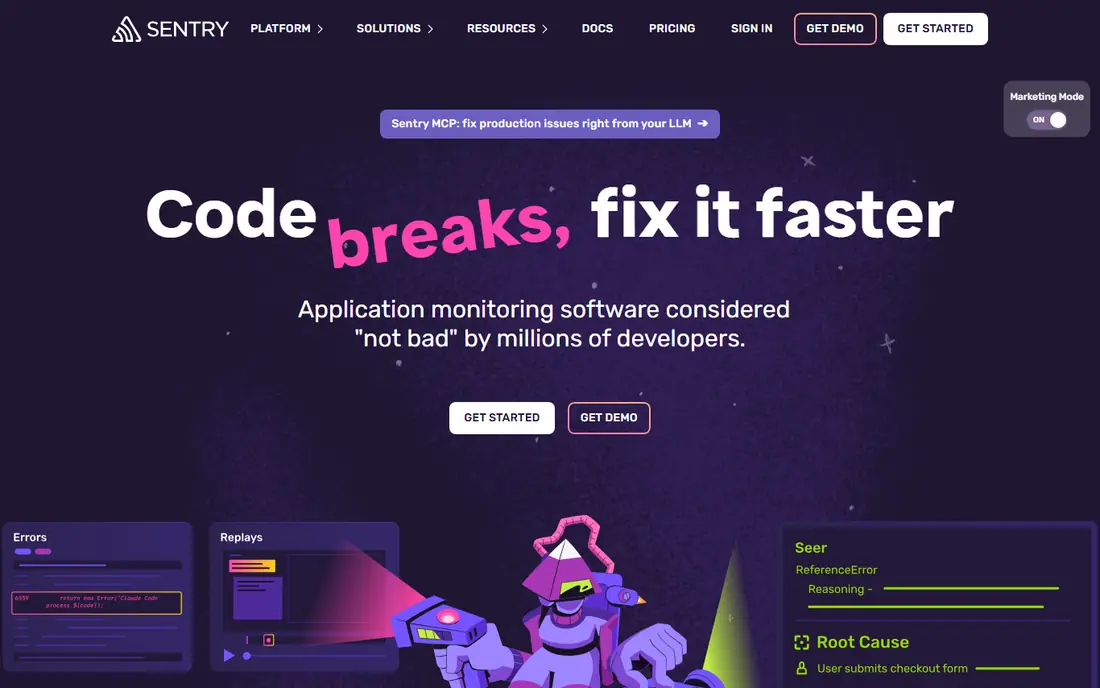
Sentry is the developer-first pick for mobile responsiveness, because it ties slow performance to the code that caused it. Its mobile SDKs for Android and iOS capture crashes, slow transactions, and performance spans, and errors link to releases and commits, so a team can see which deploy introduced a slow screen. That code-level detail helps developers fix a frozen frame, not just count it.
Pricing is per event volume, with published comparisons citing a free Developer plan and Team at $26 per month, so high-traffic apps need to watch event counts and overages. Mobile session replay is more limited than on web, so teams that need to watch a user struggle through a slow screen should pair Sentry with a replay tool such as UXCam.
- Best-in-class mobile crash debugging
- Performance traces tied to errors
- Release tracking
- Event-volume pricing needs monitoring
- Session replay on mobile is limited
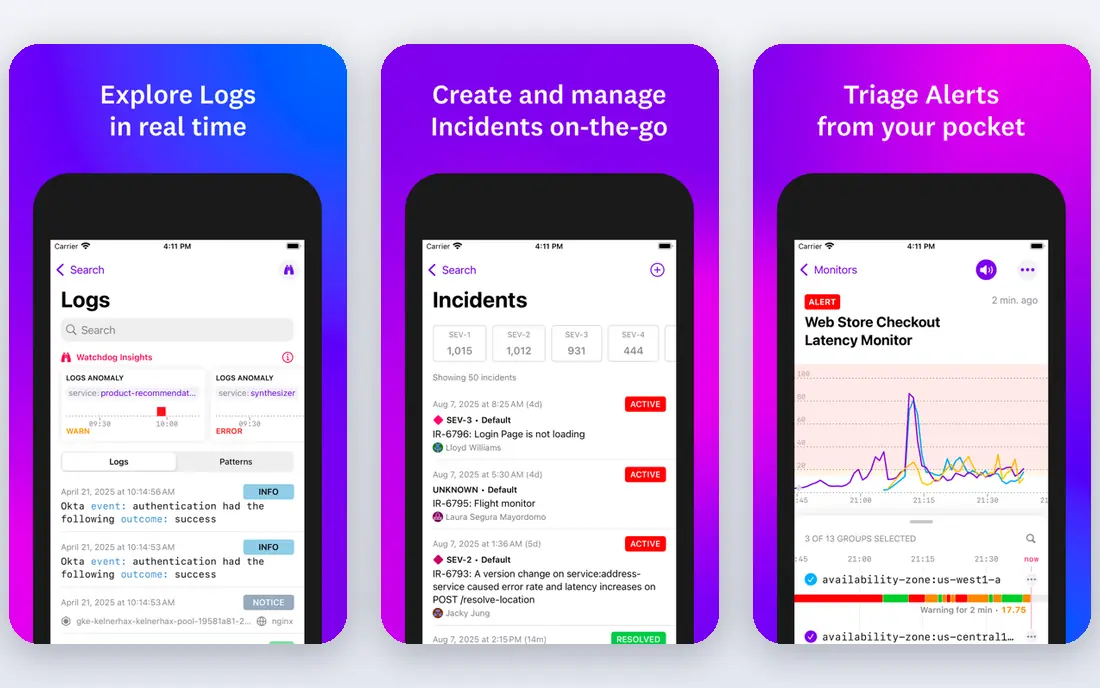
Datadog suits teams that want mobile responsiveness inside a wider observability platform, rather than as a standalone tool. Its real user monitoring covers mobile apps, with performance data, traces, and logs in the same system, so a slow mobile screen can be traced back through backend services and infrastructure. That breadth is valuable for apps with complex backends.
Cost and complexity are the catches. Published comparisons cite APM from $31 per host per month, plus infrastructure, logs, and other modules, so a full deployment can reach a large monthly total. Small teams may find Sentry or Firebase simpler, while larger DevOps-led teams will gain more from Datadog's unified view.
- Real user monitoring for mobile
- Distributed tracing
- Infrastructure and logs in one platform
- Per-host plus per-feature pricing gets complex
- Setup takes days to weeks for full use
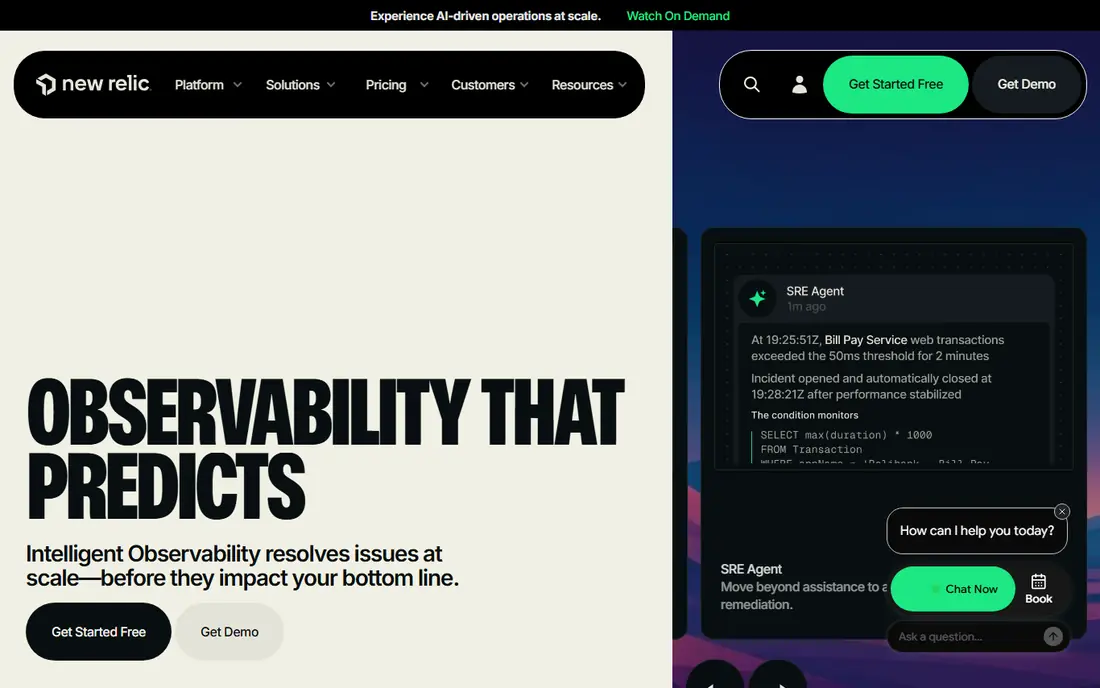
New Relic offers mobile monitoring alongside browser, backend, infrastructure, and synthetic monitoring, with end-to-end tracing from a mobile screen through backend services. Its free tier includes 100 GB of data ingestion per month in published comparisons, plus a full platform user, which makes it genuinely useful for small teams starting out. That breadth helps teams compare mobile slowness with backend slowness in one place.
Usage-based pricing is the risk. Data ingest beyond the free allowance and extra full-platform users can raise bills quickly, and teams report surprise invoices when volume grows. Start on the free tier, set data alerts early, and check whether mobile data volumes fit the allowance before committing to paid use.
- Mobile monitoring with end-to-end tracing
- Generous free data allowance
- Single platform for web, mobile, and backend
- Usage-based pricing can surprise at scale
- User-based charges add up for large teams
Firebase Performance Monitoring is the simplest starting point for teams already building on Firebase. Its SDKs for Android and iOS measure app start time, screen rendering, and network request times with little setup, and results appear in the Firebase console alongside crash data and analytics. For a small or mid-size team, that ease of integration is a real advantage over a full observability platform.
Depth is the limit. It does not match Datadog or Dynatrace for distributed tracing across complex backends, and its value drops for teams that do not use Firebase elsewhere. Use it to find slow screens and slow network calls early, and move to a broader tool only when your backend complexity outgrows it.
- Easy integration for Android and iOS
- Screen rendering and network traces
- Free to start
- Less deep than enterprise APM tools
- Best value only inside Firebase
Dynatrace is the enterprise pick for mobile responsiveness, with AI-driven diagnostics that link a slow mobile screen to backend causes, infrastructure issues, and code-level detail. Its mobile monitoring covers Android and iOS, with session data, crash reporting, and performance traces, and it scales to large app estates with many releases and teams. For a large organisation, that diagnostic depth can cut investigation time sharply.
Pricing is custom and setup is heavier than Sentry or Firebase, so small teams will find it costly and slow to adopt. It fits enterprises that already use Dynatrace for backend observability, or large mobile teams that need a single diagnostic platform across many apps and services.
- AI-driven diagnostics for mobile
- End-to-end tracing
- Enterprise scale and security
- Custom pricing
- Heavier setup than developer-first tools
AppDynamics, part of Cisco, suits large enterprises that view mobile performance through business transactions, such as checkout, booking, or account opening, rather than only through technical metrics. Its mobile monitoring links a slow transaction on a phone to backend services, databases, and infrastructure, which helps large teams prioritise fixes by business impact, not just by error count.
The platform is heavier than newer developer tools, with custom pricing and setup that takes more admin time, and its mobile experience is less developer-friendly than Sentry. It fits best when an enterprise already uses AppDynamics for backend monitoring and wants mobile data in the same business-transaction view.
- Business transaction view for mobile
- Deep backend correlation
- Enterprise integrations
- Custom pricing
- Interface and setup are heavier than newer tools
Instabug approaches responsiveness from the user side, letting testers and users report a slow or broken screen from inside the app, with screenshots, logs, and device details attached automatically. That report quality helps developers reproduce a UI problem that crash data alone cannot explain, such as a button that does not respond or a screen that loads slowly on one device model. Crash reporting and performance data sit alongside those reports.
Pricing is by quote, so teams cannot budget from a simple page, and backend tracing is shallower than on Datadog or New Relic. It works best as a complement to a crash and performance tool, giving product and QA teams a direct route from a user complaint to a reproducible bug report.
- In-app bug reporting with screenshots and logs
- User feedback inside the app
- Crash and performance data
- Pricing by quote
- Less deep backend tracing than observability platforms
Embrace is built specifically for mobile teams, and its strength is the session timeline, which shows everything that happened in a user session, including screens visited, network calls, crashes, and performance events, in order. That timeline helps a developer see why a screen felt slow, whether a network call stalled, a frame froze, or a background task blocked the UI. Proactive alerts flag sessions that need attention before users complain.
Pricing is by quote, and its integration ecosystem is smaller than Sentry or Datadog, so teams that need many third-party connections should check compatibility first. For product teams that live and breathe mobile sessions, Embrace gives a clearer user story than a backend-first observability tool.
- Full mobile session timelines
- Technical and business data in one session view
- Proactive alerts
- Pricing by quote
- Smaller ecosystem than Sentry or Datadog
UXCam shows what responsiveness feels like to a user, through session replays, heatmaps, and screen flow analysis for mobile apps. Watching a replay of a slow screen, a rage tap, or a confusing navigation path often explains a problem faster than a chart of frame times, and heatmaps show where users tap, scroll, and get stuck. That user view complements crash and trace data from tools such as Sentry.
Privacy needs care, since replays can capture sensitive screens, so masking for payment, login, and personal data fields must be set before rollout. Pricing is by quote, and UXCam does not replace backend tracing, so pair it with a performance tool for root-cause fixes, and use replay to decide which slow screens matter most to users.
- Mobile session replay
- Heatmaps for taps and gestures
- Funnel and screen flow analysis
- Pricing by quote
- Replay needs privacy masking for sensitive screens
How we picked these
We compared official feature pages, pricing pages, and documentation, and we kept only SaaS tools with genuine mobile app coverage, including mobile SDKs, mobile crash or performance data, or mobile session replay. We excluded tools that monitor web apps only, and we noted where pricing is custom, since that changes the buying decision for small teams. We did not claim hands-on testing.
What to measure before you buy
Start with three mobile metrics: app start time, slow and frozen frame rates, and time to first meaningful screen, broken down by device model and operating system version. A tool that only reports crash counts will miss the slow, stuttering screens that drive users away without a crash, so check that slow frames and screen load times are first-class metrics, not afterthoughts. Trial the SDK in a test build first, confirm that it does not itself slow the app, and check its data retention and privacy masking.
Compare tools on the same release and the same set of screens, not on marketing claims. Run one tool's trial alongside your current crash reporter for two weeks, check whether its slow-screen reports match user complaints, and confirm that alerts reach the right channel without noise. Choose the tool whose reports your developers actually act on, since a dashboard nobody opens cannot improve responsiveness, however deep its data.
Frequently asked questions
What is mobile UI responsiveness?
It is how quickly and smoothly a mobile app responds, including app start time, screen load time, scrolling smoothness, and freedom from freezes and stutters. An app can be responsive or unresponsive without ever crashing, which is why frame and screen metrics matter alongside crash counts.
Is Sentry enough for mobile responsiveness on its own?
For many developer teams, yes at first, since it covers crashes, slow transactions, and release tracking. Teams that need to watch users struggle through slow screens should add a replay tool such as UXCam, and teams with complex backends may add Datadog or New Relic for tracing.
Which tool is best for a small Firebase team?
Firebase Performance Monitoring is the best starting point, since it integrates easily with Android and iOS Firebase apps and is free to start. Move to Sentry or New Relic only when you need deeper tracing or cross-platform observability.
Why do some tools hide their pricing?
Enterprise tools such as Dynatrace, AppDynamics, Instabug, Embrace, and UXCam price by app volume, sessions, users, and features, so they sell by quote. Ask for a written quote based on your monthly active users and session volume, and compare it with published-price tools.
Does session replay raise privacy risks?
Yes, if sensitive screens are not masked. Set masking for login, payment, and personal data fields before rollout, limit who can view replays, and check your privacy policy and local rules. Most replay tools offer masking controls, but they must be configured, not assumed.
How do I know if a tool slows my app?
Test the SDK in a test build with performance measurement on, and compare app start time and frame rates with and without the SDK. A good SDK adds minimal overhead, but that claim should be verified on your lowest-end supported device, not only on a flagship phone.
Sources
See where you really rank - block by block
ProMapRanker scans Google Maps across a grid of your service area. Simple monthly plans from $19, white-label on every plan.
Start freeKeep reading
 zyte alternatives
Best Zyte Alternatives in 2026
These zyte alternatives cover managed scraping APIs, proxy networks and no code tools for lawful collection from your own or consented sources only in 2026.
Read → zerto alternatives
Best Zerto Alternatives in 2026
Compare the best zerto alternatives for disaster recovery and replication, with recovery targets, cloud options and honest trade-offs for teams in 2026.
Read → zerofox alternatives
Best ZeroFox Alternatives in 2026
We compared 9 zerofox alternatives for brand protection, phishing takedowns, dark web monitoring, and social impersonation, with clear coverage notes.
Read →