 ProMapRanker
Best Performance Information Management Software in 2026


Full stack monitoring in one platform · Pricing starts at: $15 per host per month
Key takeaways
- We read this topic as tools for tracking and managing performance information and data, not as a single named product category.
- Datadog, Dynatrace and New Relic cover full stack performance data, while Grafana Cloud suits teams that want open dashboards.
- Sentry and Honeycomb stay closer to application errors and traces, which helps small teams find slow code faster.
- Pricing models differ sharply: hosts, data volume, users and events all change the bill, so model your own traffic before you pick.
- Start with OpenTelemetry instrumentation where you can, so you can move performance data between tools without rewriting code.
Quick comparison
| Pick | Great for | Pricing starts at | Free tier | |
|---|---|---|---|---|
| Datadog | Full stack monitoring in one platform | $15 per host per month | Free trial | Visit |
 New Relic | Generous free data allowance | Free | Yes | Visit |
 Dynatrace | Enterprise auto discovery and root cause | See website | Free trial | Visit |
 Grafana Cloud | Open dashboards and metrics | Free | Yes | Visit |
 Splunk | Log and performance data at enterprise scale | See website | Free trial | Visit |
 AppDynamics | Business transaction performance | See website | Free trial | Visit |
 Sentry | Errors and release performance | $26 per month | Yes | Visit |
 Honeycomb | Debugging slow distributed requests | See website | Yes | Visit |
 LogicMonitor | Infrastructure and cloud performance | See website | Free trial | Visit |
The best performance information management software
This phrase does not point to one dominant product, so we took a plain reading: software that collects, stores, analyses and alerts on performance information and data from applications, servers and networks. The tools below all do that job, in different ways and at different scales.
Datadog brings infrastructure metrics, application traces, logs and synthetic checks into one place, so a team can follow a slow checkout from a user request to a database query without switching vendors. Its integration library covers major cloud services, and dashboards can combine metrics and logs for on call work. The bill is the main risk. Host pricing plus log and trace volume can compound, especially when a team turns on every product at once. Start with the modules you need, set usage limits, and review data volume after the first month.
- Wide coverage from infrastructure to logs and traces
- Many integrations
- Strong dashboards and alerts
- Per host and per gigabyte pricing can grow fast
- Learning the full platform takes time
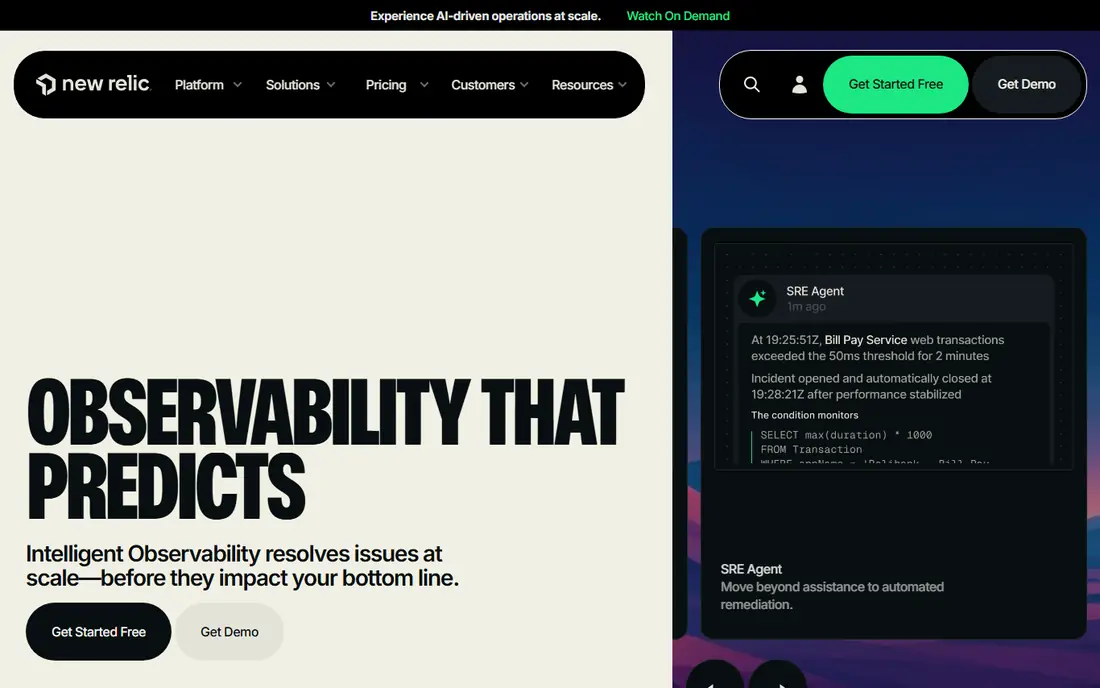
New Relic suits teams that want to start small and pay as data grows. The free tier covers a meaningful amount of monthly data, and paid pricing centres on data ingested plus platform users, which is easier to model than a long list of per host add-ons. Application performance, infrastructure and logs sit in the same platform. Watch the user side of the bill. As more engineers need full platform access, seat fees add up alongside data costs. For a small team with a few full users and many read only viewers, the model works well; for a large team, compare totals carefully.
- Free tier with 100 GB of data per month
- Full stack traces, logs and metrics
- Clear pricing by data and users
- Full platform user fees rise on paid plans
- Very large data volumes still cost a lot
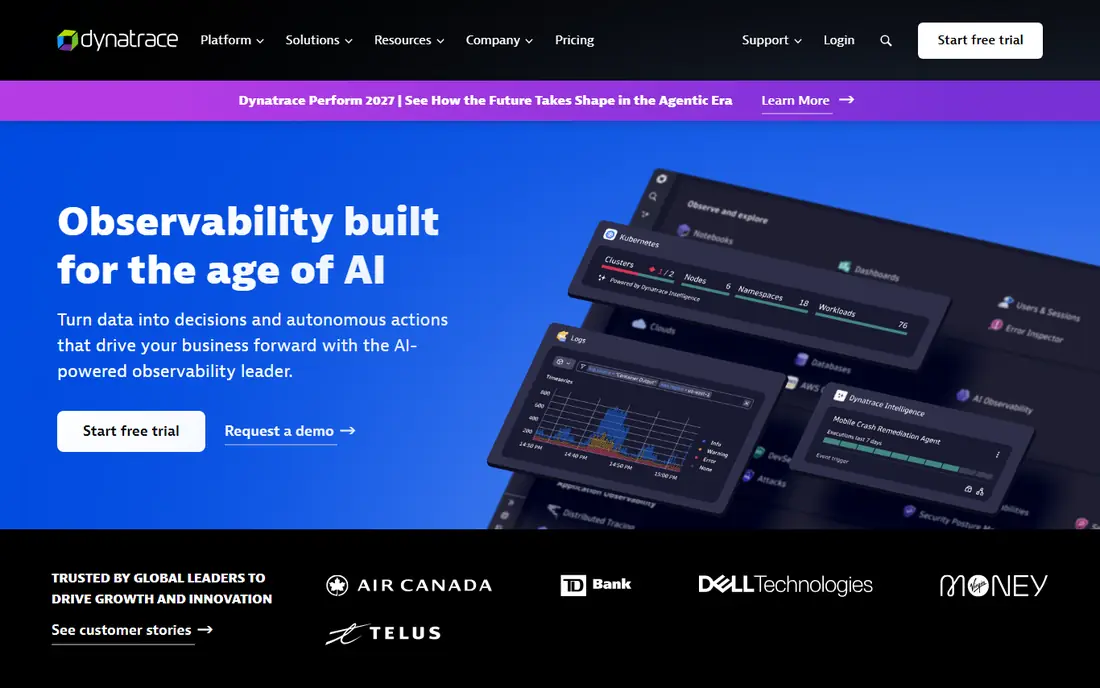
Dynatrace installs one agent that maps services, hosts and dependencies automatically, then ties performance problems to a likely cause rather than leaving engineers to guess across dashboards. Large, complex estates with many services benefit most, because manual mapping would take far longer. Smaller teams may find the platform more than they need, and the consumption pricing needs a worked example from the vendor for your host count and data volume. Ask for that example in writing, and trial it on your most complex service first.
- Automatic discovery of services and dependencies
- Causal root cause analysis
- Strong enterprise controls
- Quote and consumption based pricing is hard to compare
- Best value needs a larger, complex estate
Grafana Cloud is the dashboard first choice. Teams can visualise metrics, logs and traces from Prometheus, OpenTelemetry and other sources, build alerts, and share dashboards without locking performance data into one proprietary agent. The free tier suits small teams and side projects. The trade off is assembly. Grafana does not auto instrument every application in the way Dynatrace does, so teams need to plan instrumentation and data pipelines. Teams that already use open source tooling will find that work familiar; teams that want a fully managed agent may prefer Datadog or New Relic.
- Flexible dashboards from many data sources
- Open source roots and OpenTelemetry support
- Usable free tier
- You assemble more of the stack yourself
- Some enterprise features sit on paid plans
Splunk treats performance information as searchable data. Engineers can query logs, metrics and traces together, build dashboards for service health, and use the same platform for security investigations, which helps large organisations that already standardise on Splunk. Scale and search power are its strengths. Cost and complexity are the limits. Workload pricing needs careful modelling, and teams need query skills to get value from the platform. Smaller teams with simple estates will usually get faster results from Sentry, Grafana Cloud or New Relic.
- Powerful search across logs and performance data
- Strong security and compliance use
- Scalable for large estates
- Pricing is workload based and complex
- Setup and query skills take time to build
AppDynamics, part of Cisco, focuses on business transactions: a checkout, a booking or a claim, traced end to end with code level detail. That view helps teams explain a slowdown in business terms, such as which transaction type failed or slowed, rather than only reporting server CPU. It suits revenue critical applications where a slow journey costs sales directly. For small apps with a handful of services, the platform and its pricing model are heavier than needed. Larger teams with complex transaction flows should trial it on one critical journey and compare the diagnostic depth with Datadog and Dynatrace.
- Business transaction tracing tied to user journeys
- Code level diagnostics
- Useful for revenue critical apps
- Quote only pricing
- Platform can feel heavy for small applications
Sentry is the fastest route from code to an answer. Developers add a small SDK, and errors arrive with stack traces, release versions and performance data, so a bad deploy can be spotted and rolled back quickly. It suits product teams that care most about application errors and slow transactions. It is not a full infrastructure monitor. Server, network and database health still need another tool if you run your own infrastructure. Pair Sentry with Grafana Cloud or a cloud native monitor for that layer, and watch event volume caps on busy apps.
- Fast setup with a few lines of code
- Errors linked to releases and performance spans
- Clear team pricing
- Less full infrastructure coverage than Datadog
- High event volumes raise the bill
Honeycomb is built for the question that dashboards struggle with: why was this one request slow, for this one user, at this one time. It stores wide events with many fields, so engineers can slice traces by customer, endpoint, deploy or any other attribute without predefining every dashboard. Distributed teams with many services get the most value. The event based price needs care. High traffic apps can generate many events, so set sampling rules early and model a month of traffic before committing. For simple monoliths, Sentry or New Relic may answer the same questions with less setup.
- High cardinality event data for deep debugging
- Strong for distributed systems
- Free tier for small teams
- Pricing by events needs volume modelling
- Less of a general infrastructure dashboard than Grafana
LogicMonitor focuses on infrastructure and cloud performance data: servers, networks, storage, containers and cloud services, with automatic discovery and alerting. Operations teams that need a clear view of what is up, what is slow and what is about to run out of capacity will find it practical. Application code tracing is not its strongest area, so product teams that need deep transaction diagnostics should pair it with Sentry or an APM platform. Ask for a quote based on devices and cloud resources, and test alert noise on a real estate before rolling it out widely.
- Broad infrastructure and cloud coverage
- Automatic device discovery
- Useful alerting and forecasting
- Quote based pricing
- Application tracing is thinner than dedicated APM tools
How we picked these
We compared official feature and pricing pages for tools that collect, store and analyse performance information, including metrics, logs, traces and alerts, and we kept only tools still sold in October 2026. We favoured tools with clear documentation and a current free tier or trial where one exists, and we wrote See website where pricing is quote or consumption based rather than inventing a flat price.
What to check before you buy
Start with the performance question you need to answer most often. If it is which code is slow, pick an APM tool such as Sentry, New Relic or Datadog. If it is which server or network is at fault, pick an infrastructure tool such as LogicMonitor or Grafana Cloud. If it is why one request behaved oddly, Honeycomb or a trace focused APM tool fits better. Next, model the bill on your own numbers. Count hosts, monthly data volume, events and full users, and ask each vendor for a worked total for those numbers. Set data caps, sampling and retention limits from day one, and review the first invoice against the model. Finally, instrument with OpenTelemetry where the tool supports it, so performance data stays portable if you change vendors later.
Frequently asked questions
What does performance information management software actually do?
It collects performance data such as metrics, logs and traces, stores it, analyses it and alerts teams when something slows down or fails. Our reading covers application, infrastructure and log tools, since no single product owns this exact phrase.
Is there one dominant product for this category?
No single product clearly owns the phrase, so we compared tools by the job they do rather than inventing a winner. Datadog, Dynatrace and New Relic lead on full stack coverage, while Grafana Cloud, Sentry and Honeycomb lead on specific strengths.
How much does performance monitoring cost?
It depends on the model. Some tools charge per host, starting around $15 per host per month, others charge per gigabyte of data or per event, and enterprise tools are quote based. Model your hosts, data and users before comparing prices.
Can I start for free?
Yes, within limits. New Relic, Grafana Cloud, Sentry and Honeycomb all offer free tiers, and most others offer trials. Free tiers cap data, users or retention, so growing systems eventually pay.
Do I need APM if I already monitor servers?
Server monitoring tells you a server is slow, but it does not always tell you which code path or database query caused it. APM adds traces and code level detail, which matters most for slow user journeys where servers look healthy.
How do I avoid a surprise bill?
Set usage limits, sample high volume traces, limit log ingestion, and review retention settings. Check the first month invoice against the vendor worked example, and adjust sampling before data volume grows.
Sources
See where you really rank - block by block
ProMapRanker scans Google Maps across a grid of your service area. Simple monthly plans from $19, white-label on every plan.
Start freeKeep reading
 what’s the best risk software for enterprises
What Is the Best Risk Software for Enterprises in 2026
We compared what’s the best risk software for enterprises on risk registers, controls, third-party risk, and reporting, with pricing notes for large teams.
Read → what's the best pam software for enterprises
What is the Best PAM Software for Enterprises in 2026
Find what's the best pam software for enterprises, with vaulting, session recording, just in time access and pricing compared for large enterprise IT teams.
Read → what’s the best grc software
What Is the Best GRC Software in 2026
We compared what’s the best grc software on risk, compliance, audit and vendor risk, so teams can pick a platform that fits their frameworks and budget.
Read →